
FIGURE 1.
![Study area within Wilanów Palace, with dots representing the specific locations of detailed ground temperature measurementsSource: Points, overlay area – own elaboration; background – OpenStreetMap contributors (2023) Planet dump [data file from 2023]. Retrieved from https://planet.openstreetmap.org.](https://sciendo-parsed.s3.eu-central-1.amazonaws.com/68dea11181e1b93419692449/j_srees.5619_fig_001.jpg?X-Amz-Algorithm=AWS4-HMAC-SHA256&X-Amz-Content-Sha256=UNSIGNED-PAYLOAD&X-Amz-Credential=AKIA6AP2G7AKOUXAVR44%2F20251203%2Feu-central-1%2Fs3%2Faws4_request&X-Amz-Date=20251203T162003Z&X-Amz-Expires=3600&X-Amz-Signature=d11ec3db3ffbc7744627cc9c78258e504966165890a89046971f017ab893b44f&X-Amz-SignedHeaders=host&x-amz-checksum-mode=ENABLED&x-id=GetObject)
FIGURE 2.
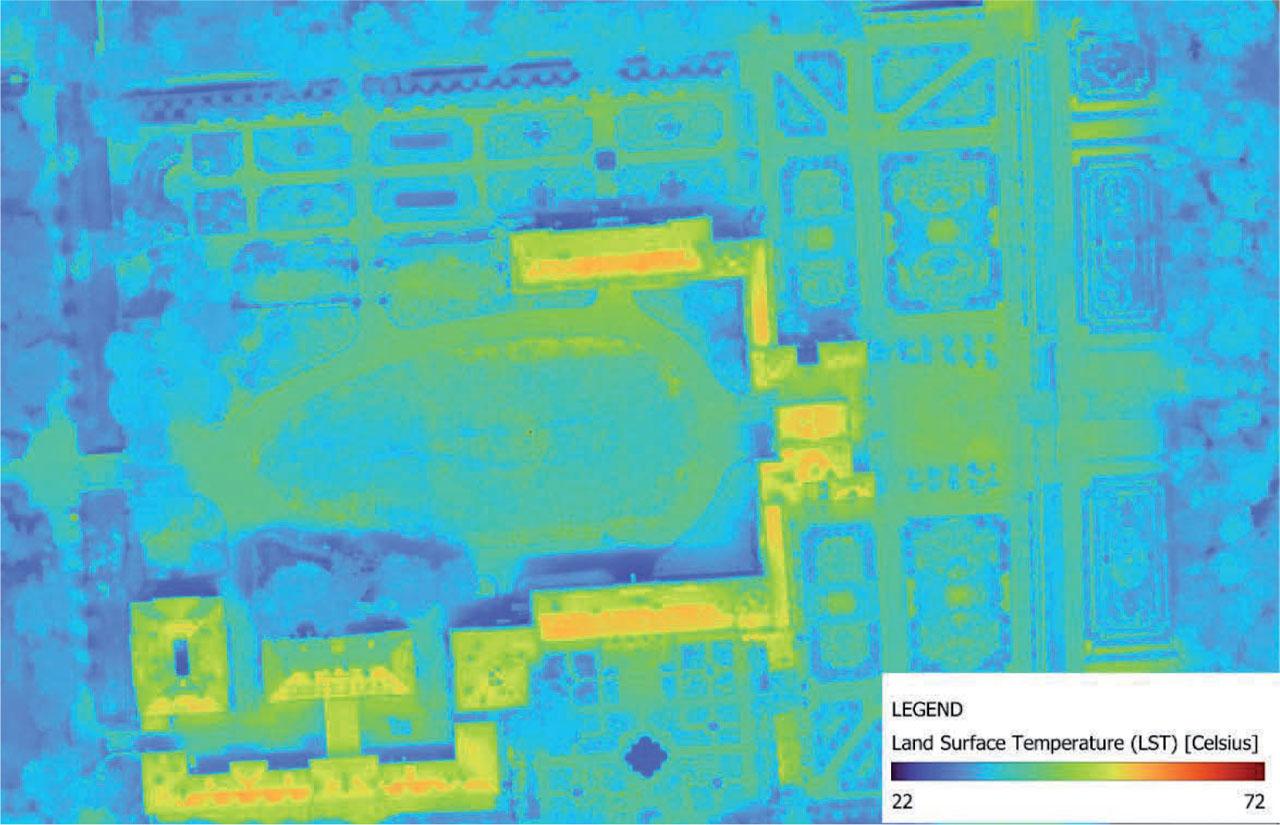
FIGURE 3.
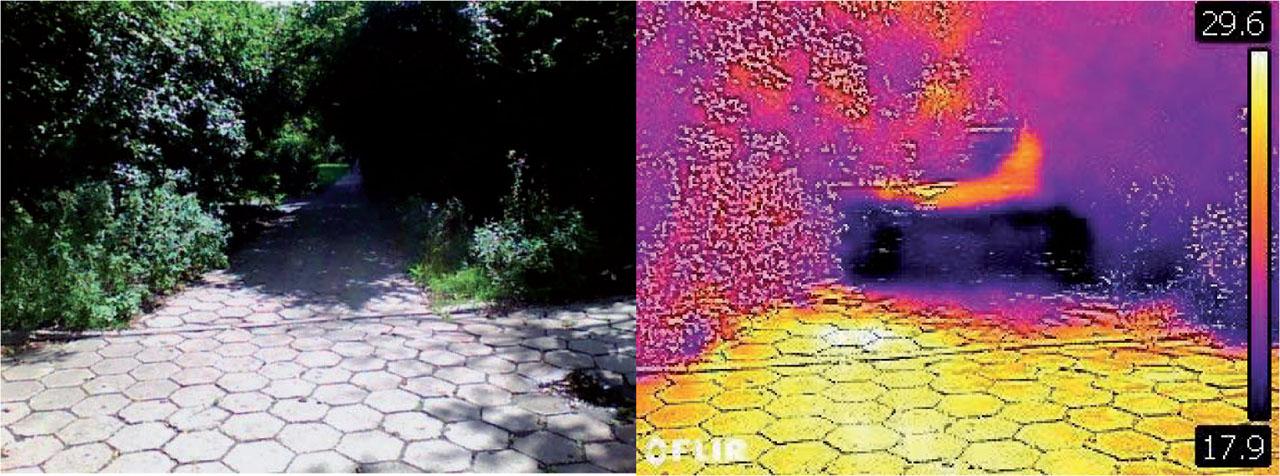
FIGURE 4.
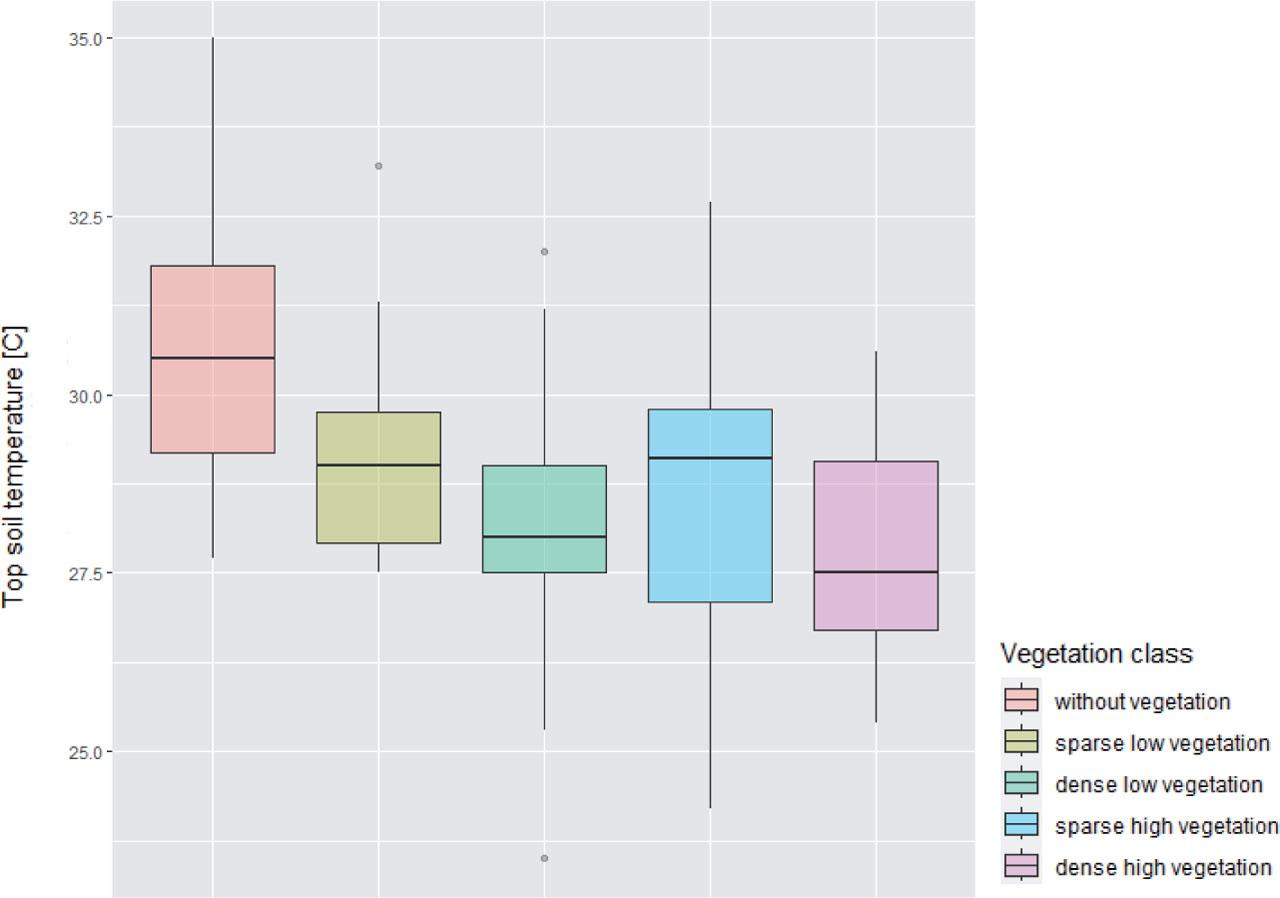
FIGURE 5.
Correlations matrix between temperature characteristics and normalized difference vegetation index (p < 0_05) Spearman's correlation
| Parameter | Mean | SD | 1 |
|---|---|---|---|
| Normalized difference vegetation index NDVI | 0.29 | −0.19 | – |
| Topsoil temperature (field measurements) | 28.97 | 2.00 | −0.57 |
| Land surface temperature (UAV) | 34.58 | 3.57 | −0.41 |
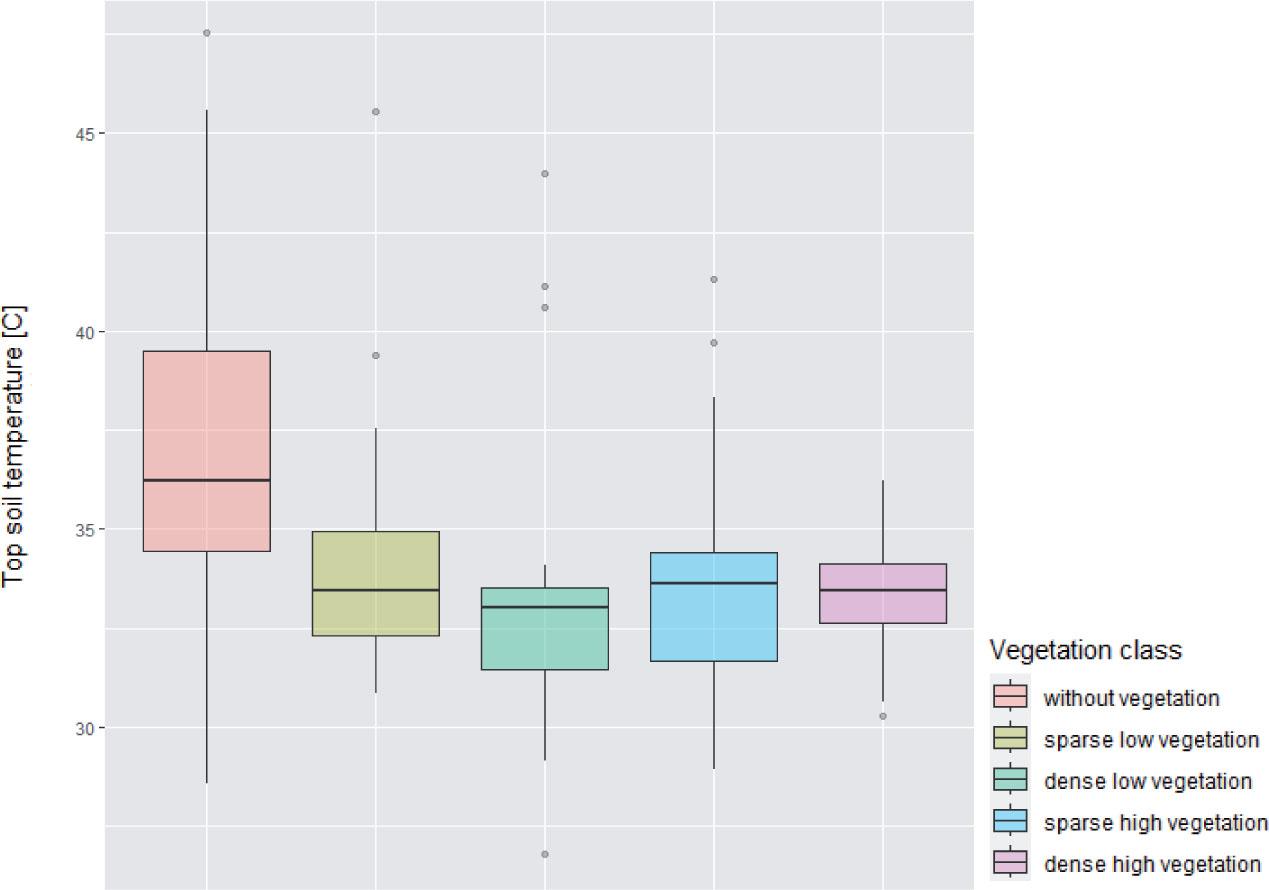
Comparison of vegetation characteristics and temperature (TST and LST) for distinguished vegetation classes, significant differences represented by homogenous groups (a–e) at p < 0_05
| Vegetation class | Mean LAI | LAI SD | Mean TST | Homogenous groups – Tukey's p < 0.05 | TST SD | Mean LST (UAV) | Homogenous groups – Dunn's p < 0.05 | LST SD |
|---|---|---|---|---|---|---|---|---|
| Dense high vegetation | 4.50 | 3.13 | 27.74 | c | 1.46 | 33.32 | e | 1.34 |
| Sparse high vegetation | 3.52 | 3.11 | 28.54 | bc | 1.99 | 33.61 | d | 2.69 |
| Dense low vegetation | 4.35 | 2.86 | 28.14 | bc | 1.93 | 33.37 | c | 3.95 |
| Sparse low vegetation | 2.88 | 2.56 | 29.12 | b | 1.39 | 34.16 | b | 3.23 |
| Without vegetation | NA | NA | 30.51 | a | 1.58 | 36.89 | a | 4.13 |