
Cultural heritage sites (CHS), particularly those in the suburbs of large European metropolises, play a unique and multifaceted role in urban landscapes. Examples such as the Wilanów Palace in Warsaw, once royal residences, have undergone intense urbanization in recent decades. These sites, absorbed into the urban fabric, have transformed into enclosed urban parks surrounded by high-rise buildings, offering not only a glimpse into shared cultural history, but also acting as crucial green spaces in urban environments (Tengberg et al., 2012). They contribute to local climate regulation, air quality improvement, and biodiversity conservation, yet the specific role of vegetation in these settings has not been thoroughly examined, marking a notable gap in urban ecology research, particularly in the context of CHS management (Wang et al., 2020).
Despite their significance, CHS like the Wilanów Palace are increasingly threatened by urban development, leading to ecological challenges such as habitat degradation and landscape fragmentation (Tengberg et al., 2012). This highlights an urgent need for effective strategies to evaluate and enhance the ecological functions and ecosystem services of CHS within complex urban ecosystems (Tengberg et al., 2012). This emphasizes an urgent need for tailored strategies to evaluate and enhance the ecological functions and ecosystem services of CHS within complex urban ecosystems (Andersson et al., 2021).
Focusing on ecosystem services, especially climate regulation, urban parks and green spaces within CHS have been documented to mitigate urban heat island effects (Bowler, Buyung-Ali, Knight & Pullin, 2010; Peng et al., 2021; Sikorski et al., 2021). Previous studies have utilized microclimatic approaches, employing temperature sensors to compare vegetated and non-vegetated areas, revealing the mitigation of urban heat island effects (Heidt & Neef, 2008; Trojanowska, 2022). However, advancements in remote sensing technologies have enabled more sophisticated multi-methodological assessments. Tools like the normalized difference vegetation index (NDVI) offer quantitative and qualitative measures of vegetation which can be correlated with land surface temperature (LST) to assess temperature distribution within urban green spaces and evaluate cooling benefits of urban green spaces (Weng, Lu & Schubring, 2004; Pettorelli et al., 2005).
In this study we focus on the following research questions:
What are the comparative cooling effects of different vegetation classes (dense high, sparse high, dense low, sparse low vegetation) within the CHS context?
How does the integration of remote sensing and ground-based measurements enhance the understanding of ecosystem services, particularly cooling benefits, provided by urban green spaces in CHS like Wilanów Palace?
How do the findings on temperature variability across different vegetation types contribute to the development of sustainable urban planning and conservation strategies for CHS?
The overarching goal of this study is to deepen our understanding of the cooling effects of urban greenery in CHS and provide information on sustainable urban planning and conservation strategies.
The study focuses on the Wilanów Palace, a recognized CHS in the suburban precincts of Warsaw, Poland's capital, with a population nearing 2 million and an area of 517.2 km2 (Statistics Poland, 2022). This site, with its origins in the 17th century, holds significant historical value. Integral to this study is the extensive green space surrounding the palace, which is not only a key aesthetic component, but also a vital ecological resource. These vegetated areas contribute substantially to the ecosystem services of the locale, with their value previously assessed to exceed EUR 500,000 annually in ecological benefits (Zawojska, Szkop, Czajkowski & Żylicz, 2016). The focus of our investigation is to understand the role these green spaces play in local climate regulation, specifically their contribution to cooling within the urban ecological context of the Wilanów Palace. The palace's green spaces consist of a variety of vegetation, including tall trees, manicured gardens, and dense shrubbery, which collectively enhance the local climate. The site offers a unique combination of meticulously maintained gardens and near-wild forested areas, making it an ideal location for assessing the cooling influence of different types of vegetation within a CHS.
Given the palace's location adjacent to Wilanów Lake, the study also considers the potential synergistic effects of water bodies and vegetation in climate regulation (Setiawan & Gawryszewska, 2023). The palace's verdant landscapes serve as a natural oasis within the urban fabric of Warsaw, offering a compelling case study for the assessment of cooling benefits through a combination of remote sensing technologies and ground-based measurements.
Our study investigating the cooling benefits at the Wilanów Palace integrated various data collection techniques to evaluate the impact of vegetation on local climate regulation. The methodology encompassed in-situ ground measurements of topsoil temperature (TST), complemented by UAV-derived thermal imagery. Additionally, we employed LAI-ground measurements, LiDAR, and NDVI for a detailed classification of vegetation, which was subsequently correlated with temperature data (Fig. 1).
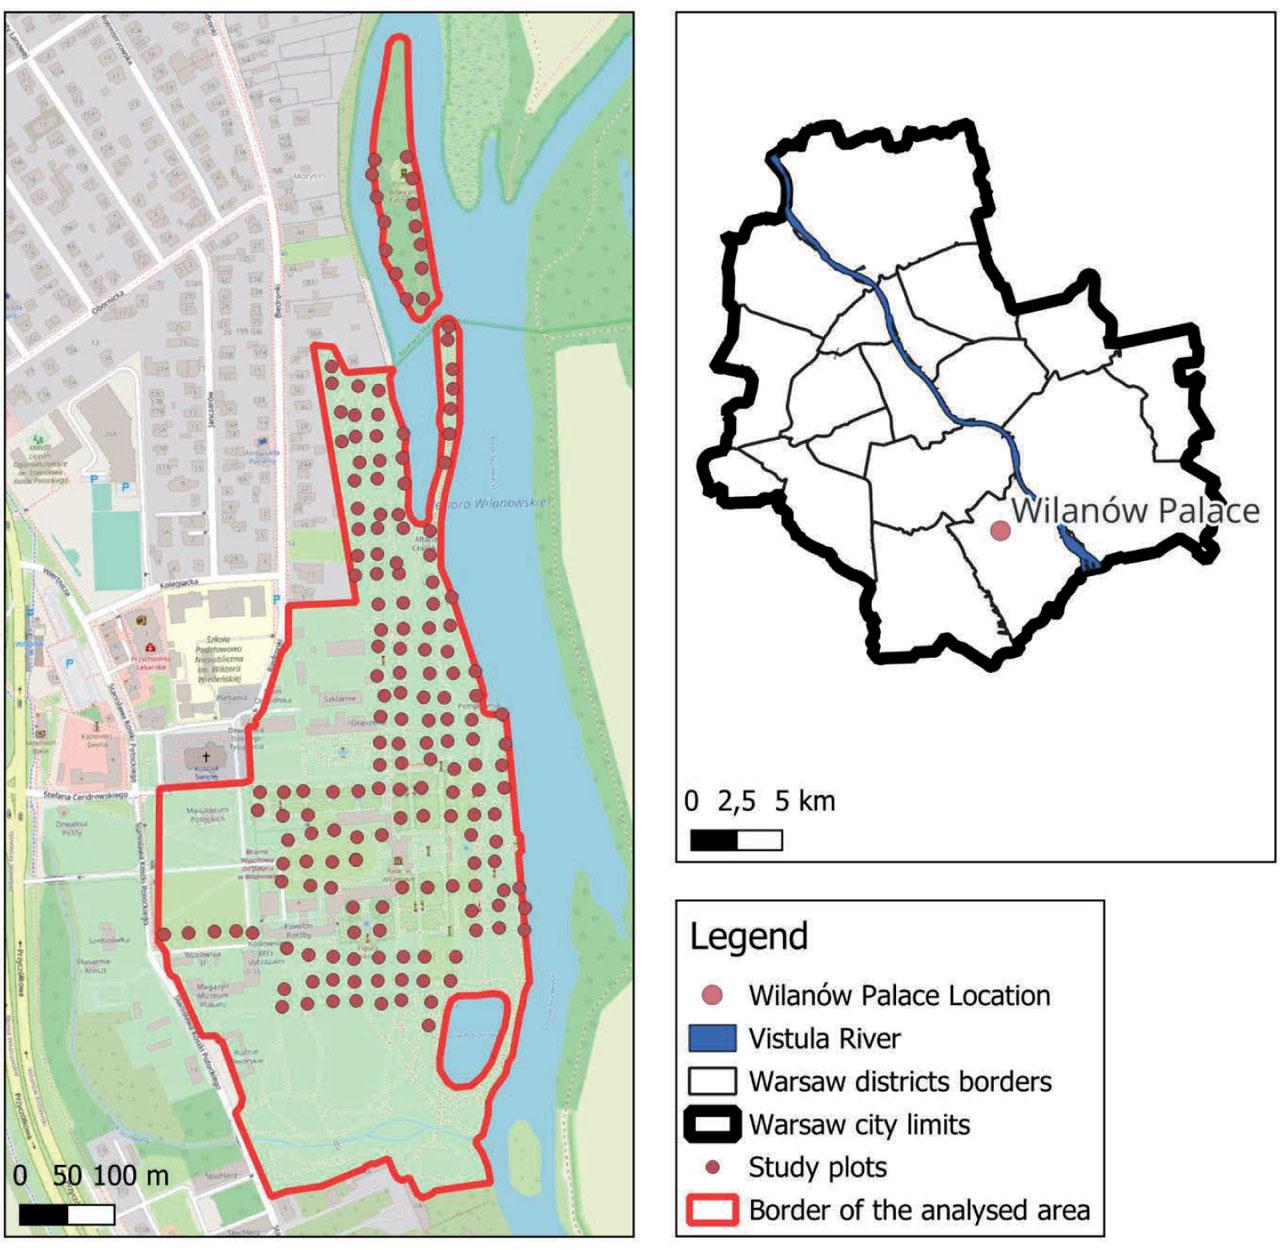
Study area within Wilanów Palace, with dots representing the specific locations of detailed ground temperature measurements
Source: Points, overlay area – own elaboration; background – OpenStreetMap contributors (2023) Planet dump [data file from 2023]. Retrieved from https://planet.openstreetmap.org.
All measurements were conducted on the hottest summer day, characterized by a maximum temperature exceeding 30°C over a period of one week. The data recorded, both ground-based and aerial, provided precise, localized insights into temperature variations and vegetation characteristics (Fig. 1).
The Wilanów Palace grounds were methodically segmented into a 25 × 25 m2 grid, specifically designed to represent the site's diverse vegetation. In study plot, we recorded the topsoil temperature (TST) at the center, making adjustments for any physical obstructions. This approach included all vegetation types, extending under tree canopies where feasible, to comprehensively assess the cooling effects of various vegetation. The top 0–10 cm soil layer was analyzed using a TDR HH2 Moisture Meter by Delta-T Devices. Additionally, in each plot, the leaf area index (LAI) was measured as an indicator of leaf volume (Nagendra, 2002) using the SunScan Canopy Analysis System, also by Delta-T Devices. For assessing the temperature of impermeable surfaces, a FLIR C3 thermal camera was employed. The data collection, conducted on August 2, 2023, resulted in a total of 170 temperature and vegetation samples. Precise geographical coordinates for each data point were recorded using a handheld GPS device with an accuracy of 0.5 m (Fig. 1).
To acquire a comprehensive temperature gradient within the study area, we employed UAV thermal imagery captured by a DJI Mavic 3T drone to acquire surface temperature data within our study area. The UAV mission was conducted concurrently with ground sample collection. Thermal images were processed using IRimage-UAV software (Irujo, 2022) integrated within ImageJ software (Schneider, Rasband & Eliceiri, 2012) to generate raster tiles in degrees Celsius (Schneider et al., 2012). Subsequently, we utilized OpenDroneMap software to further process the thermal imagery. This software was utilized to mosaic raster tiles, allowing us to acquire an accurate orthophotomap that presents a LST.
For the vegetation classification in our study, we initially accessed light detection and ranging (LiDAR) data from a publicly available repository managed by the Head Office of Geodesy and Cartography (Główny Urząd Geodezji i Kartografii [GUGiK] 2022). Utilizing the R programming language (R Core Team, 2021) and the lidR package (Roussel et al., 2020), we processed the raw LiDAR data (laz files format) to produce two key models: a digital terrain model (DTM) and a digital surface model (DSM). The DTM was developed using a spatial interpolation algorithm based on a k-nearest neighbor approach (k-NN) with inverse-distance weighting, while the DSM was constructed via Delaunay triangulation (DT) of first returns, employing linear interpolation within each triangle. By subtracting the DTM from the DSM, we obtained a model representing the height of all objects in the study area.
Concurrently, we acquired high-resolution (0.25 × 0.25, June 2022) aerial color-infrared (CIR) photographs (GUGiK, 2022) and converted them into normalized difference vegetation index (NDVI) images using the R package terra (Hijmans et al., 2023) following Crippen's method (Crippen, 1990). The NDVI images were then resampled to a spatial resolution of 1 × 1 m. Applying a thresholding approach, pixels with NDVI values below 0.2 were classified as non-vegetated areas (Hashim, Abd Latif & Adnan, 2019).
The next phase involved merging the height model and the processed NDVI images. Here, raster values equal to or greater than 2 m were categorized as high vegetation, and those below 2 m as low vegetation. This process resulted in a final raster product categorizing the study area into three distinct classes: non-vegetated areas, low vegetation, and high vegetation.
Further refinement was achieved by incorporating field-collected LAI data, allowing us to subdivide the low and high vegetation categories into sparse and dense types. Consequently, our research area was delineated into five classes: non-vegetated areas, sparse low vegetation, dense low vegetation, sparse high vegetation, and dense high vegetation (Turner et al., 2015).
Finally, we correlated each ground sample point with its corresponding LST, NDVI, and vegetation class values, creating a comprehensive dataset for our analysis.
In our statistical analysis, the primary objective was to elucidate the interaction between the vegetation structure and temperature variations. Recognizing the heterogeneity in our dataset, with some segments deviating from normal distribution, we adopted a dual approach. For data adhering to a normal distribution, parametric tests were utilized, while non-parametric tests were applied to the non-normally distributed segments. Specifically, to explore the relationship between NDVI values and both ground and surface temperatures, Spearman's correlation tests were conducted. Additionally, our analysis aimed to identify significant temperature differences across various vegetation classes. This involved the use of Dunn's multiple comparison test for non-normally distributed data and the Tukey's test for data following a normal distribution. These tests were instrumental in discerning the distinct thermal characteristics attributable to different vegetation types.
All statistical procedures were meticulously carried out using R software, version 3.4.4, ensuring rigorous data analysis and reliable results.
Our findings indicate a clear relationship between vegetation type and temperature. In areas characterized by the most dense and highest vegetation, the lowest temperatures were recorded, corroborating the cooling benefits of such vegetation (Fig. 2). Conversely, the highest temperatures were observed on sandy and concrete paths, as well as on grass lawns. This temperature gradient, attributable to the cooling effects of vegetation, is vividly illustrated in the thermal imagery captured along one of the paths in Wilanów Park (Fig. 3).
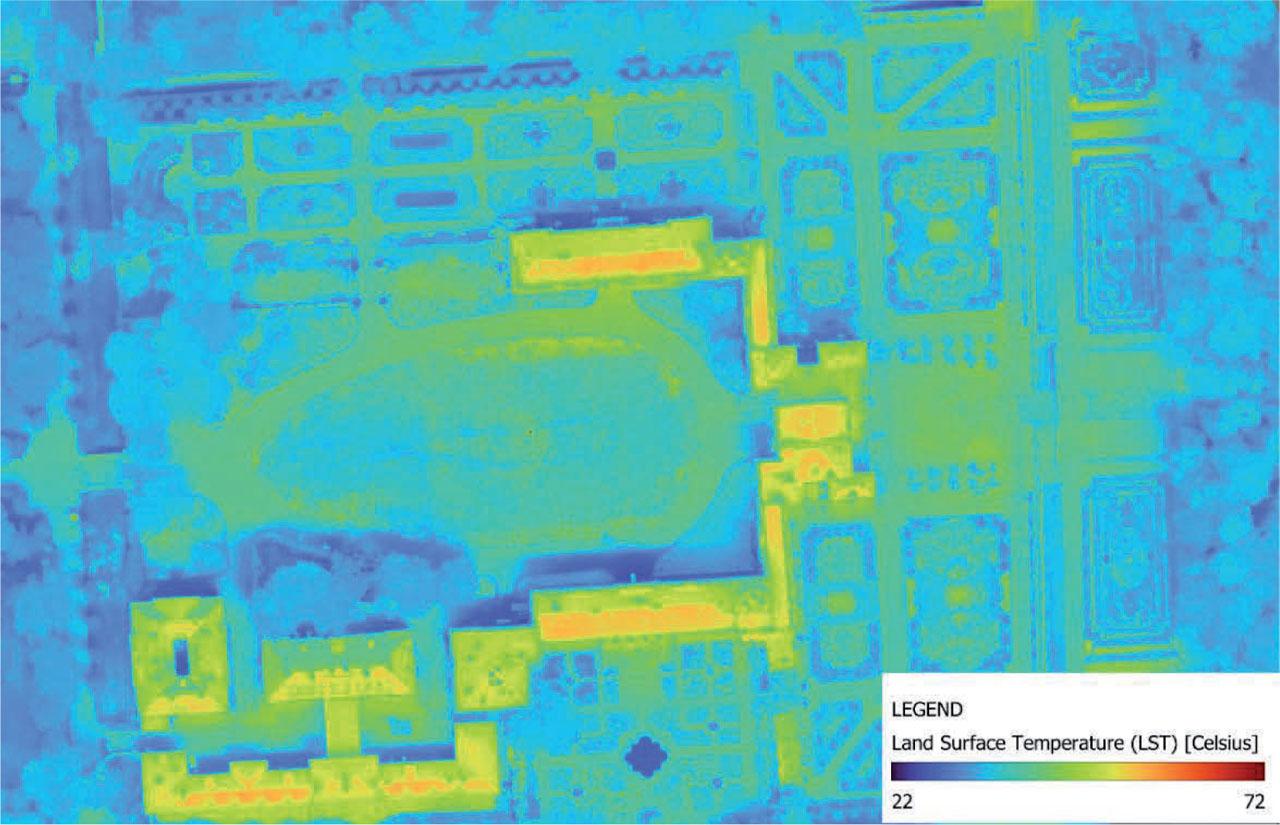
Fragment of LST map acquired from the drone aerial photography
Source: own elaboration.
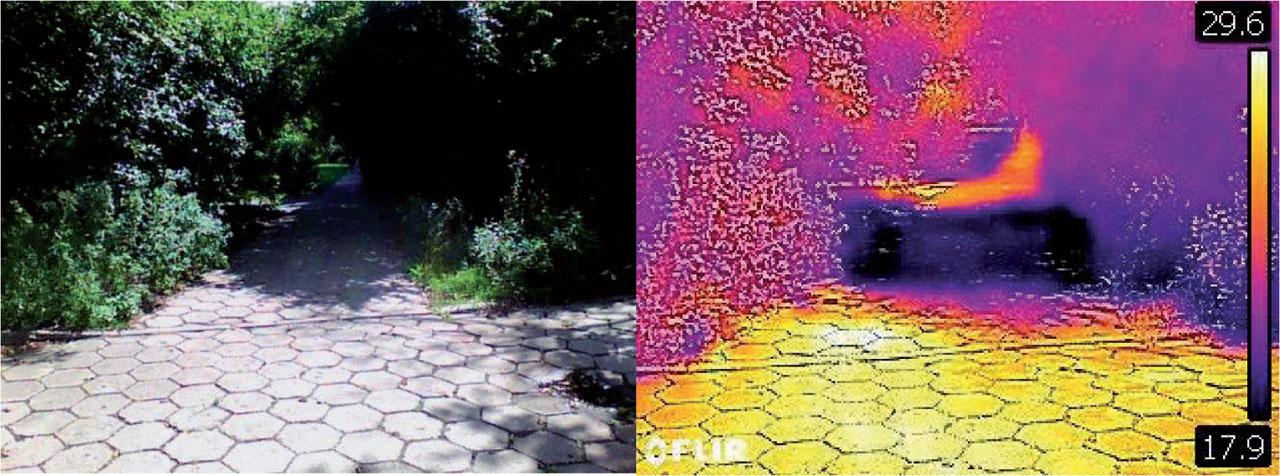
Infrared (right), and RGB (left) picture, taken down one of the paths in the Wilanów Park
Source: own elaboration.
The UAV-based LST measurements ranged from 26.8° to 47.5°C, aligning with the ground-based topsoil temperature (TST) measurements, which varied between 19.5° and 29.2°C (Fig. 2). Notably, the highest recorded LST reached 72°C at some locations (metal rooftops of buildings), which warrants further investigation for its potential implications on microclimates within the CHS (Baryła, Karczmarczyk, Bus & Witkowska-Dobrev, 2019).
Statistical analysis revealed significant differences in temperature characteristics among various vegetation classes (Table 1). Specifically, areas with higher LAI values exhibited lower LST and TST compared to areas with lower LAI, substantiating the cooling benefits of denser vegetation.
Comparison of vegetation characteristics and temperature (TST and LST) for distinguished vegetation classes, significant differences represented by homogenous groups (a–e) at p < 0.05
| Vegetation class | Mean LAI | LAI SD | Mean TST | Homogenous groups – Tukey's p < 0.05 | TST SD | Mean LST (UAV) | Homogenous groups – Dunn's p < 0.05 | LST SD |
|---|---|---|---|---|---|---|---|---|
| Dense high vegetation | 4.50 | 3.13 | 27.74 | c | 1.46 | 33.32 | e | 1.34 |
| Sparse high vegetation | 3.52 | 3.11 | 28.54 | bc | 1.99 | 33.61 | d | 2.69 |
| Dense low vegetation | 4.35 | 2.86 | 28.14 | bc | 1.93 | 33.37 | c | 3.95 |
| Sparse low vegetation | 2.88 | 2.56 | 29.12 | b | 1.39 | 34.16 | b | 3.23 |
| Without vegetation | NA | NA | 30.51 | a | 1.58 | 36.89 | a | 4.13 |
Source: own elaboration.
Statistical analysis ANOVA with post-hoc Tukey, HSD for TST distinguished four types of vegetation: dense high vegetation, sparse high vegetation, dense low vegetation and sparse low vegetation. Analysis with Dunn's test showed that all these groups have significantly different from each other.
The Spearman's correlation test indicated significant negative correlations between both TST and NDVI (−0.57) and between LST and NDVI (−0.41), (Table 2). These findings suggest that increased vegetation, as indicated by higher NDVI values, is associated with lower temperatures.
Correlations matrix between temperature characteristics and normalized difference vegetation index (p < 0.05) Spearman's correlation
| Parameter | Mean | SD | 1 |
|---|---|---|---|
| Normalized difference vegetation index NDVI | 0.29 | −0.19 | – |
| Topsoil temperature (field measurements) | 28.97 | 2.00 | −0.57 |
| Land surface temperature (UAV) | 34.58 | 3.57 | −0.41 |
Source: own elaboration.
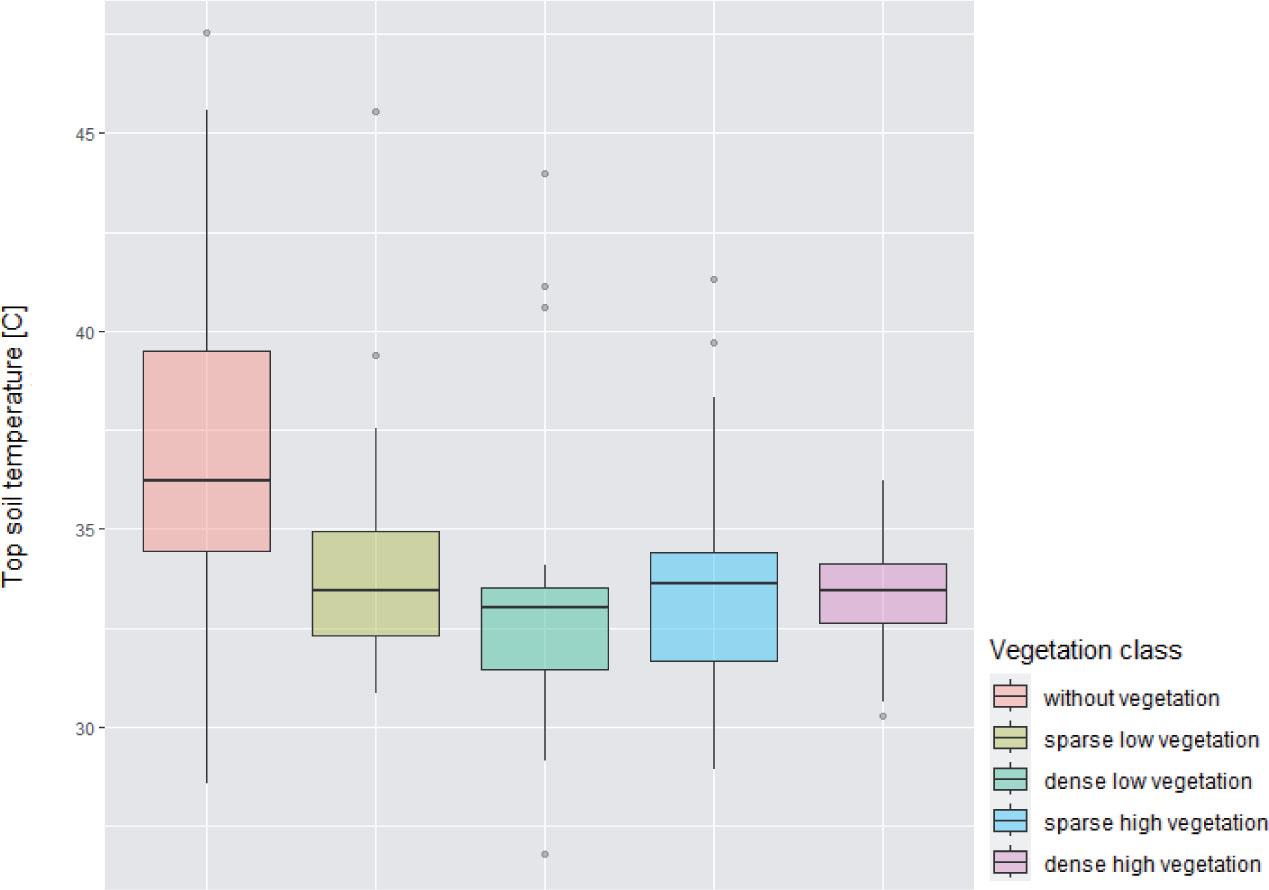
It is worth noting that the lowest TST values were particularly observed in areas with dense vegetation, both low and high (Fig. 4). Furthermore, both LST and TST were significantly lower in vegetated areas compared to non-vegetated areas (Figs 4 and 5).

Boxplot illustrating topsoil temperature (TST) across different vegetation types
Source: own elaboration.
Boxplot illustrating land surface temperature (LST) derived from UAV equipped with thermal camera
Source: own elaboration.
The correlation coefficient between TST and NDVI is −0.57; and between LST and NDVI is −0.41; and the p-value of both tests is below 0.05, which means that both of those correlations are significant (Table 2).
Additionally, we must also note that TST values were lowest especially in areas with dense vegetation, for both low, and high vegetation (Fig. 4). Moreover, it is worth mentioning that both LST, and TST were significantly lower in vegetated areas in comparison to areas without vegetation (Figs 4 and 5).
Our study, leveraging remote sensing techniques for urban ecosystem service assessment (García-Pardo, Moreno-Rangel, Domínguez-Amarillo & García-Chávez, 2022), highlights the significant impact of vegetation on both land surface temperature (LST) and topsoil temperature (TST) within the contrasting environment of a city park. This approach, necessitating high-resolution spatial data (Chen, Xu, Yang, Wu & Zhu, 2020; Voogt & Oke, 2023), is exemplified in our case study of the Wilanów Palace's urban park with its dense tree cover and open areas. Our findings align with existing research (Oke, 1987; Chen, Zhao, Li & Yin, 2006), emphasizing urban parks, particularly older ones, as ‘cool islands’ significantly influencing their surroundings. For instance, park vegetation can noticeably cool air temperatures up to 520 m away, with reductions of 1.6°C at 130 m and 0.9°C at 280 m (Aram, Solgi, Garcia & Mosavi, 2020).
We confirmed the general principle that parks broadly impact air and ground temperatures, a crucial aspect for CHS like the Wilanów Palace. However, this also raises questions about the extent to which TST, easily and inexpensively measured through remote sensing, can substitute for LST. While a close relationship between LST and TST is often assumed, this premise, particularly at a micro-scale, requires further investigation. LST is more directly linked to human comfort, health, and mortality (Shahidan, Shariff, Jones, Saalleh & Abdullah, 2010; Masselot et al., 2023), whereas TST plays a significant role in drought monitoring for plants, energy transfer modeling in ecosystems, and global carbon cycle assessment (Xu, Qu, Hao, Zhu & Gutenberg, 2020). High-resolution applications often rely on the fusion of satellite-measured TST data and validation based on vegetation parameters, primarily the normalized difference vegetation index (NDVI), (Xu et al., 2020).
Field measurements indicated significant temperature variations between lawns and wooded areas (Figs 4 and 5), with more pronounced differences than between types of greenery. The influence of shading was a key factor in these differences. The results demonstrate that both lawns and tree canopies can effectively cool surfaces, thus aiding in reducing urban heat islands during heatwaves. However, lawns have a minimal impact on human comfort, whereas tree shade can provide effective local cooling (Armson, Stringer & Ennos, 2012). Urban climate models show that the average TST in urban areas decreases by only about 3.06°C, highlighting the significant role of shading (Schwaab et al., 2021).
It is important to note that in the context of LST, we found dense high vegetation to be statistically warmer than a low one (Fig. 5). One possible explanation of this phenomenon is LST being measured from air, canopies of tall trees have an increased exposure to sunlight what vegetation is contributing to higher temperatures.
Our study at the Wilanów Palace revealed a crucial disparity between LST, recorded via UAV, predominantly reflecting canopy temperature, and TST, more indicative of the temperature experienced by park users. While the lowest LST across vegetation categories ranged from 35° to 45°C, TST measurements were significantly lower, with dense low vegetation recording a minimum of 19°, and tall sparse vegetation around 22°. The median TST values were notably lowest for tall dense vegetation.
This disparity suggests that UAV-derived LST, while insightful for canopy temperatures, may not fully capture the thermal experience at the ground level. The lower TST in areas with dense, tall vegetation indicates more substantial cooling benefits, enhancing thermal comfort for park visitors. This distinction is vital for urban planners and conservationists in managing green spaces within CHS, aiming to maximize ecological benefits and human comfort. Furthermore, the study underscores the role of trees in limiting solar radiation penetration and lowering surface and air temperatures in shaded areas (Roy, Byrne & Pickering, 2012; Schwaab et al., 2021). The temporal-spatial variability of evapotranspirative cooling, changing with the leafiness of deciduous trees (Song & Wang, 2015), and the potential adverse effects of urban trees on air pollution dispersion (Morani, Nowak, Hurabayashi & Calfapietra, 2011; Li & Wang, 2018) are also significant considerations.
The study's implications are multifaceted. It reinforces the vital role of green spaces in CHS, especially amid urban expansion, and informs adaptive landscape management strategies for historical sites like Wilanów Palace (Akkurt et al., 2020). Our methodologies offer a replicable framework for similar studies in other CHS, contributing to the broader discourse on microclimate regulation within these unique environments. However, future research should expand this study's scope by including additional environmental variables such as humidity, wind speed, and solar radiation, and considering temporal variations. By deepening our understanding of these dynamics, we can make informed decisions that optimally preserve both the historical and ecological value of CHS landscapes.
In conclusion, vegetation significantly impacts both LST and TST, with the potential to reduce temperature gradients by over 5°C in CHS. Such comprehensive studies will enable informed decisions for preserving the historical and ecological values of CHS landscapes.