
Disasters can be defined as the failure of systems or negative results of a system. Unexpected disasters can be generated naturally (such as an earthquake, fires, etc.) or through human activities such as war, man-made pollution, nuclear explosions, etc.). Disaster waste and debris can be generated during an actual disaster, or later during inaccurate planning in response phases. Depending on their type and severity plus unsuccessful management plans, disasters will create large amounts of debris. Through understanding the actual situation of a city, it is necessary to make usable waste disposal procedures with applicable policies and scenarios before the disaster strikes the region (Hirayama, Shimaoka, Fujiwara, Okayama & Kawata, 2010; Wei, Hu & Liu, 2021).
To find a reliable method for the reconstruction of a residential area that had been destroyed, this paper starts to examine both the disaster outcomes and consequences that can result from them. It is known that the debris resulting from the demolition of buildings, whether due to natural disasters such as earthquakes or unnatural ones such as wars, is a major obstacle to reconstruction. This issue has been discussed in many kinds of literature. However, more studies are still needed, especially after the destruction caused by the recent earthquakes in Turkey, and the wars in Ukraine, Syria, and Yemen, for example. So far, no integrated solution has been found to meet both the financial requirements of the citizens affected by the disasters and the economic requirements of local governments.
Several studies have been conducted to establish an efficient management technique and guidelines for disaster waste. Whereas other studies conducted in recent years have demonstrated the importance of recycling technology, and suitable temporary storage sites. Lorca, Çelik, Ergun and Keskinocak (2015) presented a support tool to assist disaster management by optimizing the environmental costs and the number of recycled materials generated. By deciding on operational and readiness plans, the support tool may be useful in comprehending the repercussions at stake. Hu and Sheu (2013) proposed a linear programming model to minimize reverse logistics costs and corresponding environmental risks for post-disaster debris. On the other hand, several researchers have addressed developing cost models for predicting disaster debris and waste. Soichiro, Akiyama, Tanouchi, Egusa and Otsuka (2021) developed a dynamic hauling/transportation model (DHT model) after describing the issues that contribute to the implementation of disaster waste disposal plans. Sakaguchi, Tanouchi, Egusa and Otsuka (2018) proposed a numerical model simulating waste transportation, temporary storage areas, and final disposal site. The truck numbers in addition to capacities of temporary storage areas are located in most of the proposed models and kinds of literature.
However, although the importance of recent disaster models, the literature on off-site and on-site disaster assessment are far from common factors and complex environmental circumstances yet. Therefore, many disaster response activities may not be able to establish a long-term cooperative official guideline on how to handle the recovery stage with the assistance of the locals.
The linear dynamic transportation model (LDT) was modified after estimating the optimal time (in days) required for disaster debris disposal through the following parameters and factors; (1) debris flow volume in a certain zone area; (2) debris withdrawal volume in the selected zone; (3) debris characteristics, (4) critical route/path for vehicles. The outcome of this model will assist the local governorate with the development of a plan that more fully considers the needs of its plans through comprehend the required number and capacities of curbside pickups/truck vehicles, the ultimate capacity of temporary and secondary waste storage, optimum final disposal site and/or reusing the demolition debris resulting from the building.
Generally, the quality and quantity of debris produced vary according to the type of residence and the type of city. For example, most of the housing sector and materials used in urban cities differ from those in villages. To increase the number of application possibilities, a model specialized for a target city is demanded. In this study, we used the LDT model in Kirkuk, Iraq, as a new case study. This model can be used to compare different cities, particularly those that have been destroyed by wars, through further research. Increasing competition and disputes among countries across the world, especially in unstable political regions, raise concerns about the recovery actions needed by the government and how they would help to rebuild the damaged areas after crises and conflicts.
By implementing the LDT model, a wide range of disaster areas and damage zones will balance the finances, optimize the duration of the removal operations, manage landfill usage, and determine the number of recycled materials generated. Reusing demolition debris, instead of new raw construction materials, is an approach that this study introduced by surveying the optimum transport Path to the new construction sites. Directly and indirectly, the proposed model can support post-disaster management decisions and the challenging task of operating strategic plans for disaster awareness.
In the absence of a comprehensive environmental monitoring system, projected population growth will continue to play an important role in producing greater amounts of solid waste and debris. Energy prices, on the one hand, and increased consumption, on the other hand, prompted researchers and institutions to seek new models and systems for converting waste into sustainable energy (Uche-Soria & Rodríguez-Monroy, 2019; Lederer, Gassner, Kleemann & Fellner, 2020). However, these models and systems would not be suitable for all types of waste, especially those resulting from the demolition of buildings such as old houses, schools, and recreational facilities. Current social, political, economic, and environmental issues are very concerning. These issues and concerns necessitate a strategic focus on catastrophe management at a certain time. With the changing fundamentals of energy prices, which are driven by flow and demand and political events, human interactions will likely continue to remain volatile (Qasim, 2021).
Although solid waste collection sites and sanitary landfills can have many health issues, the existing scenarios from the literature are only a part of an integrated management process of debris and solid waste. The challenging issue of debris management is estimating and determining a flexible approach to reuse and recycle waste, as far as the debris, particularly large material which makes it possible to conduct the disaster response recovery techniques in a short period (Chen, Kwan, Li & Chen, 2012; Chen & Zhan, 2017; Estay-Ossandon & Mena-Nieto, 2018). By integrating the mentioned parameters with the influences of post-disaster and predisaster factors, the LDT can help city emergency planner to identify the optimum path of debris accumulation and other management activities.
When determining an optimal waste treatment method, the focal point arises in determining the best method of isolating debris from the other solid waste. This is one of the fundamental problems which impact any management practice of waste disposal, dump management, site operations, and rehabilitation or recovery process in a city that tested disaster situations (Wei et al., 2021). Calculating the population density of the target city is indeed one of the key topics that can assist the major course of action (Hirayama et al., 2010). Accordingly, the optimal quantity of debris can be assumed through the building types; either they are single or multiple types, as well as notice the other structure types. Depending on how much debris is produced, it will be easier to come up with an adjustment management strategy (Qasim, 2019).
The linear debris model LDT illustrates disaster waste management; especially in regions that do not have enough information and statistical or historical data. This model will help the decision makers to evaluate a set of alternatives under catastrophic conditions, including (1) the impact of the disaster installation of unsure processes, (2) what analysis they need to design and understand patterns of transport processes, and (3) variety and amount of disaster waste in the target city. By including the selected criteria and conditions, the LDT model will facilitate efficient analysis of integrated waste management through reduction of the redundant and unnecessary processes. Moreover, LDT can be developed to cover not only the cities seen disasters but also other cities in pre-disaster situations.
For disposal management during/after a catastrophic period, the damaged area will turn into an operations area of management of disposal facilities and storages step by step. To clean the area of the collected debris, or to recover the destroyed area more efficiently and smoothly, the LDT model is based on the mass transfer process and another management process before, through and after the timeline of a disaster as illustrated in Figure 1.
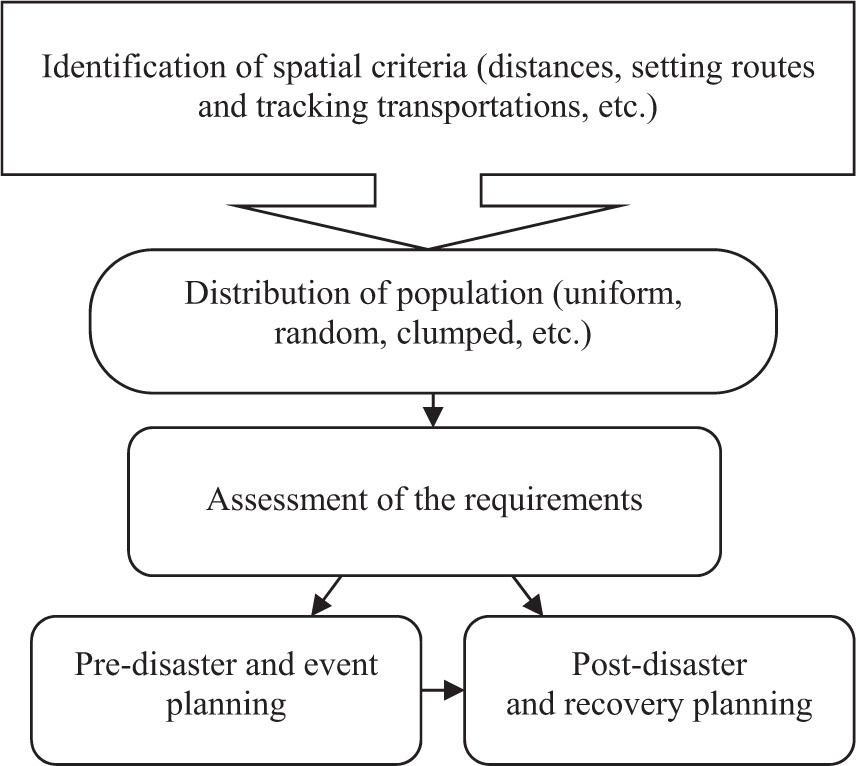
Timeline of pre-disaster and post-disaster debris management
Source: own elaboration.
The following sets of actions are designed to determine several potential scenarios as a flowchart of the debris before the disaster hits. Based on the potential disaster scenario, which will determine the forecast of debris amount, labor and equipment requirements and other management facilities such as debris treatment sites, disposal areas, and sorting and recycling processes will be identified. Any non-recyclable waste with other disaster debris generated in the target city will be transported to another collection site.
The model of LDT is inspired by the dynamic transportation model (DHT model) with consideration of pre- and post-disaster factors, which were developed here by Soichiro et al. (2021) and Chen et al. (2012) respectively. With consideration of transport processes patterns through a variety of disaster waste in a target city, the LDT model aims to allocate debris resources among refuse collection places. Through a network of debris discharge and withdrawal paths or nodes, LDT will be able to allocate those resources reasonably.
As an example of the case study, the LDT network was established and illustrated in Kirkuk in Iraq. All the variables about debris volume in various sectors inside the city are determined during a certain period. The number of functions is expressing the relationships between the given variables and the unknown variables.
The mathematical details of the LDT model were based on quantitative environmental outcome variables:
No one definition of catastrophe waste management applies to all circumstances. As a result, the idea of a disaster has been employed in many different contexts, sometimes as a sign of a failure in urban planning to handle a lot of solid waste in a short length of time outside of ordinary conditions. It is relatively used sometimes as an assessment of human abilities, experiences, development, and cooperation. However, the LDT model evaluates the function of multi various variables to demonstrate a recovery process. By reviewing the relevant literature about Kirkuk, the daily waste generation in 2021 will be around 1,200 t (Mustafa, Mustafa & Mutlag, 2013). So, the concept of disaster and solid waste management has been developed by some researchers, and it's well-known that this concept can be accepted by the community.
However, the total mass of the reusable symbol TMR is developed here to simulate the raw material withdrawn from target areas. Because of the diversity of the materials among urban, suburban, or rural zones, the problem of withdrawing raw materials could become more complex and difficult. To simplify the value of TMR, we can calculate this term according to the per capita percentage of construction materials as shown in Eqs (2) and (3).
As the majority of the houses in Kirkuk are a composite type, the coefficient C was calculated at around 1.8 t·capita−1·m−2. The average housing size per person is HS [m3] occupied by a person within a family which ranges between 54 and 75 m3 of total residential space.
To indicate the effective size and volume of the debris of each node, at this stage of research, there is a need to highlight characteristic debris composition in various constructions and urban activities. The quantitative portion of each material in the temporary storage sites was set according to Eq. (4):
Weight-based capacity allocation of solid waste collection
| Type of waste | Composition | Ratio [%] | Specific gravity (SG) [t·m−3] |
|---|---|---|---|
| Excavation soil | soil, rock, clay | 7 | 0.64 |
| Roadwork wastes | broken asphalt, paving stone, concrete | 13 | 1.89 |
| Demolition wastes | concrete, iron, ceramics, brick | 69 | 2.23 |
| Complex wastes | concrete, sand, gravel, gypsum, wood, PVC, glass, metal, plastic, carton | 11 | 5.09 |
Source: own elaboration.
Production and share rate of debris
| Zone | C | Family | Average capita per family | House or apartment number (HoA) | Debris transport path (DTP) | ρ | Housing size per person (HS) | Total mass (TMR) | Combustible wastes (ComW) |
|---|---|---|---|---|---|---|---|---|---|
| 1 | 1.8 | 74 | 6 | 64 | 900 | 2 | 60 | 95 | 1 870 |
| 2 | 1.8 | 48 | 5 | 42 | 600 | 1 | 65 | 79 | 68 |
| 3 | 1.8 | 50 | 5 | 40 | 580 | 1 | 68 | 84 | 270 |
| 4 | 1.8 | 45 | 5 | 38 | 500 | 1 | 70 | 86 | 262 |
Source: own elaboration.
All these four temporary storages were connected to secondary temporary storages according to local conditions and solid waste type. The final disposal site will be the last collection place of all components of the secondary stations. The four selected zones are illustrated in Figure 2. These zones represent the center, east, north, and west of Kirkuk, namely, Zone 1, Zone 2, Zone 3, and Zone 4 respectively.
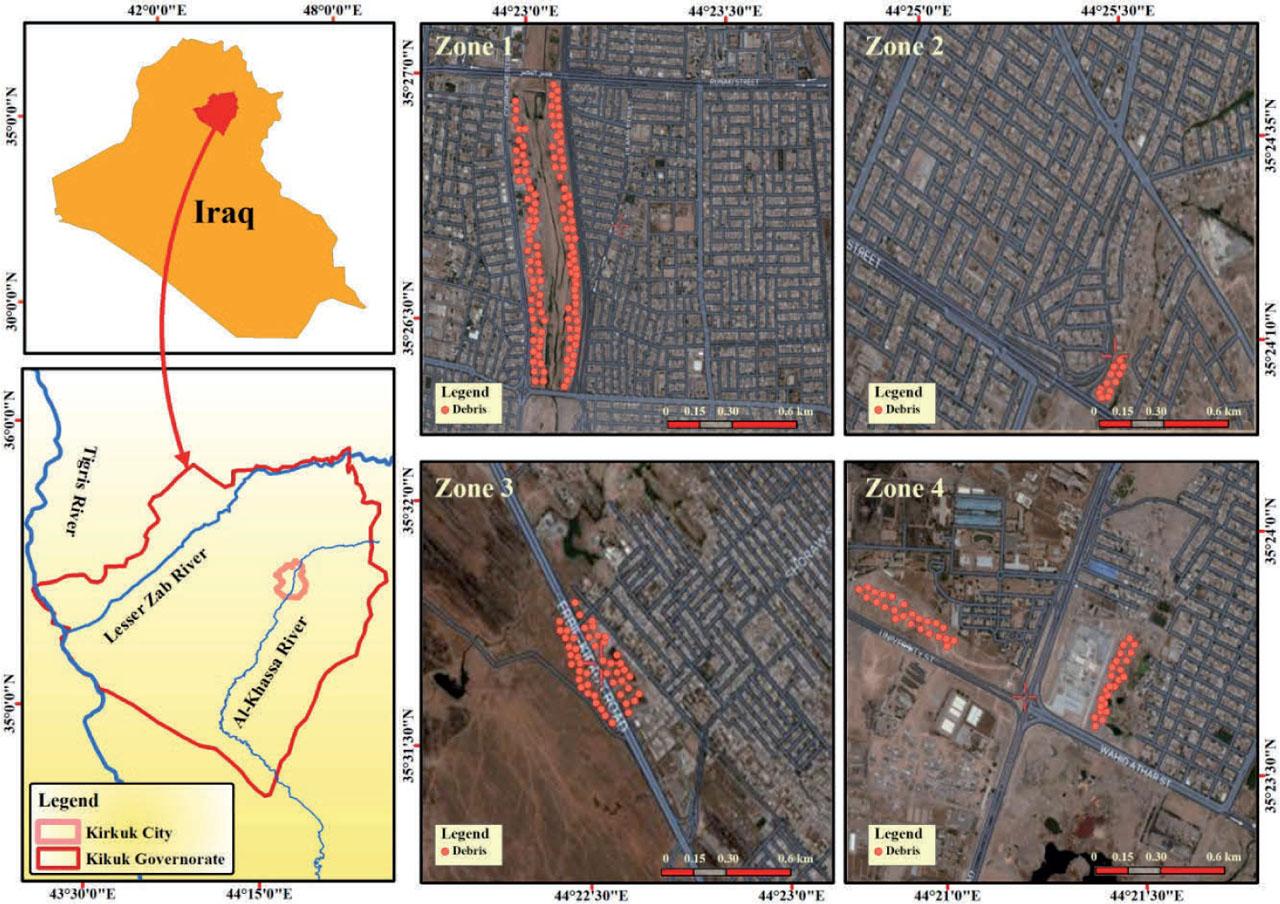
Primary debris disposal zones in Kirkuk
Source: own elaboration.
The LDT model contains 35 debris discharge (Dn) and 17 debris withdrawal (Wn) paths for the four target zones in Kirkuk. To learn more about how the paths are distributed geographically, the typical allocations of debris discharge and withdrawal paths are illustrated schematically in Figure 3.
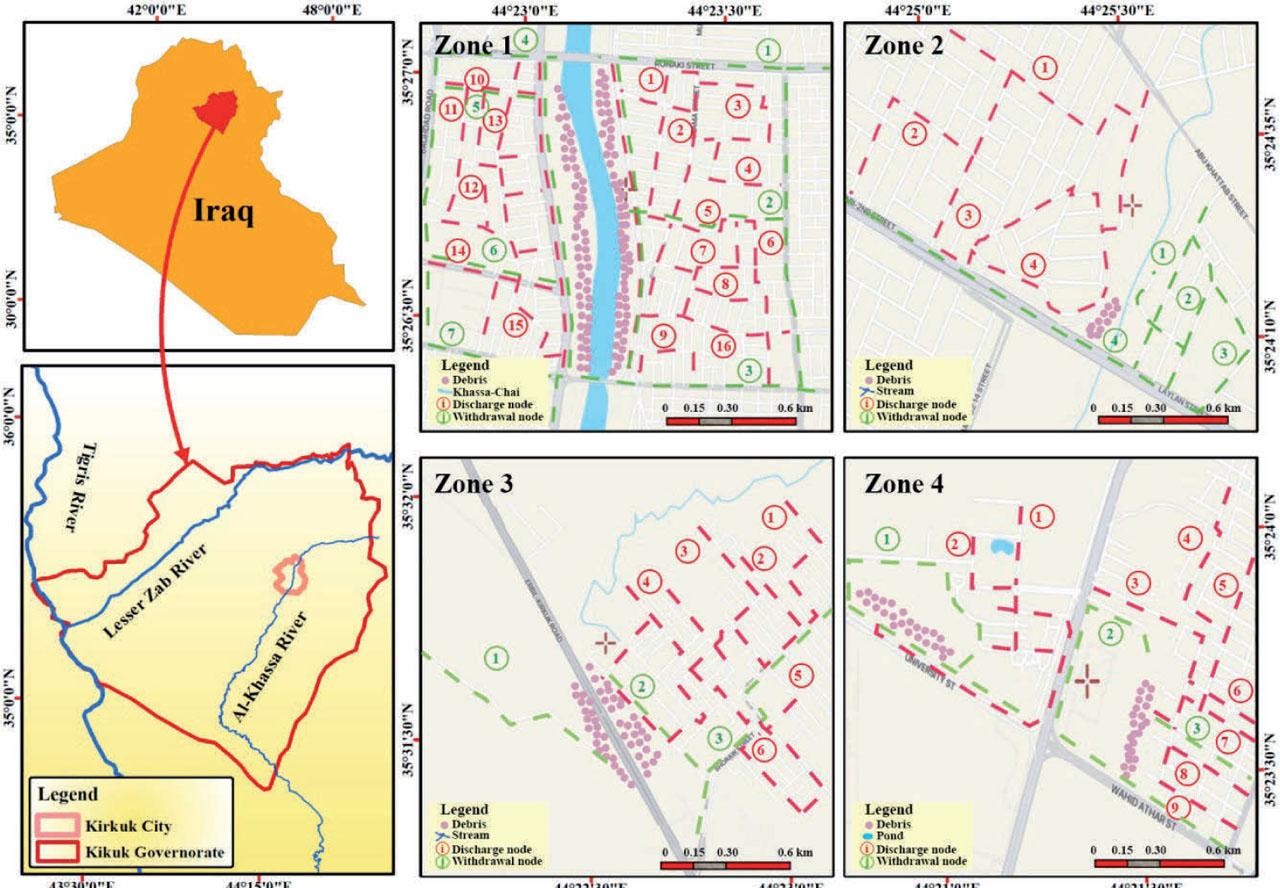
Network structure of the linear dynamic transportation model (LDT) in Kirkuk
Source: own elaboration.
To make the outcomes of LDT more reliable, the model should be calibrated and verified to a satisfactory accuracy. The model was developed by estimating several parameters as model inputs. So, the model details are significantly improved in the actual places designated for throwing debris.
The LDT model examines the relationships between projected discharge and withdrawal paths during two time periods of around four months each period. The rainy season lasts from December to April, with the dry season beginning in May and ending in November. Because of the extent of the solid waste storage location, the model can simulate the quantity of debris for the given periods, especially during the summer season.
Considering various types of housing and socioeconomic categories that live in the city, waste disposal will depend on the richness factors of the residents and the improvement of their daily income, in addition to the development programs of the city. These factors motivate people to demolish their old buildings and rebuild new ones. However, as a result of their poverty, the people who live in the surrounding zones are sometimes forced to reuse the collected debris as raw construction material in their homes. At times, debris removal and infrastructure reconstruction may depend on increased awareness of the environment by residents and decision-makers.
It is clear, the dominant portion of debris reuse effectiveness sensibly depends on the suitable collection strategy. While the efficiency of reusing the debris in the mixing zone, as when mixing with solid household waste, will be minimal. Therefore, early in the collecting process, combining municipal solid wastes with debris must be avoided. Consequently, to find out the accurate figure of how debris compositions are affecting the LDT model at each city, we need to analyze this in more detail.
Within the mentioned zones, the Statistical Package for Social Science (SPSS 22.0) was used to analyze the differences between pure debris sites and mixed debris. Thus, the indication of the total amount of debris, across different sections of other cities and zones, could hypothetically be equivalent to D in the LDT model.
The research was conducted in Kirkuk, Iraq's northeastern city. The Kirkuk holds the majority of the Kirkuk governorate's population as well as its government offices. It lies within latitude 35°21.010′–35°35.103′ N and longitude 44°18.107′– –44°39.045′ E (Figs 2 and 3). The governorate of Kirkuk is divided into sub-administrative divisions known as cities or districts called Daquq, Dibis, Hawija, and Kirkuk (Qasim, 2021). Most of these cities and districts have witnessed a rise in terrorist attacks such as ISIS after 2014. The war against these terrorist groups left behind a large number of destroyed buildings and a large amount of debris.
The study area is characterized by complex topography, where small plateau ranges are the general landscape of the area. The seasonal river (Khassa-Chai) divides Kirkuk into two main parts. Despite Khassa-Chai playing a significant function for the residents of Kirkuk, the river coast became a free landfill for garbage and solid waste (Qasim, 2019). Both the local Kirkuk authority and a sizable number of people are finding it difficult to deal with this unregulated waste disposal. It is hard to isolate debris from other solid waste in the mixing zones. Most solid waste dump sites are near the debris disposal place. Furthermore, although reusing the debris as raw building materials for construction provides an excellent opportunity for residents to earn some extra money, a considerable portion of the debris ends up as useless solid waste. As a general case in Iraq, the lack of new and modern types of ways in Kirkuk is another reason for the accumulation of debris in certain places in the mentioned zones. So, in terms of disaster conditions, either due to natural disaster situations or due to terrorist attacks, Kirkuk needs to increase its efforts in debris and solid management. Thus, LDT will assist the decision-makers in Kirkuk to determine a suitable management technique as a key to the rehabilitation process during and after a disaster.
An active management approach necessitates an appropriate model to handle waste generated by disasters in a way that is both safe and environmentally sustainable. The capacity of sustainable development involves not only using proper disposal systems but also using various dynamic models. However, with ongoing political conflict and wars in Ukraine, Afghanistan, Syria, etc., in addition to the asymmetries resulting from population expansion, industrial development, and infrastructure, consequences of economic competition are highlighting the importance of sustainable debris management. To promote sustainable growth and development, transport services can create a reliable framework for human resources management and program activities.
The LDT model was applied successfully to four sites in Iraq, as shown by the figures and tables. The results obtained systematically demonstrate the model's flexibility in various circumstances and environments. However, there is a need to develop this model by increasing its application to include other unstable countries or regions, such as recent earthquake zones in Turkey and Syria, as well as war-torn countries like Ukraine, Syria, Libya, Afghanistan, etc. Thus, the proposed model presents a new research method that can be developed through prospective and new studies.
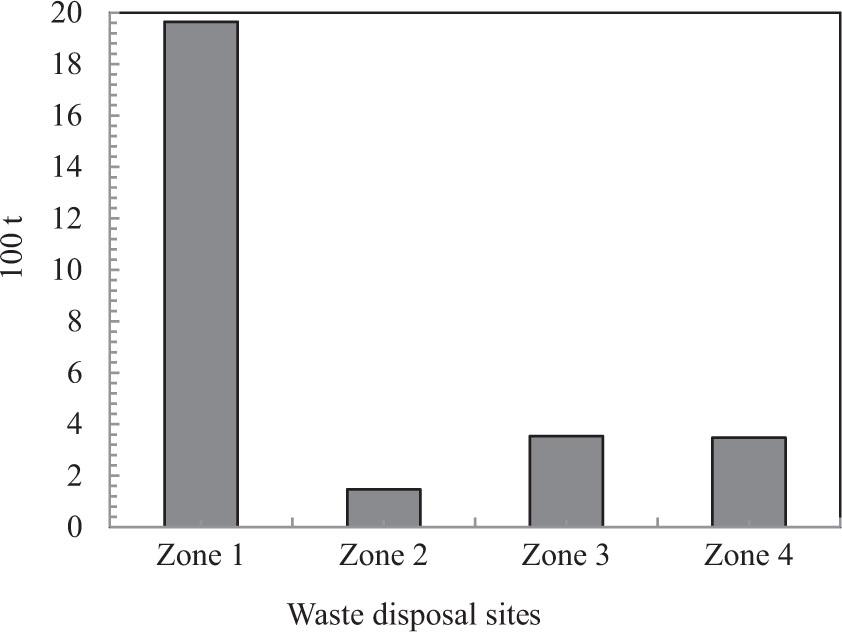
In the simulation of the LDT model using the SPSS program, the observed parameters listed in this model were specified for four zones in Kirkuk. The findings show that Zone 2, Zone 3, and Zone 4 are appointed as critical lack sites for reusable materials as shown in Figure 4. Currently, due to the lack of suitable recycling facilities in the city, the large amount of waste in these zones is considered undesirable. While Zone 1 was noted as a good area for debris disposal based on the pure debris volume. Although the critical issues of collecting and/or disposing of the debris near the seasonal river Khassa-Chai, this zone offers unpolluted sites for debris.
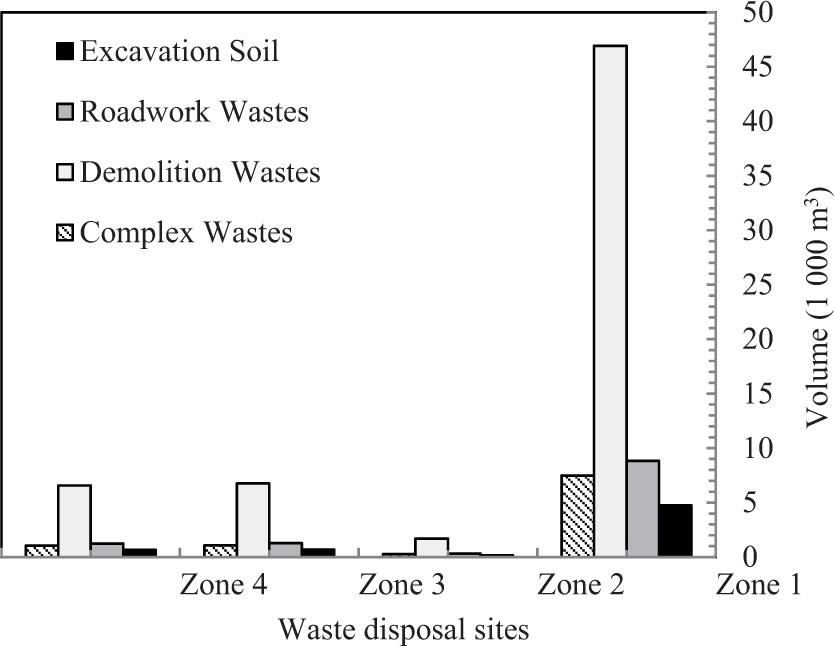
Volumetric analysis of the debris
Source: own elaboration.
After calculation of the proportions, the debris withdrawals ratio from Zone 2 was greater than other zones as shown in Table 3. Although the collected quantity of debris in Zone 1 is much greater than in Zone 2, the inefficiency of the road, as well as the truck path in Zone 1, led to a decrease in the withdrawal ratio there (Figs 5 and 6). On the other hand, the urban development process that took place in Zone 2 paid regard to the road type and networks.

Total discharge of debris
Source: own elaboration.
Total withdrawal of debris
Source: own elaboration.
Withdrawal ratio of debris
| Zone | Excavation soil [t] | Roadwork wastes [t] | Demolition wastes [t] | Complex wastes [t] | Total discharge [t] | Total withdrawal [t] | Withdrawal ratio [%] |
|---|---|---|---|---|---|---|---|
| 1 | 3 189 | 5 923 | 31 436 | 5 012 | 45 560 | 1 965 | 4.31 |
| 2 | 115 | 214 | 1 137 | 182 | 1 648 | 146 | 8.86 |
| 3 | 460 | 854 | 4 531 | 722 | 6 566 | 354 | 5.39 |
| 4 | 447 | 829 | 4 401 | 701 | 6 378 | 348 | 5.46 |
Source: own elaboration.
The outcomes of the LDT show that; the transportation path of debris trucks is responsible for promoting sustainable and reliable management of debris. However, the importance of debris management does not receive the proper attention from the decision-makers yet. Thus, increasing awareness of both debris discharge and withdrawal is another significant benefit of the LDT model.
The results demonstrate that, in this application, the proposed model has several important advantages; as: LDT model was used within a controlled environment in terms of the limited variables that affect the financial status of individuals; It helped in determining the required cause and effect relationships; It helped in providing more reliable results within the target area.
On the other hand, as with all new models, certain defects have emerged during the application of the model, including; the total size of collected samples was small in comparison to the large size of the debris; Concerning the reuse of building materials, the dependence on participants' awareness and compliance was an obstacle to the increasing application of LDT model; Apart from these long-term experiences, it is difficult to maintain contact with participants; In addition, the sorting and transportation process in some regions can be costly.
Sustainable debris management by using the LDT model presents a rock-solid basis upon which the unexpected amount of solid waste can be effectively estimated and treated. The presence of an adequate truck path encourages the locals to reuse the debris for earning more money. As well as it provides additional assistance to implement sustainable goals during infrastructure development or disaster risk management.
The results reflect the relationship between the design of truck paths along the buildings and the ability to remove debris locally. Because of good urban design that has taken place in Zone 2, the quantity of debris reused in Zone 2 was more than in Zone 1. Although the amount of debris in Zone 1 was much greater than in Zone 2, the existence of a proper path that trucks follow in transporting the debris encouraged the locals to reuse the debris. At Zone 2, the withdrawal paths were the same number as the discharge paths. While the discharge path numbers, in the other zones were more than the withdrawal paths. So, this subject helps to conclude a kind of balance between the total amount of debris discharged and the amount withdrawn in each zone. Thus, the results are seen in the rise of debris withdrawals in Zone 1 for re-use by its individuals. Despite satisfactory results, some adverse side effects may be caused by the mixture of household waste and debris. This was one of the complex challenges associated with the safe reuse of debris.