

FIGURE 1.

FIGURE 2.
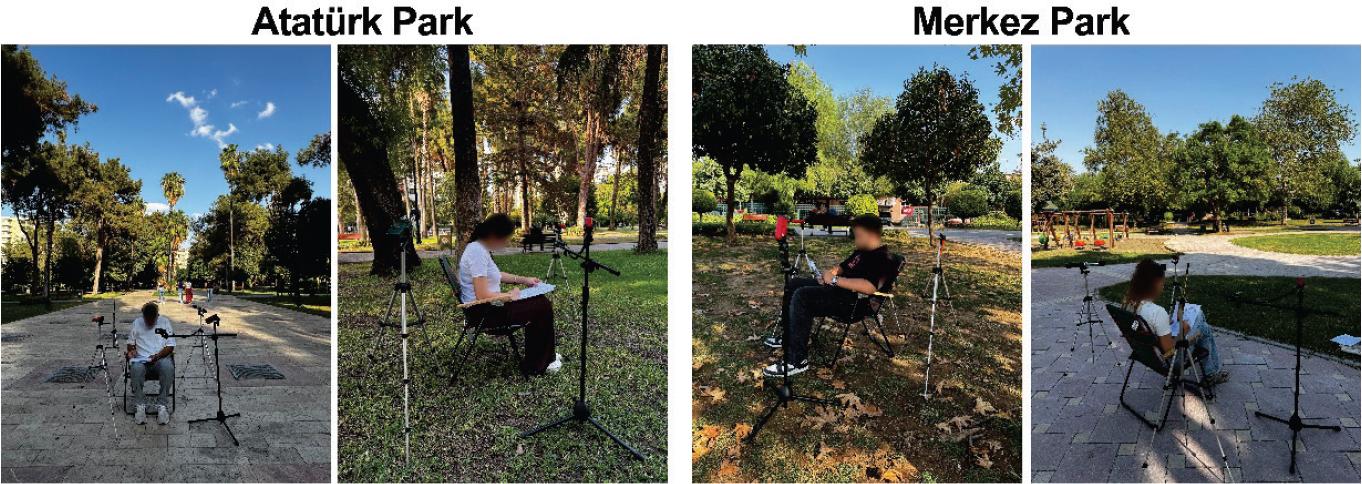
FIGURE 3.
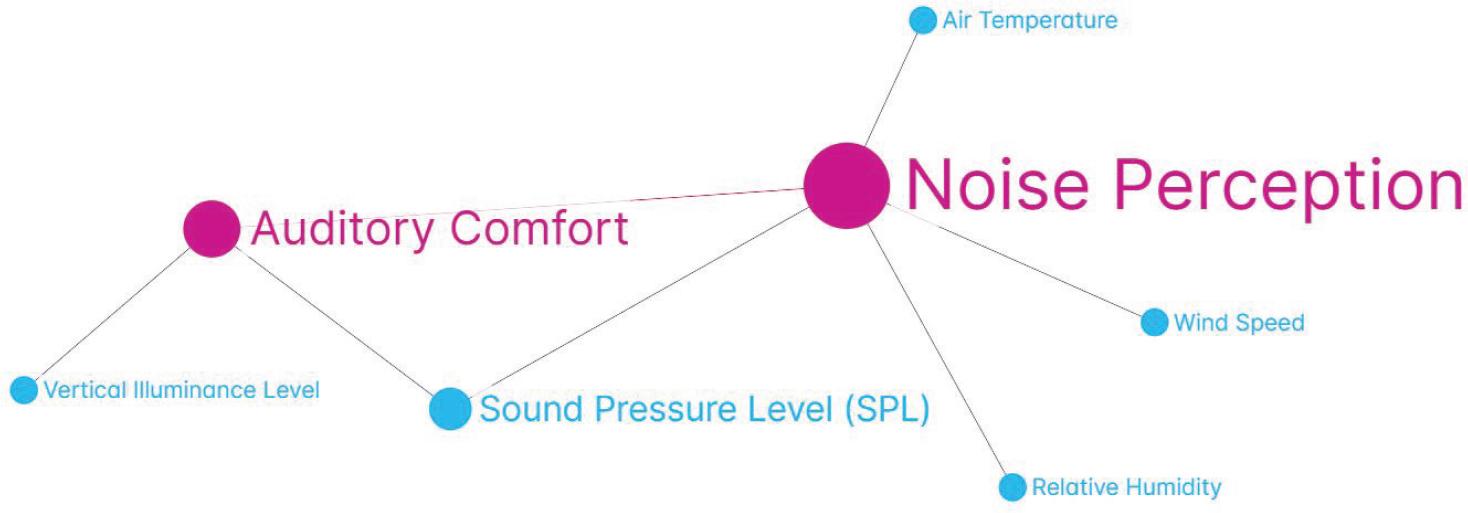
FIGURE 4.
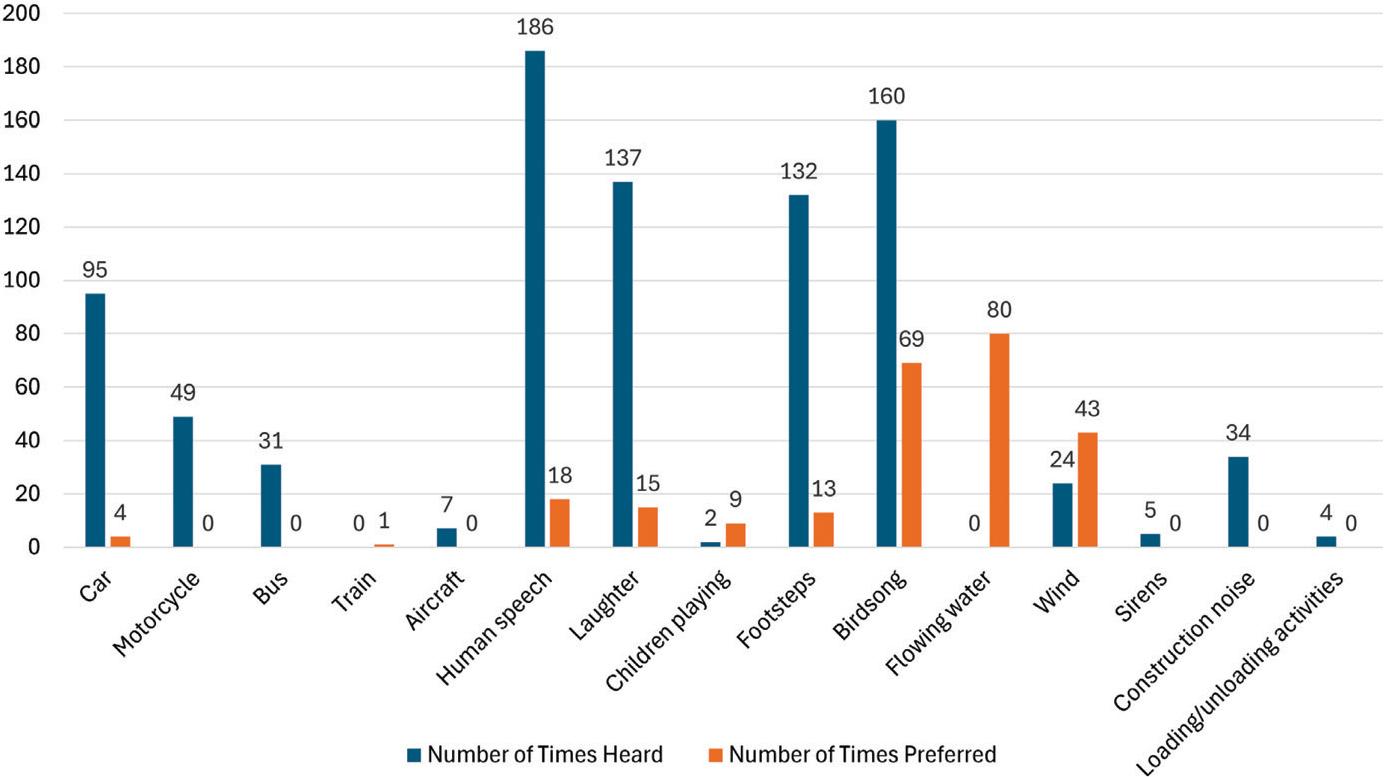
FIGURE 5.
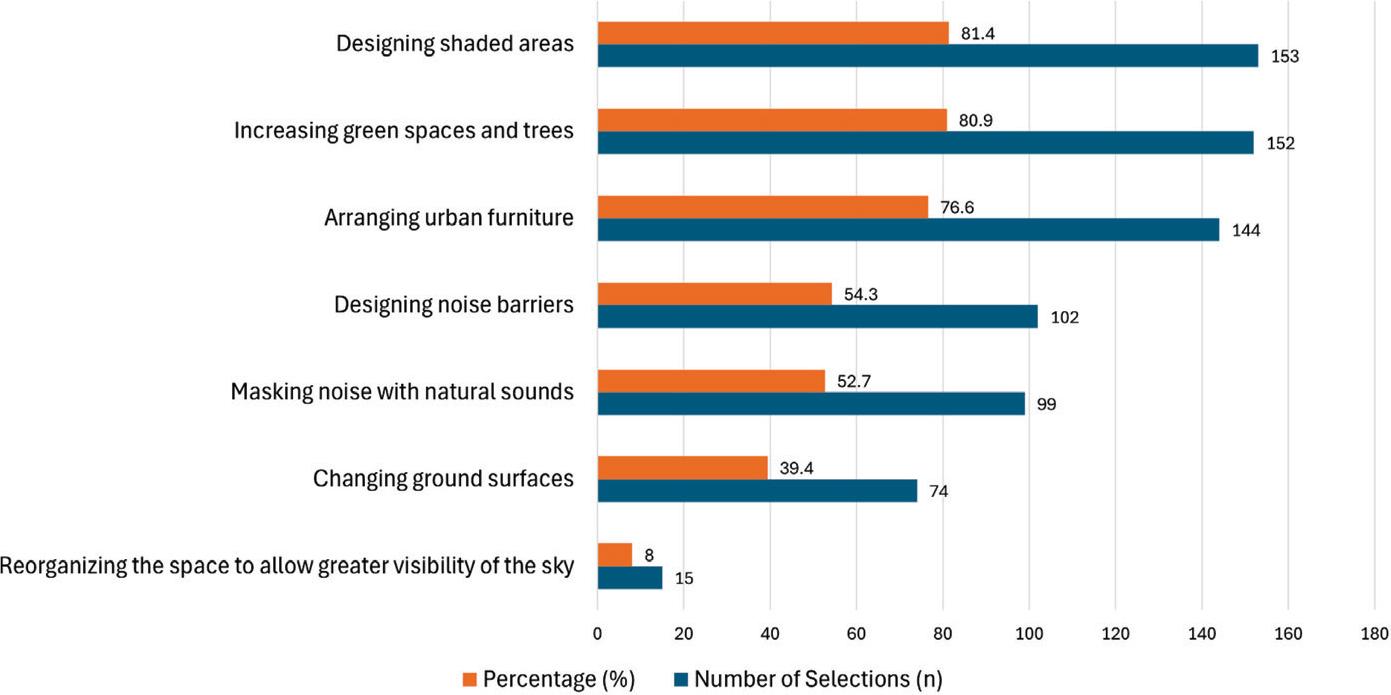
Significant predictors from the multiple linear regression analysis
| Variable | Coefficient β | Significance (p) | Interpretation |
|---|---|---|---|
| Sound pressure level | –0.103 | 0.000 | strongest and most significant negative predictor: as sound levels increase, auditory comfort decreases |
| Vertical illuminance | –0.020 | 0.040 | statistically significant negative predictor: higher vertical illuminance reduces auditory comfort |
Relationships between auditory comfort and other variables
| Variable | Pearson’s r | Significance (P) | Interpretation |
|---|---|---|---|
| Noise perception | 0.772 | 0.000 | positive and significant: as the environment is perceived quieter, comfort increases |
| Air temperature | 0.070 | 0.341 | weak and non-significant |
| Relative humidity | –0.119 | 0.103 | weak and non-significant |
| Wind speed | –0.092 | 0.207 | weak and non-significant |
| Mean radiant temperature | 0.033 | 0.657 | negligible, non-significant |
| Sound pressure level | –0.520 | 0.000 | negative and significant, higher sound levels reduce comfort |
| Horizontal illuminance | –0.106 | 0.148 | weak and non-significant |
| Vertical illuminance | –0.039 | 0.591 | negligible, non-significant |
Relationships between noise perception and other variables
| Variable | Pearson’s r | Significance (p) | Interpretation |
|---|---|---|---|
| Auditory comfort | 0.772 | 0.000 | strong positive correlation: as noise decreases, comfort increases |
| Air temperature | 0.155 | 0.034 | significant positive relationship |
| Relative humidity | –0.202 | 0.005 | significant negative relationship |
| Wind speed | –0.185 | 0.011 | significant negative relationship |
| Mean radiant temperature | 0.066 | 0.372 | no relationship |
| Sound pressure level | –0.687 | 0.000 | strong negative correlation: higher levels reduce quietness perception |
| Horizontal illuminance | –0.117 | 0.109 | no relationship |
| Vertical illuminance | 0.008 | 0.914 | no relationship |