

Environmental comfort in open urban spaces is of great significance for urban quality of life and human health. Noise, considered the most serious environmental problem after air pollution, can negatively affect user comfort in outdoor areas (European Environment Agency [EEA], 2019). In this context, auditory comfort is an important dimension of comfort, defined as the perception of a sound environment in a space as non-disturbing and pleasant. Traditionally, auditory comfort evaluations have mostly relied on quantitative noise metrics such as sound pressure level (Vardaxis & Bard, 2018; Torresin et al., 2019). However, in recent years, the “soundscape” approach has emphasized that not only the numerical level of the acoustic environment but also the contextual perception of individuals is important (Zhao et al., 2018; Mascolo et al., 2020; Jo & Jeon, 2021; Mancini et al., 2021). Previous research indicates that higher noise levels in an environment do not automatically lead to poorer perceived acoustic quality. This outcome highlights that auditory comfort depends on more than just sound pressure level; it is also shaped by qualitative and contextual attributes – such as the spectral composition of sounds, their origin, suitability to the setting, and their interaction with other environmental factors (Cureau et al., 2022; Yang et al., 2024). Human perception is inherently multisensory, meaning that people respond to their surroundings through the combined action of several senses. Consequently, outdoor comfort cannot be interpreted through a single physical stimulus alone. The perception of auditory comfort is closely intertwined with visual and thermal aspects of the environment (Yang & Moon, 2019; Nitidara et al., 2022; Zeng et al., 2024).
Growing evidence in the literature further supports that distinct comfort domains influence one another. A doctoral study, for example, emphasized that thermal, acoustic, and visual comfort parameters are interrelated, although the specific direction or strength of these relationships remains uncertain (Şimşek, 2024). On university campuses, enhancing visual comfort in outdoor settings has been observed to simultaneously improve perceptions of thermal comfort (Lam et al., 2020). Similarly, research in dense urban environments reported that greater thermal discomfort tends to amplify sensitivity to noise, thereby reducing overall acoustic comfort (Lau & Choi, 2021). Climatic characteristics, such as ambient temperature and relative humidity, also play a key role in how individuals perceive both the acoustic landscape and the general outdoor experience (D’Alessandro et al., 2018).
Investigations focusing on the visual–auditory relationship have revealed that visual qualities substantially affect how people judge the acoustic environment of a space. The integration of natural components, in particular, appears to foster positive auditory evaluations. Studies conducted in urban parks confirmed that areas with greenery or water features promote both visual and auditory satisfaction among visitors (Cohen et al., 2014). Conversely, visually monotonous or poorly maintained areas – those lacking natural elements – tend to make existing noise sources feel more intrusive and unpleasant. A study around a university campus similarly showed that as the proportion of natural elements (green areas, water features, etc.) increased, participants’ perceptions of acoustic comfort and overall environmental satisfaction also improved (Cureau et al., 2022). Accordingly, higher visual environmental quality can soften the perception of noise and thereby improve auditory comfort.
Evidence on light–sound interactions remains mixed. Early work suggested that very bright conditions may slightly increase noise annoyance relative to typical illumination (Shigehisa & Gunn, 1978), whereas other studies reported negligible effects of illuminance changes on annoyance judgments (Yang & Moon, 2018). At the same time, improving perceived visual quality has been argued to indirectly support acoustic appraisal; for instance, enhanced lighting quality was associated with reduced annoyance in indoor settings (Ma & Nie, 2014). Overall, the influence of illuminance on auditory outcomes appears subtle and context dependent.
The connection between thermal and auditory comfort has also gained growing attention in recent years. Scholars have examined how air temperature and other climatic variables affect individuals’ reactions to noise, and empirical work supports the existence of such cross-modal effects. In a field investigation conducted in a university campus in China, Chen et al. (2022) reported that participants exposed to cold winter temperatures experienced a marked decline in auditory comfort, particularly when unpleasant sounds were present. Interestingly, the introduction of pleasant background sounds – such as soft music or birdsong – counteracted this negative perception, helping participants feel more thermally comfortable even under cool conditions. By contrast, in areas dominated by mechanical or crowd noise, both thermal and auditory comfort ratings deteriorated notably (Chen et al., 2022).
The literature collectively underlines that outdoor comfort is inherently multisensory. Because people interpret environmental stimuli holistically, assessing comfort based solely on a single physical factor offers an incomplete understanding. For this reason, studies increasingly adopt multidimensional frameworks that integrate thermal, visual, and acoustic parameters (Kousis & Pisello, 2020). In public open spaces such as parks and plazas, such integrative research has revealed that comfort ratings across different sensory domains are mutually dependent. For instance, a study by Cureau et al. (2022) found that subjective survey responses provided a more accurate prediction of overall comfort than physical measurements alone, demonstrating the importance of multisensory evaluation (Cureau et al., 2022). Consequently, outdoor environmental design should move beyond isolated interventions – such as noise reduction or shading – and instead aim for strategies that comprehensively address user experience.
Within this context, the present study seeks to explore auditory comfort in outdoor environments by concurrently considering visual and thermal influences. Previous research indicates that auditory comfort is affected not only by sound levels but also by the visual and climatic qualities of the setting. However, the specific mechanisms underlying these multisensory relationships in open public spaces remain insufficiently defined. To fill this gap, the current study employs simultaneous survey and environmental measurements conducted during the autumn season in two major urban parks in Adana, Turkey (Merkez Park and Atatürk Park), which represent the Mediterranean climate and host dense public use. By integrating subjective and objective data, this research aims to identify the key environmental parameters that shape auditory comfort in outdoor settings. The findings underscore that urban noise management and environmental design must account not only for acoustic variables but also for visual configurations and microclimatic enhancements to foster holistic user comfort.
The fieldwork took place in two large urban parks – Merkez Park (36°59′44″ N, 35°20′06″ E) and Atatürk Park (36°59′49″ N, 35°19′24″ E) – situated in the city center of Adana, a city characterized by a Mediterranean climate, marked by long hot summers, mild winters, and high annual sunshine duration (Fig. 1). Both parks are important public spaces that function as hubs for social interaction and recreation, attracting residents and visitors throughout the day.

Field studies conducted at Merkez Park and Atatürk Park
Source: own work.
Data collection was conducted in October, representing typical autumn conditions. Environmental measurements and on-site surveys were administered at three different times of day: morning (09:00–10:00), midday (12:00–13:00), and afternoon (16:00–17:00). Within each park, four distinct observation points were chosen to reflect variations in surface materials (grass, soil, and pavement), spatial orientation (north and south), and shading conditions (open, tree-shaded, and semi-shaded areas). This sampling strategy ensured that the dataset captured the micro-environmental diversity present within the parks, enhancing the representativeness of the results. This study was conducted in accordance with institutional ethical guidelines. Ethical approval was obtained from the relevant ethics committee prior to data collection. All participants were informed about the purpose and scope of the study, and written informed consent was obtained through a voluntary participation form.
In total, 202 volunteers of different ages and genders participated in the study. While the participants completed a concise questionnaire describing their immediate perceptions of the surrounding physical environment, simultaneous environmental measurements were taken at the corresponding observation sites.
Two main categories of data were collected in the present research. The first consisted of subjective responses obtained through questionnaires that recorded participants’ perceptual evaluations, while the second comprised objective environmental data gathered from physical measurements conducted at the same times and locations as the surveys.
The questionnaire was designed in a structured format with four main sections:
Demographic information. This part included basic socio-demographic characteristics such as participants’ age, gender, and duration of residence in the region.
Immediate auditory perception and comfort evaluation. Participants were invited to assess the sound environment through two key questions: their perception of the noise level and their degree of auditory comfort. Noise perception was rated on a seven-point Likert scale ranging from “very noisy” (-3) to “very quiet” (+3), whereas auditory comfort was evaluated on an equivalent scale from “very uncomfortable” (-3) to “very comfortable” (+3).
Perception and preference regarding the sound environment. Respondents identified the types of sounds present in their surroundings – such as traffic, human activity, natural sources, or others – and indicated which sound categories they preferred to hear.
Strategies for improving auditory comfort. In this final section, participants selected from a list of potential interventions aimed at enhancing auditory comfort, including the addition of vegetation, installation of noise barriers, or introduction of pleasant natural sound sources.
At the same time as the surveys, seven environmental parameters were measured at each participant’s location (Fig. 2): air temperature [°C], relative humidity [%], wind speed [m·s−1], mean radiant temperature [°C], sound pressure level [dBA], horizontal illuminance [klx], and vertical illuminance [klx].
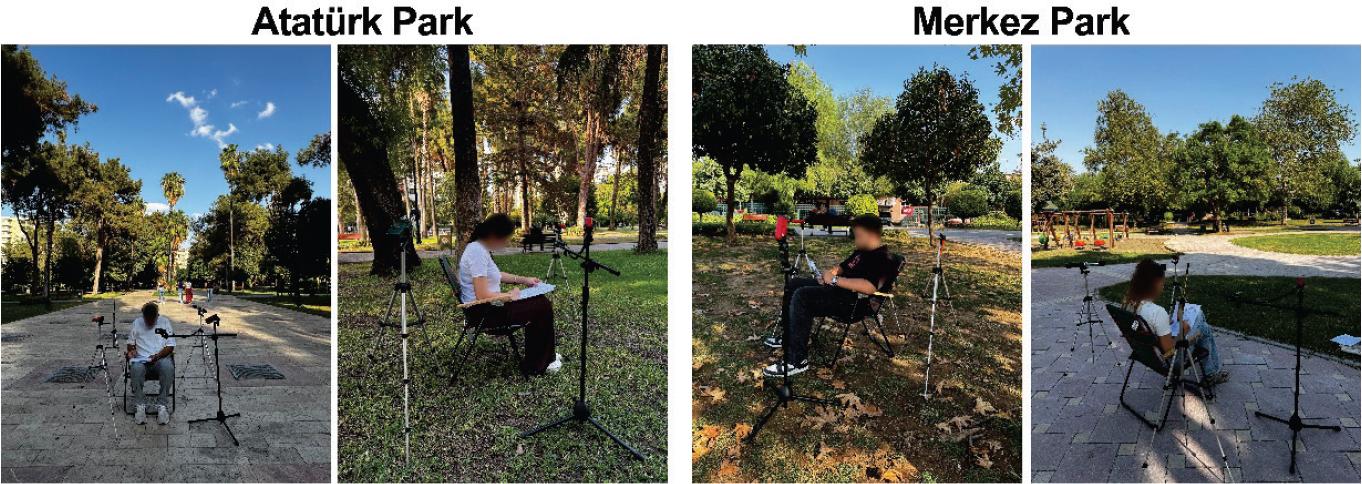
Measurement and survey studies
Source: own work.
These measurements were obtained using portable monitoring devices. Each participant’s subjective evaluations were directly paired with the corresponding environmental data collected at that moment, yielding an integrated dataset that allowed for detailed comparative analysis.
Physical environmental data were collected on site during each survey session to correspond precisely with participants’ subjective evaluations. The instruments and parameters used in the measurements are summarized below:
–Air temperature [°C], relative humidity [%], and mean radiant temperature [°C] were obtained with a portable Extech HT200 instrument, which provided real-time readings of microclimatic conditions. The device has an accuracy of approximately ±1°C for air temperature and ±3% for relative humidity.
–Wind speed [m·s−1] was monitored using a wireless anemometer specifically designed for field assessment of local air movement. The instrument is suitable for low air velocity measurements and has an accuracy of approximately ±0.1 m·s−1.
–Sound pressure level [dBA] measurements were performed with a sound level meter compliant with IEC 61672 standards (International Electrotechnical Commission [IEC], 2013) and operating under the A-weighting curve. The device operates within a measurement range of approximately 30–130 dBA and uses a fast response setting to capture short-term fluctuations in the acoustic environment.
–Horizontal and vertical illuminance [klx] were recorded with a portable luxmeter meeting ISO/CIE 19476 requirements (International Organization for Standardization & International Commission on Illumination [ISO & CIE], 2014). Measurements were taken at users’ seating height, parallel to the ground for horizontal illuminance, and perpendicular to the line of sight for vertical illuminance. The luxmeter has an accuracy of approximately ±3% and is suitable for outdoor daylight measurements.
All measurements were conducted at approximately 1.1 m above ground level, representing the average seated human position in outdoor environments. All instruments were carefully calibrated before the field campaign. Measurements were conducted simultaneously with the questionnaire surveys, ensuring that environmental data and perceptual responses were precisely synchronized and directly comparable within the integrated dataset.
The analytical procedure was carried out in three main stages using IBM SPSS Statistics 25. At the first stage, bivariate associations among participants’ evaluations of auditory comfort, perceived noise levels, and the measured physical parameters were explored using Pearson’s correlation analysis. This approach was selected to identify both the direction and magnitude of linear relationships among variables. Because all variables were measured on continuous scales and met the assumptions required for parametric testing, Pearson’s r was considered the most appropriate technique. Accordingly, correlations were calculated between auditory comfort and noise perception scores and the environmental indicators, including air temperature, relative humidity, wind speed, mean radiant temperature, sound pressure level, and both horizontal and vertical illuminance.
The second stage involved assessing whether these relationships remained significant when considered together. To this end, a multiple linear regression analysis was employed, enabling the simultaneous evaluation of several predictors on a single dependent variable. Beyond examining individual influences, this method provides insight into the combined and potentially suppressive or mediating effects among predictors (Lu et al., 2025; Muniz & MacKinnon, 2025). For this reason, multiple regression was adopted as a rigorous tool to elucidate the multifactorial nature of environmental comfort phenomena.
Finally, the third stage focused on aspects of perception extending beyond measured physical factors. Participants’ qualitative responses regarding perceived sound types, preferences, and their proposed strategies for improving auditory comfort were systematically analyzed. They identified prevalent sound categories in their surroundings – such as human activity, natural elements, and traffic noise – and expressed their expectations concerning an ideal acoustic environment.
Pearson’s correlation analysis results revealed a strong and statistically significant positive relationship between auditory comfort and participants’ perceived quietness (r = 0.772, p < 0.001). In other words, the quieter an environment was perceived to be, the higher the reported level of auditory comfort. Conversely, sound pressure level exhibited a significant negative correlation with auditory comfort (r = –0.520, p < 0.001), indicating that rising noise levels were consistently associated with reduced comfort ratings.
Regarding the other physical parameter (air temperature, relative humidity, wind speed, mean radiant temperature, and both horizontal and vertical illuminance) no statistically significant relationships with auditory comfort were observed (p > 0.05). These outcomes suggest that within the scope of this study, participants’ auditory comfort was primarily influenced by noise-related factors rather than by thermal or visual environmental variables. Details of these bivariate relationships are summarized in Table 1.
Relationships between auditory comfort and other variables
| Variable | Pearson’s r | Significance (P) | Interpretation |
|---|---|---|---|
| Noise perception | 0.772 | 0.000 | positive and significant: as the environment is perceived quieter, comfort increases |
| Air temperature | 0.070 | 0.341 | weak and non-significant |
| Relative humidity | –0.119 | 0.103 | weak and non-significant |
| Wind speed | –0.092 | 0.207 | weak and non-significant |
| Mean radiant temperature | 0.033 | 0.657 | negligible, non-significant |
| Sound pressure level | –0.520 | 0.000 | negative and significant, higher sound levels reduce comfort |
| Horizontal illuminance | –0.106 | 0.148 | weak and non-significant |
| Vertical illuminance | –0.039 | 0.591 | negligible, non-significant |
Source: own work.
For participants’ subjective noise perception, Pearson’s analyses revealed a strong negative correlation with sound pressure level (r = –0.687, p < 0.001). This indicates that higher measured sound levels led to the environment being perceived as noisier. Another noteworthy finding is that participants’ noise perception was not only associated with auditory sources but also significantly related to other environmental stimuli. Specifically, significant correlations were identified with air temperature (r = 0.155, p = 0.034), relative humidity (r = –0.202, p = 0.005), and wind speed (r = –0.185, p = 0.011). These findings suggest that auditory perception can be influenced not only by acoustic properties of the environment but also by thermal comfort parameters through multisensory pathways. An increase in temperature tended to be associated with perceiving the environment as quieter, while higher humidity and wind speed negatively influenced quietness perception. However, mean radiant temperature, horizontal illuminance, and vertical illuminance did not show significant correlations with noise perception (p > 0.05). The details of these bivariate relationships are presented in Table 2.
Relationships between noise perception and other variables
| Variable | Pearson’s r | Significance (p) | Interpretation |
|---|---|---|---|
| Auditory comfort | 0.772 | 0.000 | strong positive correlation: as noise decreases, comfort increases |
| Air temperature | 0.155 | 0.034 | significant positive relationship |
| Relative humidity | –0.202 | 0.005 | significant negative relationship |
| Wind speed | –0.185 | 0.011 | significant negative relationship |
| Mean radiant temperature | 0.066 | 0.372 | no relationship |
| Sound pressure level | –0.687 | 0.000 | strong negative correlation: higher levels reduce quietness perception |
| Horizontal illuminance | –0.117 | 0.109 | no relationship |
| Vertical illuminance | 0.008 | 0.914 | no relationship |
Source: own work.
To examine the extent to which environmental variables explained variations in auditory comfort, a multiple linear regression analysis was performed. In this model, participants’ subjective auditory comfort ratings served as the dependent variable, while air temperature, relative humidity, wind speed, mean radiant temperature, sound pressure level, horizontal illuminance, and vertical illuminance were entered as predictors (Table 3).
Significant predictors from the multiple linear regression analysis
| Variable | Coefficient β | Significance (p) | Interpretation |
|---|---|---|---|
| Sound pressure level | –0.103 | 0.000 | strongest and most significant negative predictor: as sound levels increase, auditory comfort decreases |
| Vertical illuminance | –0.020 | 0.040 | statistically significant negative predictor: higher vertical illuminance reduces auditory comfort |
Source: own work.
The overall regression model was statistically significant (F = 11.959, p < 0.001), indicating that the selected environmental variables collectively provide a meaningful explanation of auditory comfort. The model demonstrated a moderate explanatory power, accounting for approximately 29.1% of the variance in auditory comfort (adjusted R2 = 0.291).
The regression results demonstrated that sound pressure level exerted a significant negative influence on auditory comfort (β = –0.103, p < 0.001), confirming that higher noise levels correspond to lower perceived comfort. Among all predictors, sound pressure level emerged as the dominant variable in the model, exhibiting the strongest standardized effect, indicating that acoustic intensity remains the primary determinant of auditory comfort when multiple environmental variables are considered simultaneously. This outcome is consistent with prior findings emphasizing the detrimental impact of excessive sound exposure on users’ acoustic satisfaction. Interestingly, vertical illuminance also appeared as a statistically significant predictor, though with a smaller negative coefficient (β = –0.020, p = 0.040). In practical terms, this means that greater vertical brightness was associated with slightly reduced auditory comfort ratings, whereas lower levels seemed to enhance perceived comfort.
One possible explanation is that elevated vertical illuminance can create a sense of glare or visual distraction, which in turn heightens sensitivity to unwanted sounds. This interpretation underscores the subtle yet meaningful cross-influences between visual and auditory domains. The results further demonstrate that auditory comfort is shaped by a combination of environmental factors rather than isolated variables, highlighting the importance of evaluating environmental conditions within a holistic, multisensory framework.
A noteworthy finding is that vertical illuminance, which did not show a significant relationship in correlation analysis, became significant in regression analysis. This finding indicates the presence of a suppressor effect within the multivariate structure of the data. While vertical illuminance alone does not exhibit a direct relationship with auditory comfort, its influence becomes apparent when the shared variance with other environmental variables is controlled. This difference stems from the fact that correlation only assesses pairwise linear relationships, whereas regression accounts for the simultaneous contribution of all variables, controlling for interrelations. Thus, the significance of vertical illuminance in regression suggests that its effect on auditory comfort is shaped through suppressor relationships with other environmental variables (Fig. 3). Air temperature, relative humidity, wind speed, mean radiant temperature, and horizontal illuminance were not statistically significant predictors (p > 0.05). Nevertheless, the inclusion of these variables in the model contributes to a more comprehensive understanding of the environmental system, suggesting that their effects may be indirect or mediated through interactions with other variables.
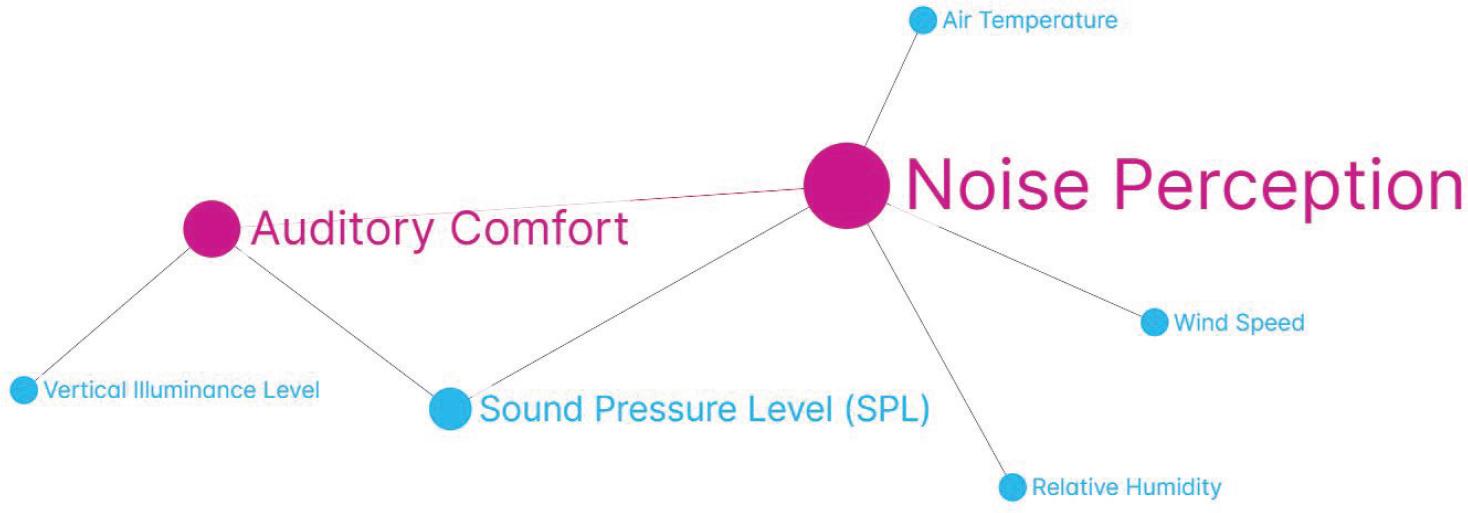
Parameters influencing auditory comfort and noise perception
Source: own work.
Collinearity diagnostics indicated varying levels of interdependence among the predictors, which is expected given the complex interactions between environmental parameters in outdoor environments. Despite this, the model remained statistically robust, and key predictors retained their significance.
Participants’ evaluations of the outdoor acoustic environment reflected not only their perceptions of existing sound sources but also their personal preferences and expectations. To analyze these responses, the perceived and preferred sound types were grouped into four main categories: traffic-related, human-related, natural, and other (Fig. 4).
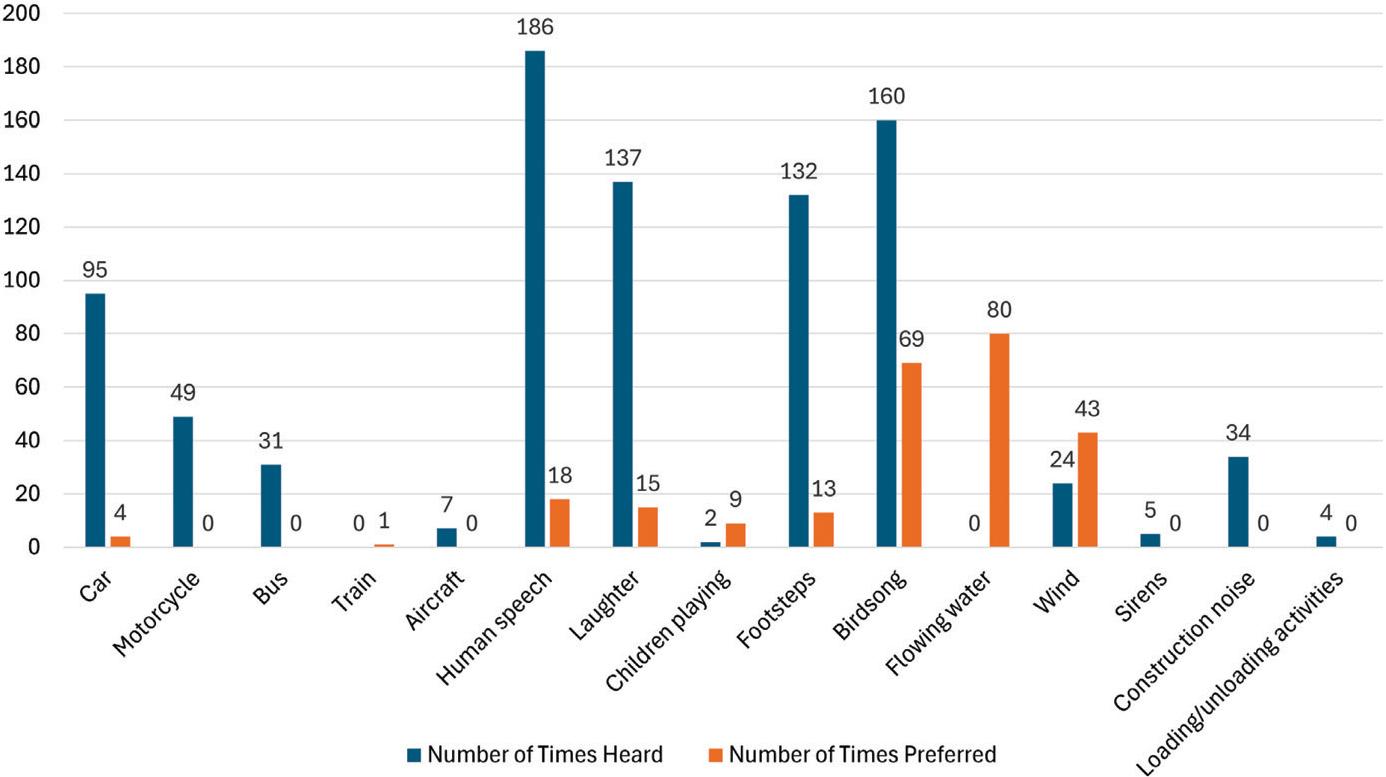
Perceived and preferred sound types in outdoor spaces
Source: own work.
The results reveal a noticeable mismatch between what participants heard most frequently and what they actually preferred to hear. Human-related sounds were the most commonly perceived yet among the least favored. For instance, 186 participants reported hearing speech, but only 18 identified it as a sound they enjoyed. Laughter and footsteps followed a similar pattern, commonly noticed but seldom appreciated. This pattern suggests that although human sounds dominate the outdoor soundscape, they are generally perceived as intrusive background noise rather than sources of comfort.
Traffic-related sounds, such as those from cars, motorcycles, buses, and airplanes, ranked low both in perception frequency and in preference. In particular, sounds generated by motorcycles, buses, and construction activities were never listed as desirable, emphasizing that high-decibel mechanical noise was consistently associated with disturbance and reduced auditory comfort.
By contrast, natural sounds emerged as distinctly preferred. Birdsong was perceived by 160 participants and actively preferred by 69, while flowing water – although absent in the physical setting – was identified as a desirable sound by 80 respondents. This finding clearly positions natural sounds like the most positively valued auditory stimuli in outdoor spaces. Even wind sounds, though less frequently perceived, were relatively well-liked compared to anthropogenic noises.
Overall, these outcomes indicate that the enhancement of outdoor auditory environments should extend beyond mere noise reduction. Urban soundscape design would benefit from strategies that amplify the presence and perceptibility of natural acoustic elements, thereby fostering more restorative and comfortable outdoor experiences.
Participants were also invited to propose strategies that, in their view, could enhance auditory comfort in outdoor environments. They were free to choose multiple options from a predefined list. The results indicate that users tend to associate auditory comfort not merely with the absence of unwanted noise but with a more comprehensive sense of environmental quality (Fig. 5).
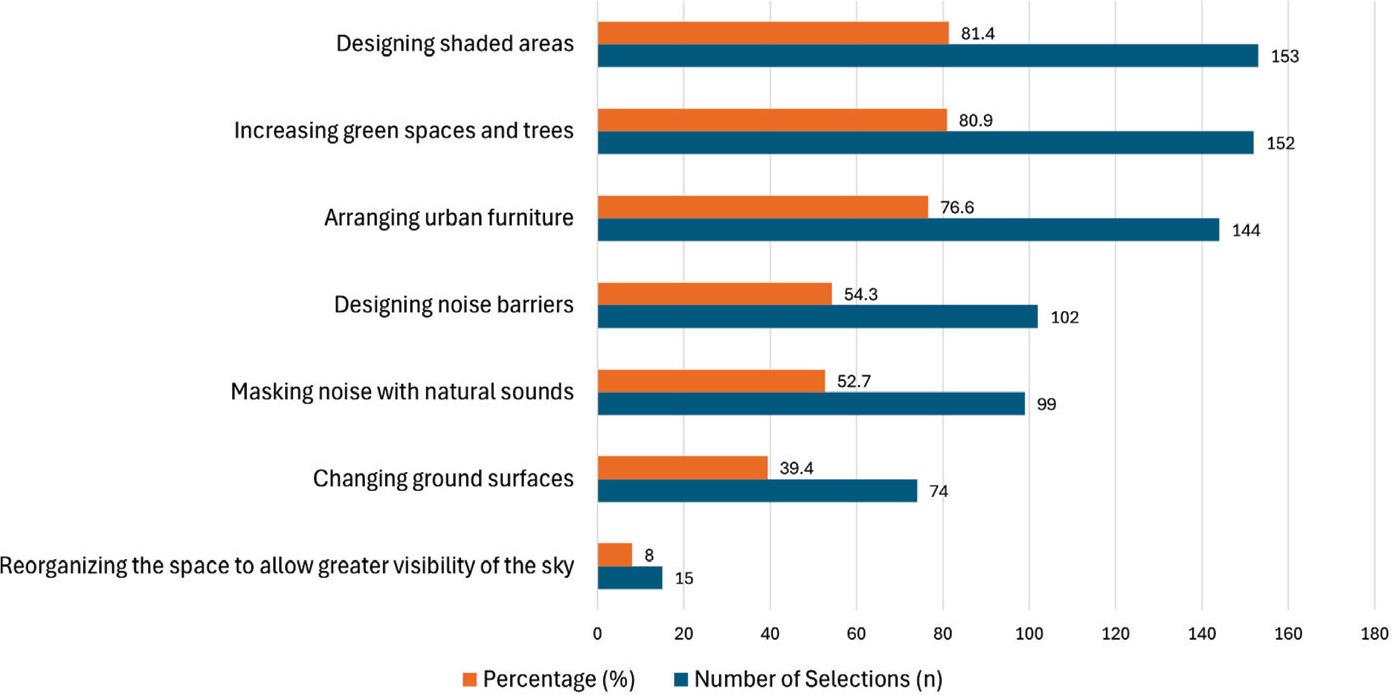
Strategies for improving auditory comfort in outdoor spaces
Source: own work.
Among the proposed strategies, creating shaded areas (81.4%) and increasing greenery and tree density (80.9%) were most frequently selected. These preferences suggest that participants value integrated design solutions capable of simultaneously improving auditory, visual, and thermal comfort. Shaded zones and vegetation not only act as natural sound barriers but also enrich the overall soundscape by accentuating desirable natural sounds.
A similarly high level of agreement was observed for the arrangement of urban furniture (76.6%), emphasizing the influence of spatial organization on acoustic experience. Adjustments in seating orientation, spacing, or surface materials may subtly shape how users perceive the surrounding sound environment.
Direct acoustic interventions were also well received: more than half of the respondents supported the installation of noise barriers (54.3%) and the masking of unwanted noise with natural sounds (52.7%). These preferences show that participants favor a dual approach – reducing unpleasant sounds while amplifying positive auditory cues – which is consistent with contemporary soundscape design principles.
By contrast, strategies such as increasing sky visibility or modifying ground surfaces received comparatively lower support, likely because their influence on perceived auditory comfort is indirect.
Taken together, these findings reinforce the notion that auditory comfort in outdoor public spaces extends beyond physical sound levels. It can be enhanced holistically through the integration of natural elements, thoughtful spatial organization, and the deliberate inclusion of positive auditory features.
This research adopted a multidimensional framework to examine how environmental variables influence users’ auditory comfort in outdoor settings. The findings demonstrate that auditory perception is not determined by sound pressure levels alone but emerges from complex interactions among acoustic, thermal, and visual conditions. While confirming several well-established relationships frequently discussed in prior studies, the results also shed light on the subtle, indirect ways in which thermal and visual factors can shape auditory comfort.
The observed negative association between auditory comfort and sound pressure level aligns closely with the broader literature. In the present study, higher measured sound levels corresponded to a marked decrease in participants’ reported comfort, reaffirming the detrimental impact of noise intensity on human well-being. At the same time, the strong positive link between perceived quietness and auditory comfort underscores the dual importance of objective and subjective dimensions of acoustic evaluation (r = 0.772, p < 0.001) (Taghipour et al., 2020; Liang et al., 2021; Ratcliffe, 2021).
Thermal factors (namely air temperature, relative humidity, wind speed, and mean radiant temperature) displayed limited yet noteworthy associations with auditory comfort. Although these variables did not show statistically significant relationships with auditory comfort (p > 0.05), they exhibited significant correlations with noise perception, particularly for air temperature (r = 0.155, p = 0.034), relative humidity (r = –0.202, p = 0.005), and wind speed (r = –0.185, p = 0.011). Such findings strengthen multisensory interpretations of outdoor experience, emphasizing that environmental sensations are typically perceived as an integrated whole. Prior studies have shown, for example, that higher temperatures may reduce noise tolerance and amplify annoyance (Zhang et al., 2020). Likewise, the interplay of wind and humidity has been suggested to influence auditory comfort indirectly by affecting neural excitability and levels of attention (Wang et al., 2021).
Although the correlations between illuminance and auditory comfort were modest, the regression results indicated that vertical illuminance acted as a significant negative predictor. Specifically, vertical illuminance, which was not significant in correlation analysis (r = –0.039, p = 0.591), became statistically significant in the regression model (β = –0.020, p = 0.040). This observation supports the view that excessive brightness or glare, particularly at eye level, can lead to distraction and mild environmental stress (Williamson et al., 2023). In practical terms, increased vertical illuminance may draw visual attention away from the acoustic environment, thereby diminishing auditory comfort.
Participants’ responses concerning perceived and preferred sound types further confirm that comfort depends not only on intensity but also on the qualitative nature of sounds. Natural sounds – such as birdsong, wind rustling, and flowing water – were consistently preferred, whereas anthropogenic sounds from vehicles, construction, or sirens were largely rejected. This pattern supports the concept of positive soundscapes, which recognize natural sounds as restorative and emotionally beneficial (Davies et al., 2009). Beyond acoustic comfort, exposure to natural sounds has also been linked to psychological relaxation and stronger place attachment (Yang & Zhang, 2024).
Finally, participants’ suggested strategies reveal that improving auditory comfort involves both acoustic management and spatial design considerations. The most frequently preferred strategies included increasing shaded areas (81.4%), enhancing vegetation density (80.9%), and improving urban furniture arrangement (76.6%), while direct acoustic interventions such as noise barriers (54.3%) and sound masking (52.7%) were also widely supported. Commonly endorsed measures – including the use of vegetation, noise barriers, and natural sound masking – reflect a preference for holistic soundscape design approaches that seek to attenuate undesirable sounds while enhancing pleasant ones (Fei et al., 2025). From this perspective, effective outdoor design should move beyond conventional noise control, integrating multisensory principles that simultaneously support acoustic, visual, and thermal well-being.
The results indicate that the acoustic environment remains the most influential factor in shaping outdoor auditory comfort. Lower sound pressure levels and stronger perceptions of quietness consistently contributed to higher comfort ratings. At the same time, the observed negative association between vertical illuminance and comfort implies that lighting conditions, particularly brightness in the field of view, may subtly influence how soundscapes are perceived. Although thermal variables such as air temperature, humidity, and wind speed did not directly predict auditory comfort, they affected participants’ perception of noise intensity, suggesting that thermal sensations can modulate how auditory stimuli are cognitively processed. Together, these outcomes point to the inherently multisensory nature of outdoor comfort. Participants’ soundscape preferences further enrich this interpretation. Natural sounds like birdsong, flowing water, and wind were rated as the most pleasant and desirable, whereas human-related (speech, laughter) and mechanical sounds (traffic, construction) were typically disliked. This finding underscores that a comfortable sound environment depends not only on quietness but also on the quality and diversity of sounds present. The strategies most often proposed by participants – including expanding green areas, introducing shaded structures, reorganizing urban furniture, and masking unwanted sounds with natural ones – illustrate a clear preference for environments that balance sensory richness with tranquility. Overall, the study demonstrates that improving auditory comfort in public open spaces requires an integrated design perspective. Beyond traditional noise control, planners should adopt multidimensional strategies that enhance natural sound presence, strengthen visual quality, and ensure favorable microclimatic conditions. Further research conducted across different seasons, climatic zones, and demographic groups will be essential for deepening the understanding of these multisensory comfort interactions and refining soundscape-oriented urban design practices.