
FIGURE 1.
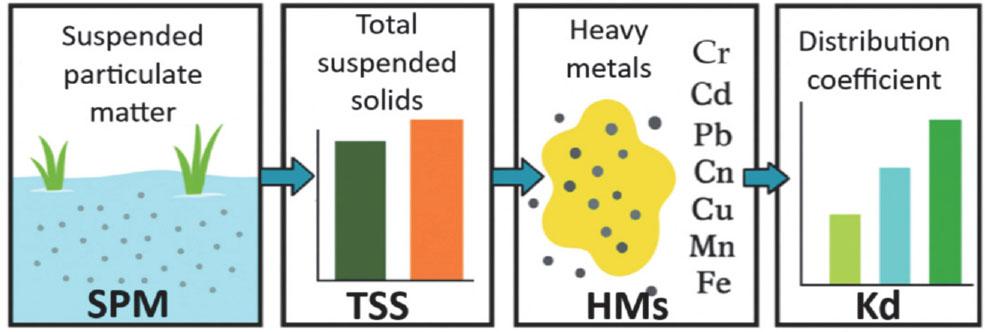
FIGURE 2.
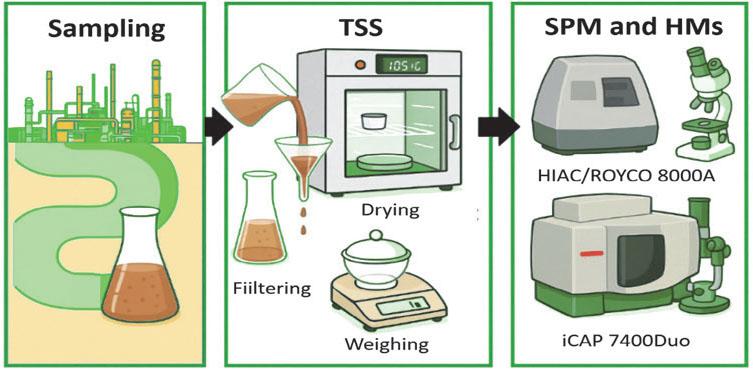
FIGURE 3.
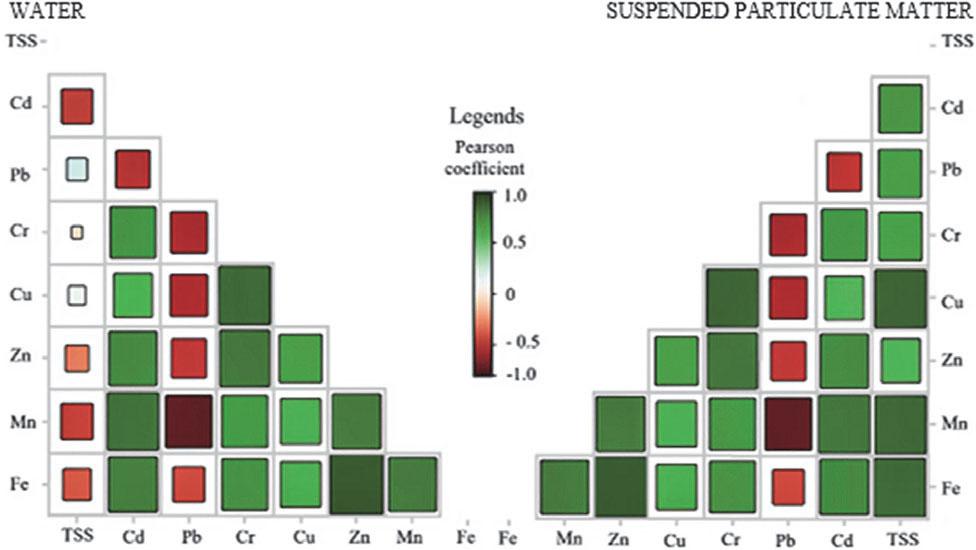
FIGURE 4.
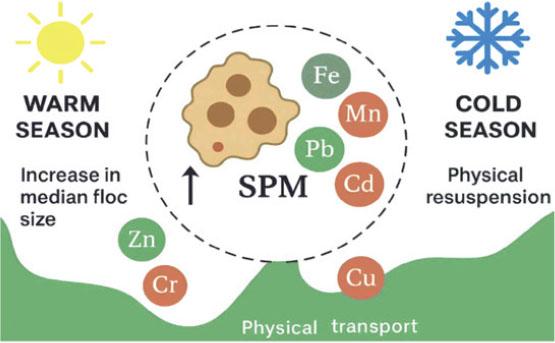
FIGURE 5.
Concentrations of total suspended solids during cold and warm periods
| Period | M [mg·L−1] | SD [mg·L−1] | min–max [mg·L−1] |
|---|---|---|---|
| Cold | 16.2 | 7.3 | 5–30 |
| Warm | 21.7 | 7.1 | 10–35 |
Morphological differences in the suspended particulate matter flocs in cold and warm periods
| Feature | Cold period | Warm period |
|---|---|---|
| Visual appearance | small, dispersed, fine flocs | larger, more aggregated flocs |
| Dominant floc size range (min–max) [µm] | 8–15 | 20–30 |
| Floc size D50 [µm] | 11.4 | 24.8 |
| Structural compactness | more discrete, less aggregated | more compact and cohesive structures |
Distribution coefficient (Kd) values for heavy metals (HMs) and phase affinity interpretation
| HM | Kd | Phase affinity | ||
|---|---|---|---|---|
| min | M | max | ||
| Cd | 15.40 | 33.20 | 77.60 | high absorption onto the solid phase |
| Pb | 2.20 | 7.80 | 18.20 | high absorption onto the solid phase |
| Cr | 0.02 | 0.11 | 0.31 | high dissolution into the liquid phase |
| Cu | 0.30 | 1.21 | 2.05 | intermediate absorption |
| Zn | 0.12 | 0.63 | 0.71 | tendency toward dissolution |
| Mn | 53.10 | 104.30 | 502.10 | high absorption onto the solid phase |
| Fe | 203.10 | 455.60 | 707.20 | very strong absorption onto the solid phase |
Content of heavy metals in dissolved and particulate phases during cold and warm periods
| Phase/Period | HM content [%] | ||||||
|---|---|---|---|---|---|---|---|
| Fe | Mn | Cu | Zn | Pb | Cr | Cd | |
| Water/cold period | 47.4 | 25.6 | 4.7 | 3.1 | 6.9 | 7.8 | 4.5 |
| Water/warm period | 50.2 | 34.7 | 3.2 | 1.3 | 4.0 | 5.1 | 1.5 |
| Suspended particulate matter/cold period | 85.1 | 8.3 | 1.8 | 1.0 | 2.0 | 1.1 | 0.7 |
| Suspended particulate matter/warm period | 89.4 | 6.0 | 1.4 | 0.9 | 1.2 | 0.6 | 0.5 |