
Earthquakes are natural disasters that frequently occur in Indonesia. As a country with a high possibility of an earthquake, the research to prevent infrastructure from seismic damage was reviewed, such as the microtremor analysis for seismic site effects (Fitri et al., 2018), the examination of shear strain for seismic micro-zonation of areas (Fitri, 2023) and the calculation for estimating the loss at locations (Purwana et al., 2022). Another natural problem induced by this issue is soil liquefaction. In 2006, soil liquefaction triggered by earthquakes caused massive damage in Yogyakarta (Sarah & Soebowo, 2013), initial liquefaction in Lombok (Tsimopoulou et al., 2020), and flow slides in Palu, both in 2018 (Kusumawardani et al., 2021).
The analysis of soil liquefaction is examined widely, especially in several locations in Yogyakarta. Commonly used methods in liquefaction studies include systematic reviews (Fitri & Sawada, 2024), calculation of the safety factor and liquefaction potential index to assess the liquefaction potential (Wicaksono et al., 2023), integration with the liquefaction severity index (Dwiyantoro et al., 2023a), comparison of element simulations with simplified methods (Fitri & Sawada, 2025), and application of probabilistic methods such as analytic hierarchy process and fuzzy sets (Ilham & Putra, 2024). Another method is a non-linear analysis for seismic calculation; however, this approach is not widely used for liquefaction in Yogyakarta, although several studies applied this framework for liquefaction in other locations in Indonesia, such as liquefaction in Palu (Jalil et al., 2021b). In addition, there is vast potential for using non-linear analysis to assess liquefaction, such as pore water pressure (PWP) generation. However, only a limited number of studies combine strain calculation with PWP to assess liquefaction potential.
Although the PWP ratio is a general assessment of non-linear analysis in liquefaction potential, indicating that effective stress reaches zero, the shear strain ratio plays a crucial role in this examination. The amplitude of shear strain influences liquefaction resistance, as soil liquefaction resistance decreases as the amplitude of shear strain increases. Shear strain is a critical parameter in estimating the excess pore water pressure ratio during liquefaction, and it is an essential input for predicting pore water pressure. It affects pre-shearing as liquefaction resistance can be enhanced by small shear strain amplitudes (below 0.35%), while it can be decreased by larger amplitudes (above 0.6%) (Jas & Jana, 2024). Combining the PWP ratio and shear strain observation is important for practical stress assessment in soil liquefaction.
This research aims to generate the liquefaction analysis based on PWP generation and dissipation ratio correlated by the shear strain ratio in the underpass at the Yogyakarta International Airport (YIA). This research is expected to provide a comprehensive assessment of non-linear seismic response concerning liquefaction potential that offers a broad perspective of soil liquefaction methods.
The primary cause of soil liquefaction is the accumulation of excess pore water pressure, referred to as the liquefaction mechanism. The pore water pressure can increase quickly during earthquakes or other cyclic loading events, possibly reaching a level where soil particles are forced apart, resulting in soil strength and liquefaction loss. The pore water pressure generation and dissipation characteristics are integrated into DEEPSOIL’s accurate modeling, which enables more realistic representations of soil behavior during seismic events. Soil models are dependent on pressure, and the software employs pressure-dependent hyperbolic models, which account for the influence of pore water pressure on soil behavior. DEEPSOIL provides a variety of pore water pressure generation models, including the Vucetic and Dobry theory for sands and the Matasovic approach for clays, allowing users to select the most suitable model for the specific soil characteristics (DEEPSOIL, 2024). The quantitative analysis in the software enables the determination of the pore water pressure ratio (ru), which is crucial for determining the likelihood and severity of liquefaction. For instance, liquefaction is generally assumed to have occurred when ru surpasses 0.8. Time-dependent analysis in DEEPSOIL allows users to observe the evolution of pore water pressure over time during a seismic event, thereby elucidating the development of liquefaction potential (Mei et al., 2015; Oktarina et al., 2023).
The approach of pore water pressure in DEEPSOIL was assessed by Mei et al. (2020), who validated the GQ/H+u model’s capacity for generating cyclic soil behavior through dynamic centrifuge experiments with liquefiable sands. Another observation is a calibrated model in DEEPSOIL to a reasonable level of pore water pressure generation and an existing probabilistic possibility of a liquefaction curve capable of simulating strain-softening in the Marina earthquake simulation (Mojtahedzadeh & Siddharthan, 2021). Moreover, the efficiency of the simplified method for calibrating the pore pressure energy-based estimation model of Berrill and Davis is demonstrated by the excellent integration between the experiments of the excess pore pressure time histories and the empirical findings of the centrifuge tests, as well as the generated excess pore pressure descriptions of three case histories compared to the results accomplished by using another 1D non-linear code in DEEPSOIL (Mele et al., 2023).
In Indonesia, DEEPSOIL is widely used for seismic analysis. This software is applied to check the sensitivity for input motion; results indicate that the less amplification developed, the higher the natural frequency at the site (Syahbana et al., 2019). In addition, this program generates site-specific response analysis, which was used to generate the peak ground acceleration number at each depth and then employed to assess the liquefaction potential. DEEPSOIL is also used to extract the site-specific surface response spectrum from the equivalent-linear and non-linear analyses in Yogyakarta (Dwiyantoro et al., 2023b). Jalil et al. (2021a) also utilized this software to investigate the impact of local soil on the one-dimensional linear site response in the Balaroa, Petobo, and Jono Oge regions, considering the data from various sites within those regions.
This study analyzes liquefaction in an infrastructure project in Yogyakarta, based on the pore water pressure while also accounting for shear strain development in one-dimensional non-linear seismic analysis. This combined analysis is predicted to be a comprehensive assessment of the DEEPSOIL application in Indonesia. A complete understanding of the liquefaction mechanism from seismic analysis offers a better estimation of liquefaction potential and the effects of infrastructure damage due to earthquake-induced liquefaction.
This research location is the underpass access for the YIA project; the three boreholes conducted are named BH1, BH2, and BH3. All detailed locations are presented in Figure 1.
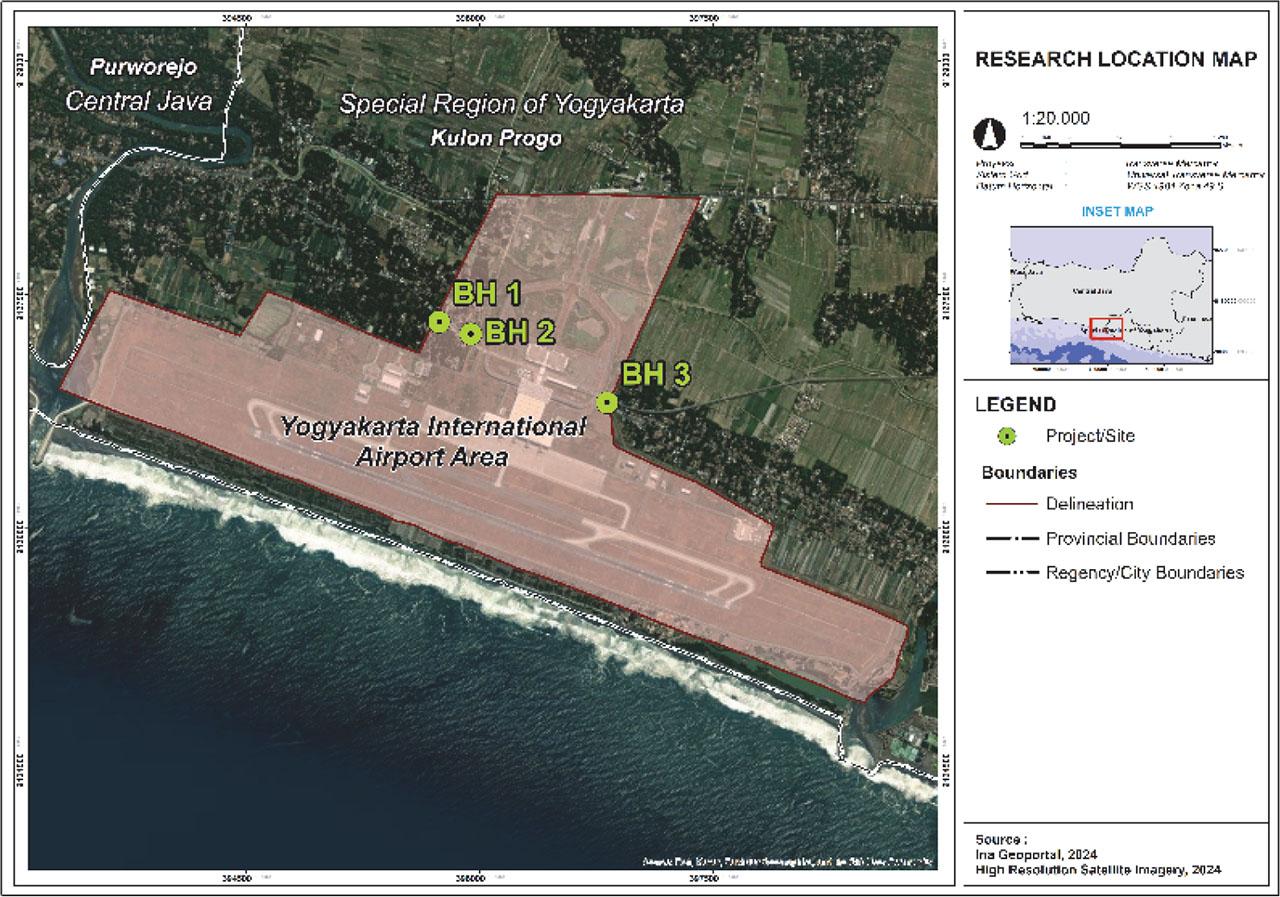
Borehole point in the project location
Source: own work.
This location represents a public infrastructure project that should be considered for more comprehensive liquefaction analysis as a vital building for the public. Moreover, based on the Indonesian liquefaction map (Ministry of Energy and Mineral Resources of the Republic of Indonesia [Kementerian ESDM], 2019), this area has a high possibility for earthquake-induced liquefaction. Detailed analysis is important for informing the stakeholders about infrastructure failure prevention.
The three boreholes from the investigation site for the standard penetration test are simultaneously described as penetration numbers called N-values (NSPT). The soil subgrade, with a loose and medium consistency, is dominated by sand. The depth of the ground is around 10–12 m. The general information for BH1, BH2, and BH3 is depicted in Figures 2, 3, and 4, respectively.
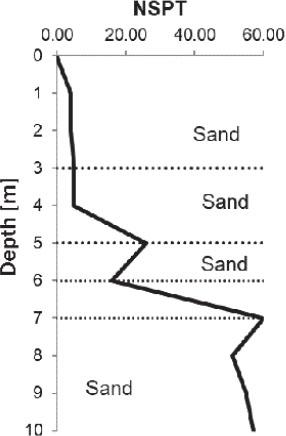
Detailed standard penetration test results (NSPT) for borehole BH1
Source: own work.
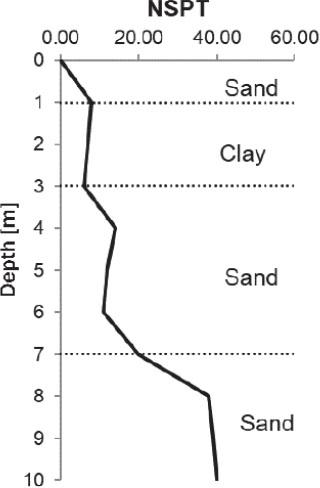
Detailed standard penetration test results (NSPT) for borehole BH2
Source: own work.
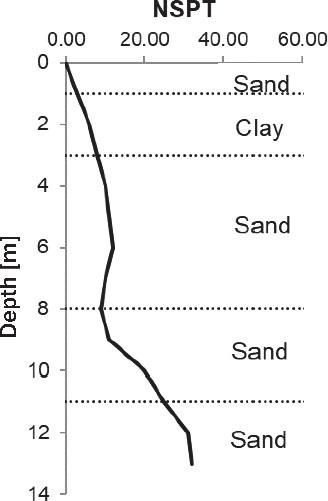
Detailed standard penetration test results (NSPT) for borehole BH3
Source: own work.
Based on Figure 2, all the layers are dominated by sand and are considered to have a high possibility of liquefaction. However, in Figures 3 and 4, the presence of clay layers will cause a complex calculation for liquefaction analysis through non-linear analysis. In the empirical calculation for the assessment factor of safety, the clay layer is excluded from the calculation and is directly determined as the non-liquefiable soil, with no connection between the layered soil. Besides, the effects of liquefaction may not reach the surface if a shallow sediment layer overlies a non-liquefiable clay layer. The propagation of seismic vibrations and the overall susceptibility of the site to liquefaction may be influenced by the presence of clay strata, which can result in a more complicated behavior in the soil profile (Geotechnical Engineering Bureau & New York State Department of Transportation, 2007; Marasini & Okamura, 2014).
Three standard penetration test values are calculated to generate shear wave velocity (Vs), which could be calculated as follows:
The value is applied to plot the soil properties in DEEPSOIL (Hashash, 2024). This program is a non-linear site response analysis to simulate the liquefaction behavior of the layered ground. The constitutive model applied in this research is generalized/hyperbolic for developing the pore water pressure ratio (GQ/H+PWP) (Mei, 2018). In addition, the Darendeli model is utilized to generate the damping ratio value and modulus reduction at every soil layer to produce an efficient hyperbolic depiction and offer greater precision at high strains (Darendeli, 2001). The shear strength calculated is adopted by the Mohr–Coulomb characteristic, in which the soil properties are directly calculated based on the consolidated overconsolidation ratio (OCR).
The PWP ratio (ru) can be employed to depict the growth of PWP throughout loading cycles. Depending on the soil type, the DEEPSOIL numerical equipment illustrates variations in ru using various implemented models. The application of Terzaghi’s 1D consolidation theory in DEEPSOIL addresses the loss of excess PWP. Regarding the evaluation of PWP dissipation, this theory requires an understanding of the soil’s coefficient of consolidation (Cv). The Cv is calculated for every layer of the specified site profiles. In general, the ru is calculated as Equation 2, but in the DEEPSOIL non-linear analysis, the detailed calculation of ru is presented in Equation 3.
Traditionally, liquefaction is assumed to occur when ru equals one, which signifies the zero value of the effective vertical stress in the sand. Nevertheless, laboratory simulation and field studies have shown that significant deformations can still occur in soils that are highly susceptible to liquefaction, even at lower ru values. For example, pore pressure detectors produced direct instrumental evidence of liquefaction during the Superstition Hills earthquake in 1987 with Mw 6.6. During the earthquake, four transducers installed in a silty sand layer reported a ru that exceeded 0.8, suggesting that liquefaction had taken place at the site (Bullock et al., 2021; Ko & Kayen, 2024).
In this research, to assess the liquefaction of the ground layer, the characteristics have been adopted in Table 1.
Liquefaction based on ru and shear strain [%]
| Definition | Parameter |
|---|---|
| Full liquefaction | 0.8 ≤ ru ≤ 0.9 and γmax ≥ γlim or ru ≥ 0.9 |
| Marginal liquefaction | ru ≥ 0.8 and γmax ≤ γlim |
| No liquefaction | ru ≥ 0.8 |
Source: Raza and Ahmad (2024).
This study applied the ground motion of the Kobe earthquake, available in DEEPSOIL. The ground motion represents the seismic wave to simulate the dynamic behavior of the soil layer. Another Indonesian liquefaction case also used the Kobe earthquake and successfully calculated the non-linear ground response analysis (Jalil et al., 2021b).
The shear wave velocity (Vs) value was initially calculated by correlation. However, for the simplification process, the soil layer is divided by consistency and soil properties. The final dynamic properties, such as shear wave velocity based on the calculation from the standard penetration test from BH1, BH2, and BH3, are presented in Figures 5, 6, and 7, respectively.
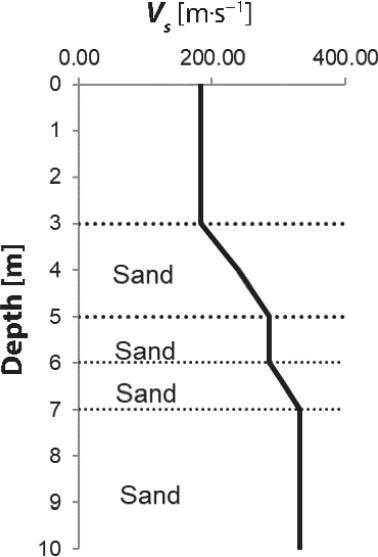
Shear wave velocity (Vs) for borehole BH1
Source: own work.
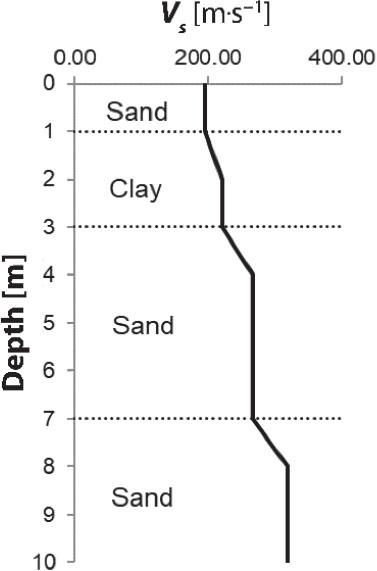
Shear wave velocity (Vs) for borehole BH2
Source: own work.
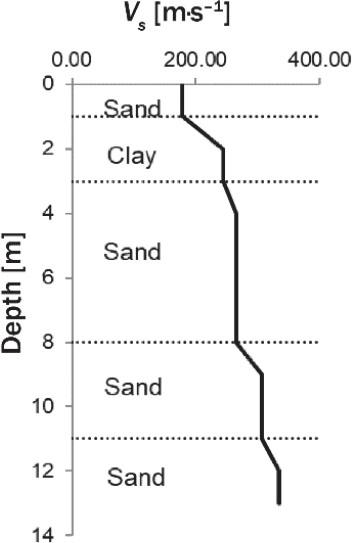
Shear wave velocity (Vs) for borehole BH3
Source: own work.
The results of the PWP ratio from DEEPSOIL for each layer are shown in Figure 8. Figure 8 also shows the variation value between BH1, BH2, and BH3. The initial ru from a depth of 0–2 m is under 0.8 because the groundwater level (GWL) reaches a depth of 3 m. After the location of the GWL (−3.0 m), the ru reaches more than 0.8 in BH1, whereas BH2 and BH3 are placed in that position at around a depth of 6 m. From three data boreholes, the maximum value of ru in BH1 is approximately 4 m, BH2 is around 6 m, and BH3 is about 3 m in depth.
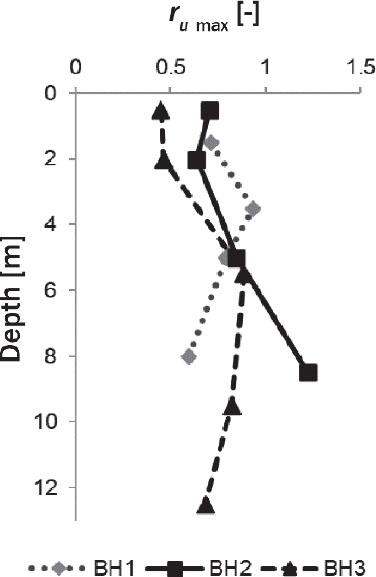
Result of pore water pressure ratio (ru) from boreholes BH1, BH2, and BH3 generated by DEEPSOIL
Source: own work.
Generally, the impact of ground motions proved significant, as ru values in susceptible soil strata consistently exceeded 0.8 under the GWL. This observation underscores the significance of depth-specific evaluations in assessing liquefaction potential. Furthermore, the findings indicated that the soil layer exacerbated susceptibility to soil liquefaction. It has been proven that the ru value did not reach 0.8 in the clay layer; the ru value in BH2 and BH3 will reach 0.8 in sandy conditions. Moreover, engineers must consider the liquefaction potential to design substructures in this layer, such as foundations or tunnels. The value indicating the soil’s liquidity (ru more than 0.8) also induces another problem, such as a decrease in shear strength and landslides. Although the landslide analysis also must consider complex methodologies such as the finite element method or the limit equilibrium method (Fitri & Wahyuni, 2022), this study is limited to the liquefaction behavior investigation only.
The liquefaction analysis for the non-linear approach is not only the ru value but also the strain ratio; the result of strain from DEEPSOIL is shown in Figure 9. Based on this data, the strain ratios almost correlate with the ru value. The maximum strain rate is BH1 with around 8% at a depth of 3 m, while BH2 and BH3 reach the maximum of around 4% at about a depth of 6 m. The maximum shear strain ratio values have a correlation with the maximum ru value in the same depth and boreholes.
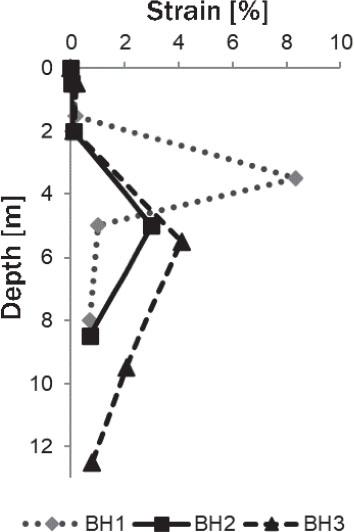
Strain test results from boreholes BH1, BH2, and BH3
Source: own work.
According to the result of ru and strain for each depth, the soil layer represents the combined effect of shear strain, and ru is depicted against time in Figures 10, 11, and 12, respectively. The combined output is based on the maximum value of ru and the full liquefaction condition.
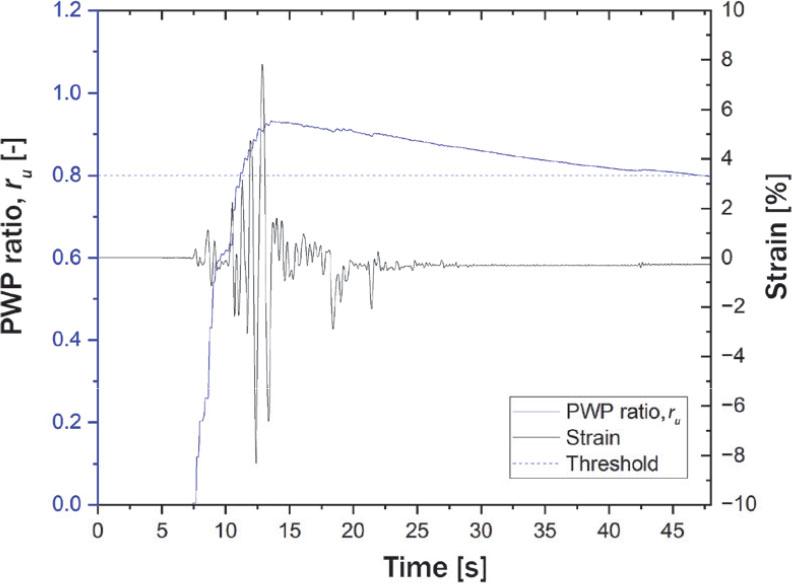
Correlation between strain and pore water pressure ratio (ru) in borehole BH1 at the maximum ru layer
Source: own work.
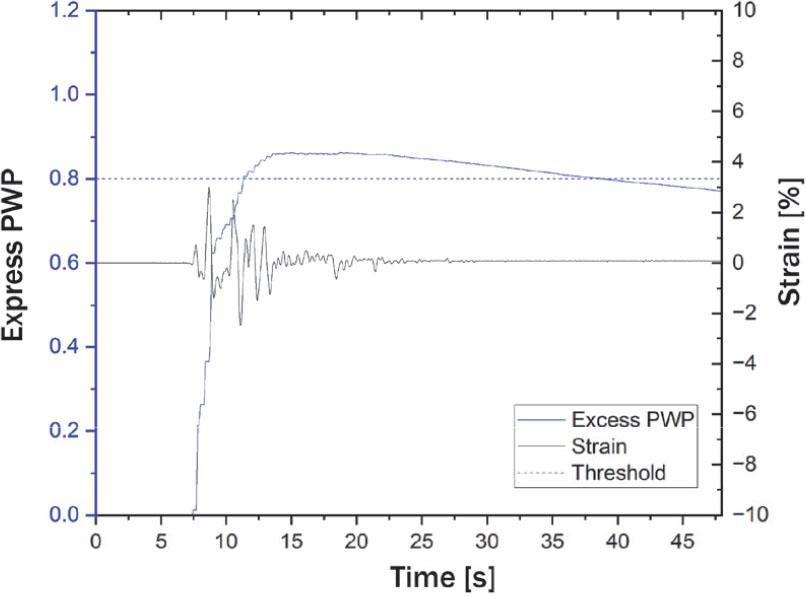
Correlation between strain and pore water pressure ratio (ru) in borehole BH2 at the maximum ru layer
Source: own work.
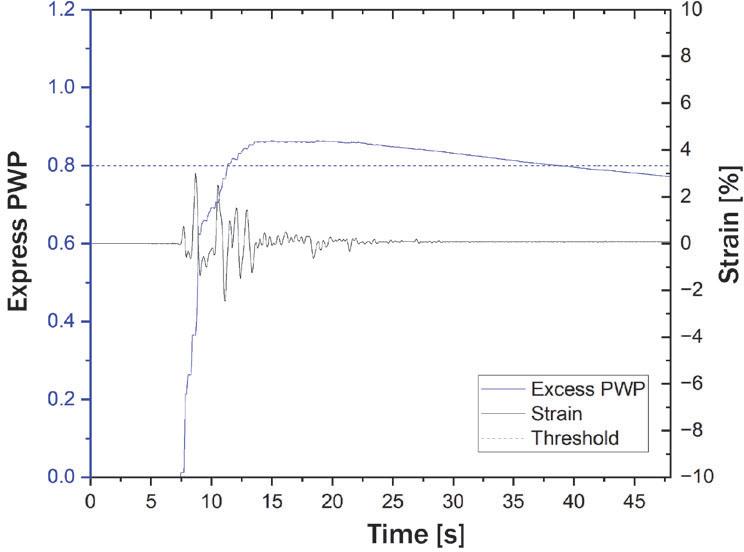
Correlation between strain and pore water pressure ratio (ru) in borehole BH3 at the maximum ru layer
Source: own work.
The general combination results show different outputs for each borehole; this is consistent with Raza’s and Ahmad’s findings (2024), which indicate that the input ground motions resulted in the generation of ru and significant shear strain values, with both parameters demonstrating the rising and falling trends of each layer. Therefore, the soil liquefaction was determined at various depths.
The cyclic loading of soil induces shear strains and increases pore water pressure during an earthquake. Throughout ground shaking, the development of excess pore water pressure and shear strain undergoes a time-dependent analysis. In order to more accurately represent the cyclic demand on soil, advanced methods consider the intensity, duration, and frequency content of input motions (Kramer & Mayfield, 2007). The empirical method typically applies peak ground acceleration and magnitude scaling factor from a particular earthquake magnitude, which are dependent on the magnitude (M) and distance (R) of the earthquake, to determine the seismic aspect of the liquefaction analysis. This approach yields more reliability and complexity in field conditions.
Based on the results of the ru maximum value and strain ratio approach, the output emphasizes the deformation behavior of the ground, presenting a maximum value around 8 seconds for BH2 and BH3, and about 13 seconds in BH1. The peak of the ru value also differs among the three boreholes. The highest strain ratio value does not always correspond to the highest value of ru. In addition, this condition means that the strain value indicates the beginning of deformation, although the liquefaction condition is not in the full liquefaction situation. As the shear strain accumulates, it will contribute to the pore water pressure build-up and lead to soil failure.
Generally, the assessment for soil liquefaction in Indonesia is limited to the simplified method. This method examines whether the site has high liquefaction potential or not. However, this study’s non-linear ground response approach simulates the real phenomena of the ground based on the time history that yields the dynamic properties in detail. The specific properties of the seismic ground response are expected to precisely predict the soil liquefaction phenomenon rather than depend on the simplified method.
Generally, the variety of soil properties in different boreholes offers diverse shear wave velocities with the same consistency of sand. This circumstance leads to the result of non-linear seismic analysis at each depth. The maximum pore water pressure ratio (ru) value is at different depths. The BH1 shows maximum value in depth around 3 m, and BH2 and BH3 at about 6 m. The clay layer affects the ru and the correlation with the time in ground motion analysis. Moreover, all the boreholes show that ru > 0.8.
Regarding the other dynamic examinations, such as shear strain, the shear strain ratio, which corresponds with the same depth of ru value, shows around 8%, 4%, and 4% for BH1, BH2, and BH3, respectively. The maximum ru value is strongly correlated with the highest shear strain ratio. However, the value does not correspond with the ru at a particular ground motion time. The maximum point between the ru and the shear strain ratio is reached in different periods. Therefore, based on the correlation between ru and strain ratio, the three boreholes predict a full liquefaction condition from non-linear seismic response analysis. The output proves that the strong behavior of the strain ratio and ru systematically contributes to the liquefaction condition of the ground. Engineers should take into account the dynamic properties of the ground carefully.