

Green spaces play an essential role in providing thermal comfort and mitigating the heat island effect, which leads to thermal discomfort due to rapid climate change. To reduce urban heat, green spaces contribute significantly to climate adaptation strategies, creating more sustainable and livable urban environments (Marando et al., 2022). Greening strategies, such as planting trees along streets, have been shown to improve urban thermal conditions by providing shade and enhancing evapotranspiration (Coccolo et al., 2018). Street greening involves incorporating various forms of green space, such as grass, shrubs, and trees, along streets to enhance outdoor thermal comfort, thereby improving the environmental quality and aesthetic appeal of urban areas; this approach promotes sustainable urban development (Klemm et al., 2015). Innovative solutions, such as street greening, play a crucial role in improving living conditions in hot and dry climates. Among the different types of trees, palm trees represent a suitable choice due to their flexibility – they are particularly suitable for these climates due to their adaptive, drought-resistant properties and capacity to grow with minimal water – making them an ideal choice for street greening projects to improve thermal comfort. They also provide significant cooling benefits by offering shade, which directly influences surface temperatures and the surrounding environment. Additionally, the relative humidity produced by palm trees in the atmosphere contributes to local cooling effects (Gillner et al., 2015). This paper aims to measure the improvement in thermal comfort through street greening based on palm trees in a hot and dry climate. This study examines the city of Sidi Okba, located in the southeastern Algerian state of Biskra. It is one of the largest oases in Biskra and is famous for its vegetation, which mainly consists of local palm trees Phoenix dactylifera, distinguishing it from other southern cities (Farhi, 2002). In addition, there are trees planted along some streets, such as Fucus retusa and Acacia. Sidi Okba city is distinguished by the richness of its urban fabric, ranging from ancient traditional to modern contemporary.
This study examines the quantitative assessment of street greening based on palm trees. Two streets were selected for analysis. The first is located in the traditional individual residential fabric, which is protected and surrounded by palm groves on the northwestern and southern sides. Palm trees can be found behind some of the residential walls, while the streets themselves are winding and devoid of vegetation. The second street is situated in the collective housing fabric; it is bordered by two facades of similar residential blocks consisting of four stories and has sparse vegetation coverage (Fig. 1).
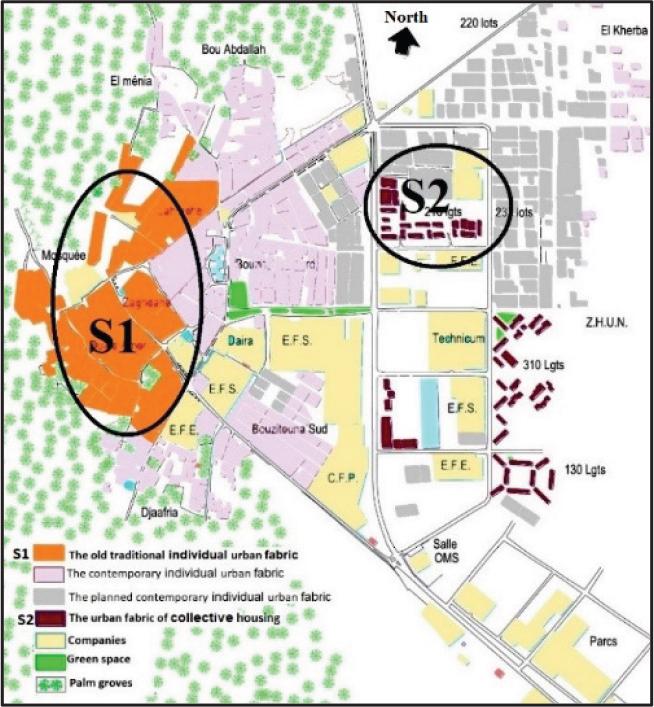
Study area: S1 – site of the traditional individual residential fabric, S2 – site of the collective housing fabric
Source: own work.
The study was conducted on the hottest days of July, the warmest month of summer (from July 10–12, 2024), according to data from the meteorological station closest to the study site. Measurements were collected over a 48-hour period, every 2 hours, using a comparative approach based on measurements and numerical simulation. The current scenario was then compared with the greening scenario. The research aims to provide urban planners, architects, landscape designers, and policymakers with concrete evidence of the palm trees’ climatic benefits. The results will contribute to developing climate-responsive urban design and creating more resilient and comfortable cities in hot and dry climates.
Palm trees were used for street greening in hot and dry climates due to their ability to withstand high temperatures and grow in arid conditions. They provide shade and reduce temperatures. When planted along streets, sidewalks, and other public places in urban areas, these trees are selected according to their type, shape, and size. In addition, palm trees have a high transpiration rate and enhance the cooling effect through evaporation, as they absorb solar radiation and use it to convert water into steam, thereby reducing air temperature (Bencheikh & Rchid, 2012).
Many studies emphasize the importance of palm trees in enhancing outdoor thermal comfort, especially in hot and dry climates. Many studies have conducted field measurements and simulations to evaluate the impact of palm trees on local climatic conditions.
In a study by Teshnehdel et al. (2020), the results indicated that the presence of trees, including palm trees, significantly reduced air temperatures in urban areas. Under the palm tree canopy, temperatures decreased by 5°C compared to unshaded regions, which improves comfort for pedestrians and urban users, encouraging more outdoor activities during the hot months. A study by Bencheikh and Rchid (2012) stated that palm trees contribute to cooling by providing shade. They help reduce surface temperatures under their canopies, and their leaves can block sunlight, thereby lowering surface temperatures. Matallah et al. (2023) also stated that the process of evaporation, by releasing water vapor from the leaves, leads to the cooling of the surrounding air. According to the study, palm trees can absorb carbon dioxide, improving air quality and quality of life (Audu & Lintoc, 2018; Boukhabla et al., 2022). In general, based on a review of the most important studies on greening with palm trees, we may conclude that planting palm trees in urban areas helps create cooler microclimates and improves outdoor thermal comfort in hot and dry climates.
A study by Arab et al. (2016) stated that Phoenix dactylifera trees are distinguished by their ability to provide shade and their adaptability to hot, dry environments. This is due to their tall trunks, wide leaves, and expansive canopies, which reduce ground temperatures and enhance thermal comfort for pedestrians. A study by Youcef and Guedouh (2023) also indicated that palm trees reduce surface temperatures by 5°C under direct sunlight, increasing pedestrian comfort levels and enhancing city sustainability. Numerous studies have highlighted the significant role of palm trees in enhancing thermal comfort, maintaining environmental balance, promoting biodiversity, and absorbing pollutants, making them highly suitable for cities in arid climates and contributing to improve air quality. Research also emphasizes the psychological benefits of incorporating trees of all types into urban planning, as they foster relaxation and recreation while improving the outdoor climate (Elsadek et al., 2019).
Although some research has addressed the effects of street planting with palm trees on thermal comfort, significant research gaps remain, as summarized further in the text.
The influence of local wind patterns and incident sunlight on the effectiveness of trees in urban environments remains insufficiently explored and has not been studied. Research highlights that tree canopy characteristics, such as leaf area index (LAI) and crown density, significantly contribute to reducing stress and enhancing relative humidity levels (Geletič et al., 2022; Liu et al., 2023); however, no comprehensive analyses integrate these variables across different urban areas.
Current research has neglected seasonal changes in temperature and humidity, which are necessary to evaluate the impact of street planting with palm trees on outdoor thermal comfort across different seasons (moderate, cold, and hot). This neglect can lead to less accurate insights on the topic throughout the year.
The physiological effects of street trees on the urban environment appear significantly between summer and winter, influencing the level of general comfort experienced by pedestrians (Ren et al., 2022).
The geographic focus of most studies on street greening limits their applicability to diverse urban settings. This geographical limitation restricts the generalizability of results across different climatic contexts, especially in hot climates and dry regions where local trees are commonly used for urban greening (Liu et al., 2023).
Research has primarily focused on the cooling effects of palm trees, but little attention has been given to their long-term sustainability. This includes assessing their longevity and the resources required for their maintenance. While most studies have explored the role of palm trees in reducing temperatures, there is a notable gap in research evaluating their long-term viability and the requirements for their maintenance and care. Addressing this gap involves assessing the sustainability of palm trees in urban areas by examining their longevity and the resources needed for upkeep.
Measuring the impact of street greening with palm trees on outdoor thermal comfort depends on a multifaceted approach that integrates various research methodologies. This strategy includes local climate analysis, measurement of thermal comfort indicators, numerical simulation, and surveys to comprehensively understand how urban greening enhances thermal comfort, especially in hot and dry climates.
Researchers analyze the local climate by measuring basic climatic parameters to evaluate the environmental conditions that affect thermal comfort, such as air temperature, relative humidity, wind speed, and solar radiation. In many measurement campaigns, climatic data is collected using portable weather stations and measuring instruments, as well as microelectronic devices such as Testo 480 (Jing et al., 2024).
Thermal comfort indicators are standardized measures used to evaluate human thermal sensation and potential thermal stress. In this study, the analysis focuses on the fundamental climatic parameters (air temperature, relative humidity, wind speed) along with mean radiant temperature (MRT). To enhance the evaluation, two additional biometeorological indices, the physiological equivalent temperature (PET) and the new standard effective temperature (SET*), are incorporated. These indices are calculated from measured climate data and modeling outputs, offering a more comprehensive understanding of how various environmental factors influence human comfort.
Digital simulations often analyze the impact of palm trees on thermal comfort using two main strategies: shadow cooling and evaporation/conversion. These methods help researchers evaluate the benefits of palm trees and green infrastructure in urban environments (Bencheikh & Rchid, 2012).
This study aims to quantitatively assess the impact of street greening with palm trees on thermal comfort standards in hot and dry climates. Two streets in the city of Sidi Okba, one of the largest oases in Biskra, located 400 km southeast of Algiers (Fig. 2), were selected for analysis (in accordance with the above context). The methodology of the study was based on a comparative approach. First, field measurements were conducted using the Testo 480 device to evaluate the outdoor thermal comfort of the current situation. Climatic parameters (air temperature, relative humidity, and wind speed), were recorded at two measurement stations on each street. Second, a greening scenario incorporating palm trees was proposed and simulated using the ENVI-met digital program and the RayMan (ver. 2017) software for Street Str2. The results of the field measurements were then compared with those of the proposed scenario.
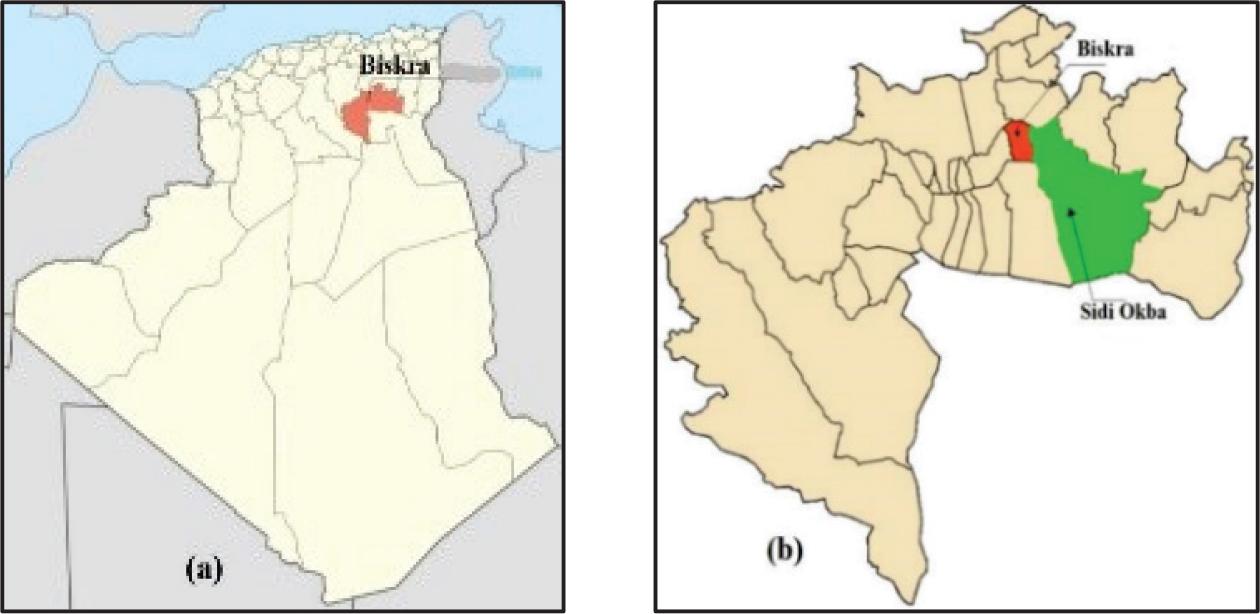
Location of the studied streets in Sidi Okba: a – macroscale of the country, b – microscale of Biskra Province
Source: own work.
The study was conducted on two streets. The first street (Str1) is located within the traditional individual residential fabric and is surrounded on the northwestern and southern sides by palm forests of the local species Phoenix dactylifera. Most residences contain palm trees inside their homes, while the street itself is winding and devoid of vegetation. Its width varies between 2.50 m and 3.00 m. The second street (Str2) is located within the collective housing fabric and is wider, with a width of 7.00 m. Its vegetation cover is weak, and the buildings on both sides have uniform four-story blocks (height 12 m). Two fixed measuring points were chosen for the first street (Str1) – the first station (St1) at the beginning and the second (St2) in its middle. For the second street (Str2), two measuring points were chosen under a palm tree (St3) and under a tree of the local type (St4), which are located on both edges of the street (Table 1).
Sites and measurement stations
| Site | Street | Street trees |
|---|---|---|
| number / type | ||
| S1 Traditional individual residential fabric | ||
| Section on the street (Str1) | ||
| S2 Collective housing fabri | 2 palm tree (Phoenix dactylifera) | |
| Section on the street (Str2) |
Source: own work.
We made a series of measurements every two hours for three consecutive days from 10 July to 12 July 2024, measuring the following climatic factors: air temperature (Ta), relative humidity (Hr), and wind speed (Ws), and using the multi-functional portable device Testo 480-AG 5011ST, 0563 4800 (Fig. 3). The one trip between the two streets took about 10 minutes by car, with readings taken in shaded areas and at an altitude of 1.40 m, to reduce the effect of heat reflected from the ground surface.
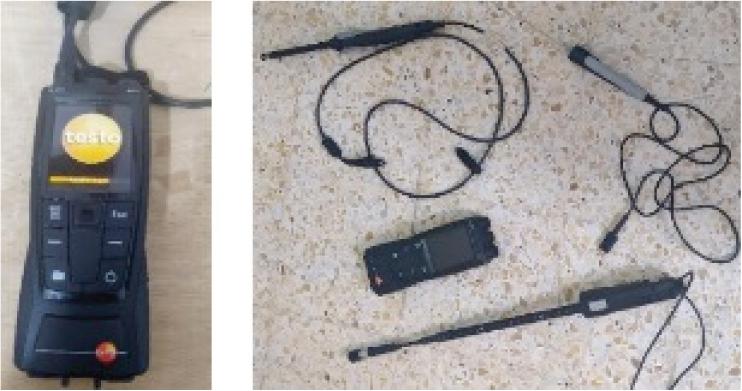
A multifunctional portable device Testo 480-AG 501 1ST, 0563 4800
Source: own work.
The atmosphere was simulated using the Envi-Met software, which required input data (Table 2) such as the simulation date, vegetation type, tree layout, and climatic parameters (air temperature, relative humidity, wind speed, and mean radiant temperature) were simulated and completed in two phases: (a) simulation of the current situation (Str1, Str2), and (b) scenario proposed for street greening simulation (Str2).
Simulation’s settings
| Situation (geographic coordinates) | latitude: 34°75′, longitude: 5°57′ |
| Simulation date | July 10–12, 2024 |
| Simulation start time | 06:00:00 a.m. |
| Initial temperature | 31°C |
| Simulation duration | 48 hours |
| Relative humidity at 2 m above ground [%] | 20% |
| Wind speed at 10 m | 2 m⸱s−1 |
| Wind direction | 135° |
| Specific humidity in 2,500 m | 8.00 g·kg−1 |
Source: own work.
This simulation was conducted to measure the improvement of thermal comfort for different scenarios under the pressure of summer heat, in a hot and dry climate. The experiment was carried out through the following stages:
The first simulation focuses on the current external environment of Street Str1, situated within the traditional individual residential fabric (S1). This area lacks vegetation but is encircled by palm forests dominated by Phoenix dactylifera. Two measurement points (St1 and St2) were selected to evaluate the environmental conditions (Fig. 4).
The second simulation examines the external environment of Street Str2, located within the collective housing fabric (S2), on the eastern side of the city. Measurements were conducted at two points: under a Phoenix dactylifera palm tree at Street St3, and beneath a mulberry tree at Street St4.
Street Str1, characterized by its narrow and winding layout, is situated within the traditional individual residential fabric (S1). It is naturally protected and bordered on the northwestern and southern sides by palm groves. Due to these existing conditions, no additional greening interventions were proposed for this street. In contrast, Street Str2 exhibits limited vegetation coverage. A greening proposal was developed to enhance its environment, utilizing local palm trees Phoenix dactylifera spaced at regular intervals of 5 m. The original measurement points, St3′ and St4′, were retained, but in the greening scenario, they were redesignated as St3′ and St4′ (Fig. 5).
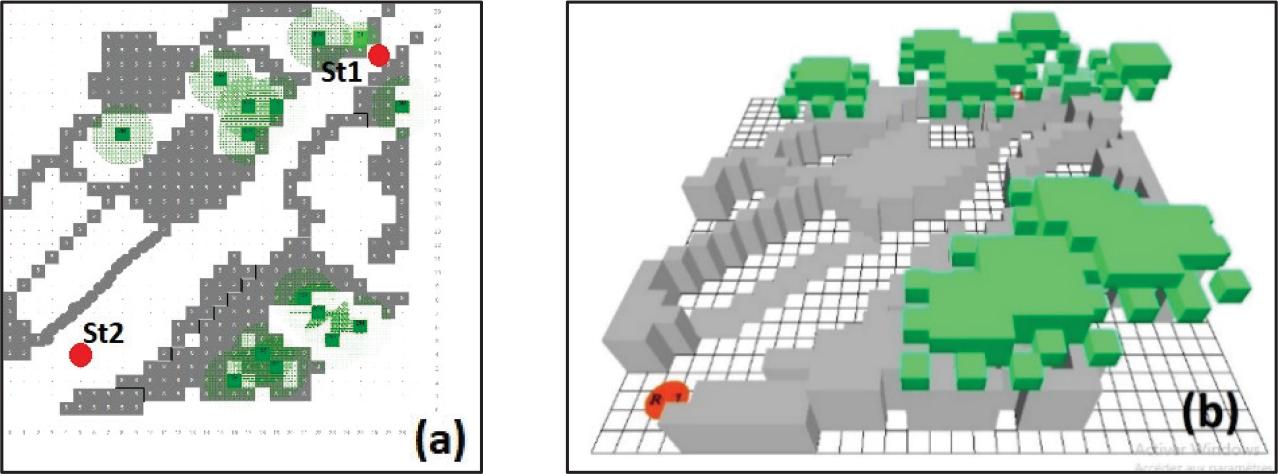
Model domain for the study in ENVI-met in current situation for Street Str1: a – 2D, b – 3D
Source: ENVI-met.
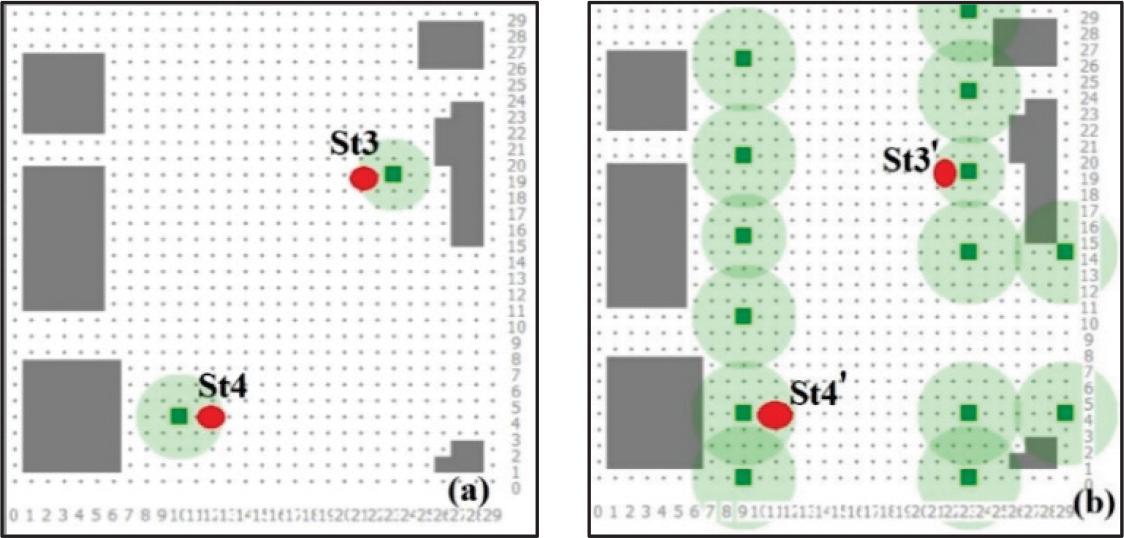
Model domain for the study in ENVI-met: a – current situation, b – proposed for Street Str2 Source: ENVI-met.
The outcomes of the three scenarios were analyzed to assess the contribution of Phoenix dactylifera palm trees to improving thermal comfort in outdoor public spaces, particularly in cities experiencing hot and dry climatic conditions.
To validate the ENVI-met model, we compared the simulated and recorded air temperature in Streets Str1 and Str2 during the period from July 10 to July 12, 2024. We calculated the correlation coefficient (R), the root mean square error (RMSE), the mean absolute error (MAE), and the root mean square percentage error (RMSPE), and then assessed the degree of agreement between the simulated and measured values (Table 3).
Summary of the validation of simulated models for Street 1 (St1, St2) and Street 2 (St3, St4)
| Station | Regression equation | R2 | RMSE [°C] | MAE [°C] | RMSPE [%] |
|---|---|---|---|---|---|
| St1 | y = 1.0164x + 0.3457 | 0.8926 | 1.60 | 1.19 | 4.33 |
| St2 | y = 1.2529x – 7.8296 | 0.8931 | 2.15 | 1.74 | 5.79 |
| St3 | y = 1.0676x – 2.5545 | 0.9980 | 1.50 | 1.21 | 4.09 |
| St4 | y = 0.9474x + 1.9583 | 0.9990 | 1.42 | 1.14 | 3.87 |
Source: own work.
According to ASHRAE Guideline 14-2002 (American Society of Heating, Refrigerating and Air-Conditioning Engineers [ASHRAE], 2014), the correlation coefficient (R) should range from -1.0 to +1.0. In our review of previous studies, we observed that only a limited number of works have validated their numerical models. It was also noted that the accuracy of simulation data becomes evident after the first four hours; therefore, the ENVI-met team recommends considering the simulation time to obtain reliable results.
In our study, we used air temperature to compare simulated data with measured data, and most validation results confirmed that the model maintains acceptable predictive accuracy (Fig. 6).
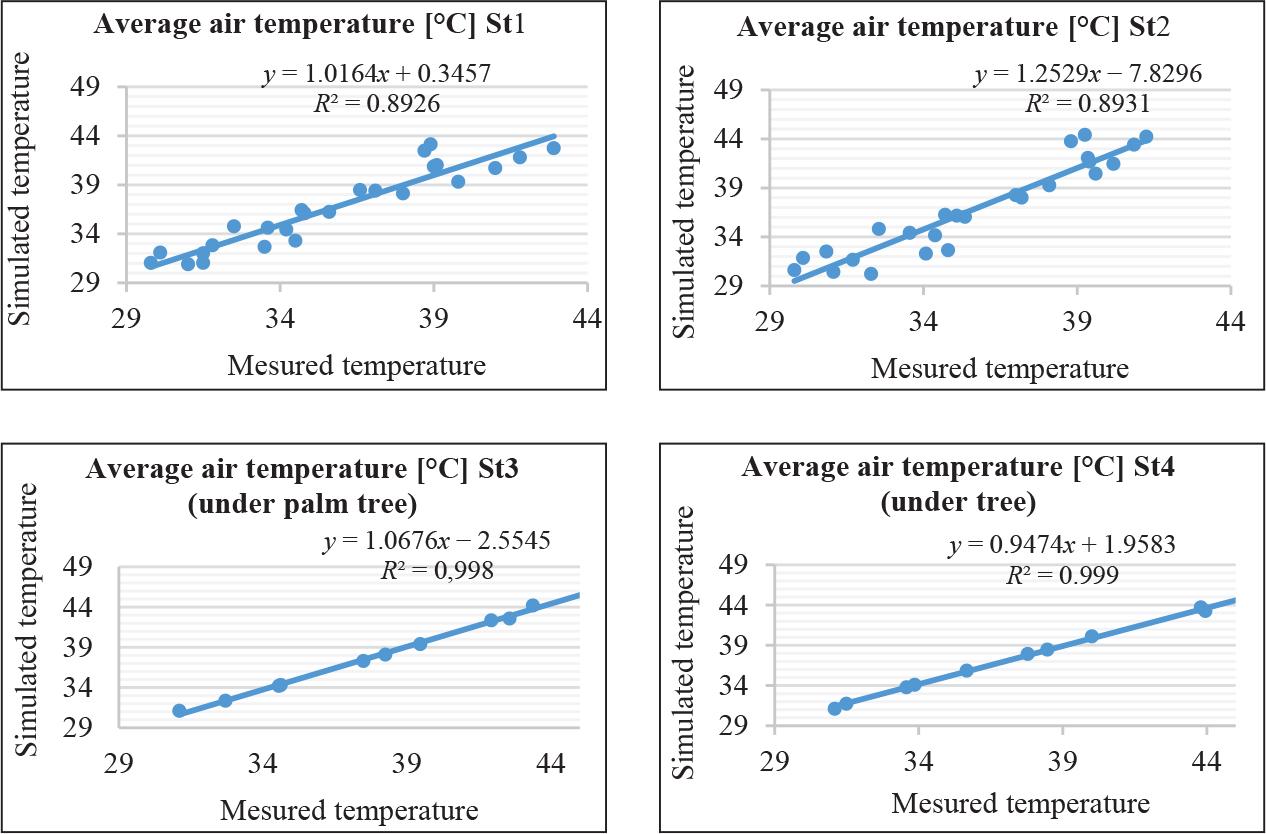
Validation of the simulation models on Street 1 (St1, St2) and Street 2 (St3, St4)
Source: own work.
For Station St2 the regression equation shows a deviation in slope of approximately 25% from unity and a negative intercept, which may indicate relative and systematic biases (Moriasi et al., 2007). To meet the need for additional statistical properties and significance testing, we calculated the root mean square error (RMSE), mean absolute error (MAE), and root mean square percentage error (RMSPE). These are standard metrics in hydrological and environmental modeling for assessing predictive accuracy beyond correlation alone, consistent with the findings of Jackson et al. (2019). Accordingly, we enhanced the regression analysis using supplementary validation measures, including RMSE of 2.15°C, MAE of 1.74°C, and RMSPE of 5.79%. These indicators are widely recognized in climate and environmental modeling as robust measures of model performance beyond the coefficient of determination (R2). Willmott and Matsuura (2005) demonstrated that both RMSE and MAE provide more accurate evaluations of predictive skill, particularly when regression parameters deviate from ideal values. RMSPE also assists in assessing relative deviations of observed values and is more sensitive to relative errors. Furthermore, the steep slope and negative intercept observed at Station St2 are likely influenced by local climatic effects or site-specific factors (the station is located on a street section where surrounding buildings were demolished).
Despite the high R2 value, such deviations in slope and intercept are common in environmental datasets due to microclimatic fluctuations and urban infrastructure, all of which can affect temperature distribution. In this study, most of the additional validation metrics confirmed that the model maintains acceptable predictive accuracy.
Figure 7 presents the outputs generated by Leonardo through the ENVI-met simulation program. At 6:00 a.m., data were recorded for Street Str1, located within the traditional individual residential fabric (S1). The air temperature ranged from 28.40°C to 32.13°C, with relative humidity varying between 40.09% and 49.79%. Wind speed ranged from 0.00 m·s−1 to 1.89 m·s−1, while the mean radiant temperature ranged between 18.02°C and 23.54°C.
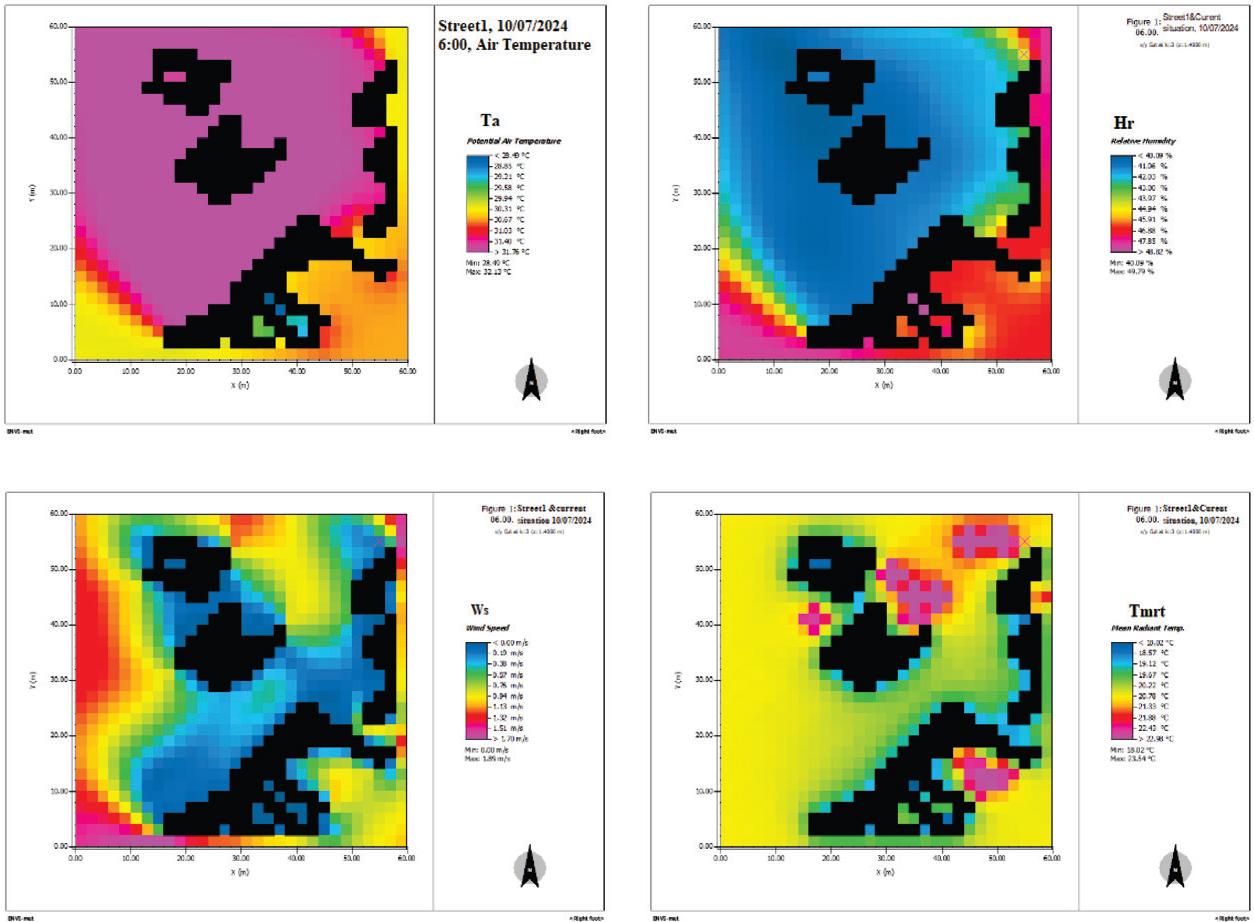
Visualization outputs generated by Leonardo’s (Street 1) modeling software for the current situation
Source: Leonardo from the ENVI-met simulation program.
Figure 8 illustrates the outputs generated by Leonardo using the ENVI-met software, with respect to the street simulation scenario (Str2) under current conditions, within the collective housing fabric (S2) at 6:00 a.m. The air temperature ranged between 32.50°C and 33.61°C, the relative humidity varied between 29.63% and 32.93%, wind speed fluctuated between 0.02 and 1.96 m·s−1, and the mean radiant temperature ranged between 21.73 and 29.68°C.
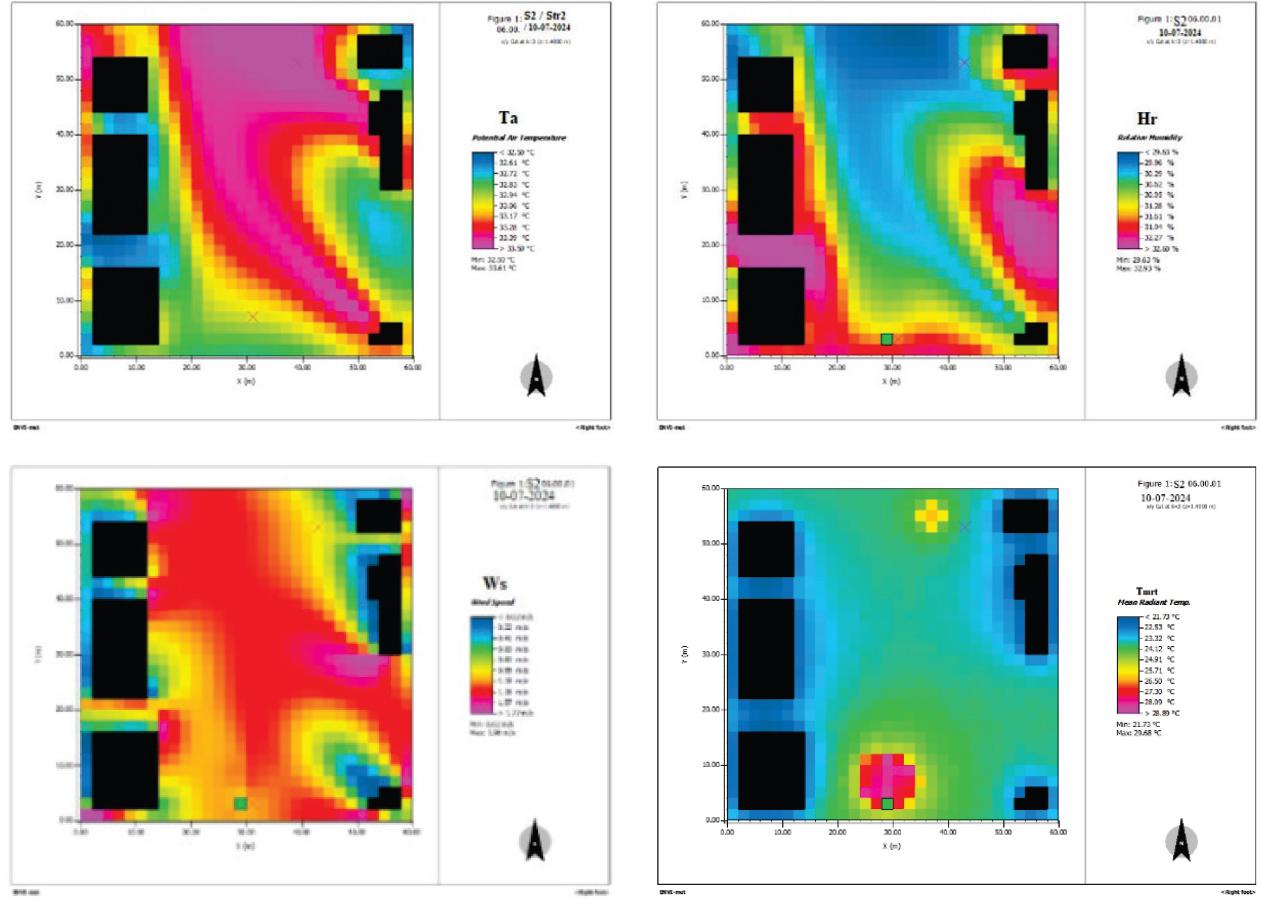
Visualization outputs generated by Leonardo’s (Street 2) modeling software for the current simulation scenario
Source: Leonardo from the ENVI-met simulation program.
Figure 9 presents the outputs generated by Leonardo through the ENVI-met simulation program. It displays the climatic values of the simulation at 6:00 a.m. for Street Str2, located within the collective housing fabric (S2). After proposing a scenario in which the street was planted with local palm trees (Phoenix dactylifera), the results indicated that the air temperature ranged between 32.11°C and 33.33°C, relative humidity varied between 29.45% and 32.77%, wind speed ranged from 0.02 m·s−1 to 1.97 m·s−1, while the mean radiant temperature ranged between 20.30°C and 27.28°C.
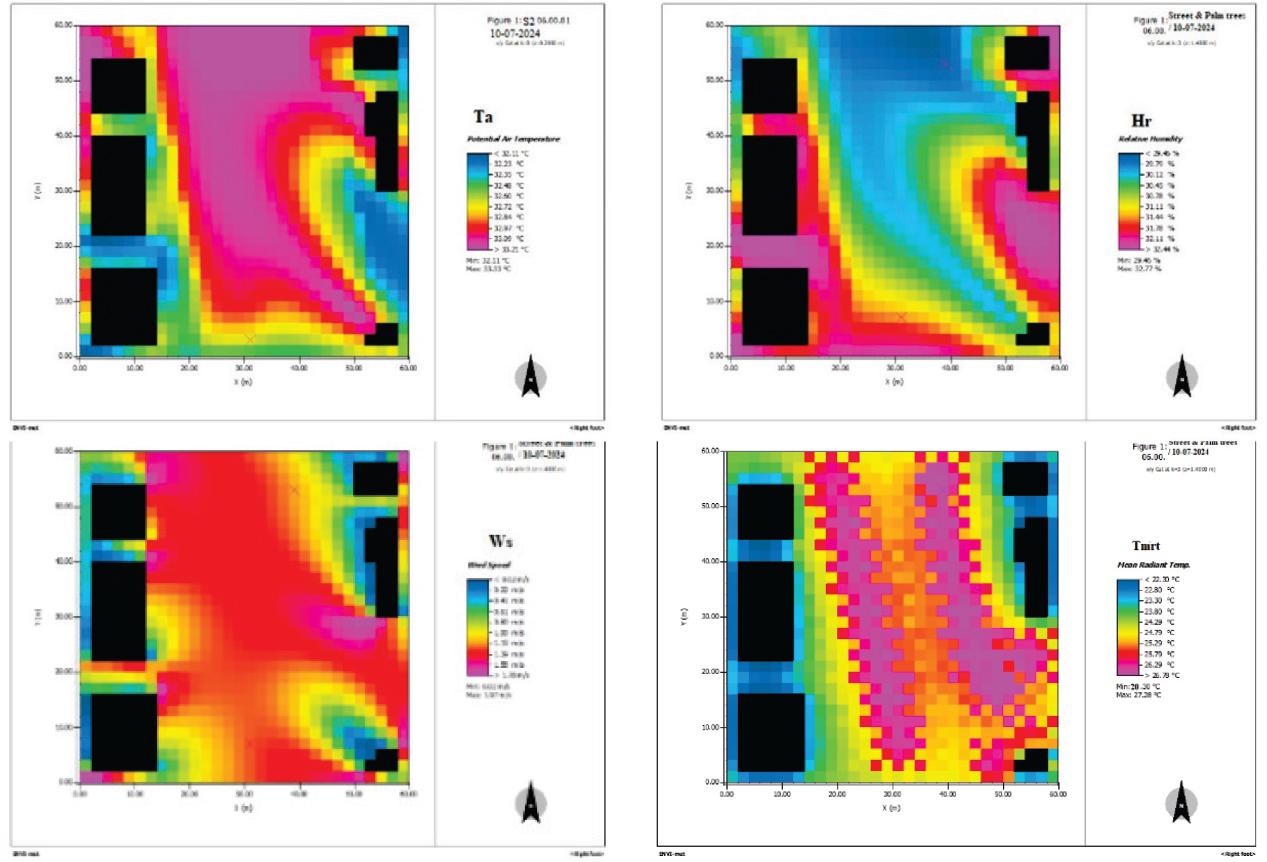
Visualization outputs generated by Leonardo’s (Street 2) for the proposed simulation scenario
Source: Leonardo from the ENVI-met simulation program.
In the current condition of the two streets, it is observed that the air temperature in street Str1 was lower than that in street Str2, with a reduction ranging between 1.86 and 5.20°C. The lowest average temperature recorded was 30.53°C at 4:00 a.m. at Station St1 in Street Str1, compared to 32.39°C at Station St3 in Street Str2. The highest measurement reached 49.57°C at 2:00 p.m. at Station St4 in Street Str2, while the maximum recorded in Street Str1 was 44.37°C at 2:00 p.m. at Station St2. This indicates that Street Str1 provides better thermal comfort within the traditional individual residential fabric compared to Street Str2, which is located in the collective housing fabric. This difference can be explained by the location of Street Str1 within an urban fabric surrounded by palm groves, which contributed to the reduction of air temperatures (Table 4).
Temperature for current situation scenario
| Street | Station | Type | Min temperature [°C] | Max temperature [°C] |
|---|---|---|---|---|
| Str1 | St1 | field measurement | 30.53 | 42.70 |
| St2 | 31.05 | 44.37 | ||
| Str2 | St3 | 32.39 | 47.82 | |
| St4 | 32.96 | 49.57 | ||
| St3′ | simulation (greening) | 31.62 | 45.59 | |
| St4′ | 31.85 | 47.13 |
Source: own work.
In the proposed scenario, which involves the addition of palm trees along Street Str2 (St3′ and St4′), the average air temperature shows a reduction ranging between 0.77°C and 2.44°C compared to the current situation (St3 and St4). The lowest average temperature recorded was 32.39°C at 4:00 a.m. at Station St3 (beneath a palm tree). In the proposed scenario, this measurement decreased to 31.62°C at the same station. The maximum average temperature of 49.57°C was reached at 2:00 p.m., at Station St4 (under a tree), which subsequently decreased to 47.13°C at the same station following the greening intervention. It is noteworthy that the proposed greening of Street Str2, through the plantation of local palm trees Phoenix dactylifera, contributed significantly to enhancing thermal comfort (Fig. 10, Table 5).
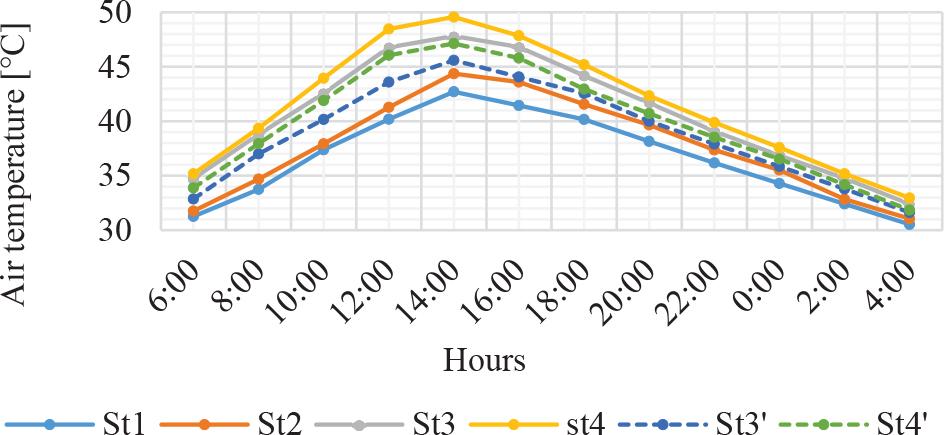
Comparison of the daily average air temperature in Streets Str1 and Str2: current versus proposed scenarios
Source: own work.
Comparison of the daily average air temperature for Streets Str1 and Str2
| Station | Hour | |||||||||||
|---|---|---|---|---|---|---|---|---|---|---|---|---|
| 6:00 | 8:00 | 10:00 | 12:00 | 14:00 | 16:00 | 18:00 | 20:00 | 22:00 | 0:00 | 2:00 | 4:00 | |
| St1 | 31.26 | 33.75 | 37.38 | 40.19 | 42.70 | 41.44 | 40.16 | 38.16 | 36.18 | 34.29 | 32.42 | 30.53 |
| St2 | 31.75 | 34.68 | 37.93 | 41.28 | 44.37 | 43.59 | 41.56 | 39.66 | 37.36 | 35.52 | 32.84 | 31.05 |
| St3 | 34.75 | 38.79 | 42.56 | 46.78 | 47.82 | 46.82 | 44.17 | 41.67 | 39.07 | 36.86 | 34.77 | 32.39 |
| st4 | 35.18 | 39.36 | 43.95 | 48.47 | 49.57 | 47.85 | 45.19 | 42.33 | 39.88 | 37.59 | 35.18 | 32.96 |
| St3′ | 32.86 | 37.01 | 40.16 | 43.59 | 45.59 | 44.07 | 42.55 | 40.00 | 37.91 | 35.85 | 33.78 | 31.62 |
| St4′ | 33.88 | 37.95 | 41.90 | 46.05 | 47.13 | 45.79 | 42.95 | 40.71 | 38.52 | 36.54 | 34.18 | 31.85 |
Source: own work.
When comparing the relative humidity levels of the current and proposed scenarios between Streets Str1 and Str2, we noticed the following (Fig. 11, Table 6):
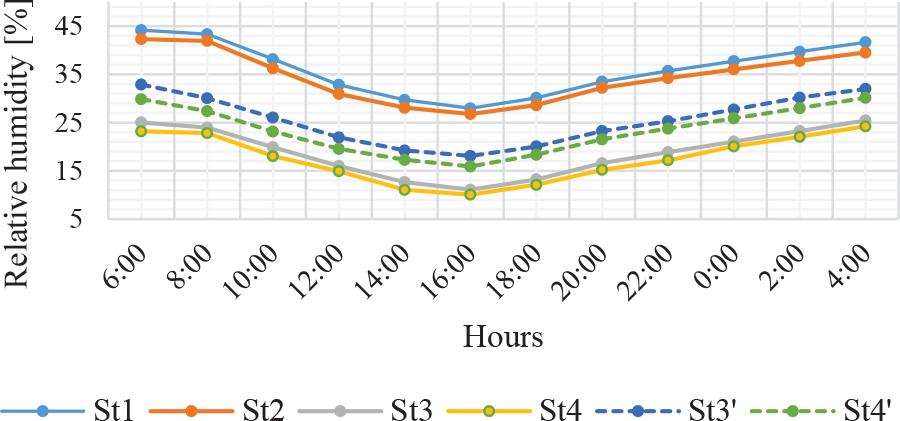
Comparison of the daily average relative humidity in Str1 and Str2: current versus proposed scenarios
Source: own work.
Comparison of the daily average relative humidity for Streets Str1 and Str2
| Station | Hour | |||||||||||
|---|---|---|---|---|---|---|---|---|---|---|---|---|
| 6:00 | 8:00 | 10:00 | 12:00 | 14:00 | 16:00 | 18:00 | 20:00 | 22:00 | 0:00 | 2:00 | 4:00 | |
| St1 | 44.16 | 43.34 | 38.17 | 32.84 | 29.71 | 27.97 | 30.12 | 33.50 | 35.72 | 37.74 | 39.70 | 41.66 |
| St2 | 42.30 | 41.95 | 36.26 | 30.94 | 28.08 | 26.77 | 28.62 | 32.21 | 34.23 | 36.04 | 37.79 | 39.54 |
| St3 | 25.04 | 23.95 | 19.89 | 15.99 | 12.65 | 11.09 | 13.22 | 16.59 | 18.88 | 21.07 | 23.25 | 25.44 |
| St4 | 23.18 | 22.82 | 18.06 | 14.91 | 11.05 | 10.06 | 12.11 | 15.19 | 17.18 | 20.07 | 22.05 | 24.23 |
| St3′ | 32.88 | 30.07 | 26.05 | 21.93 | 19.23 | 18.08 | 20.06 | 23.25 | 25.27 | 27.73 | 30.18 | 31.98 |
| St4′ | 29.87 | 27.39 | 23.16 | 19.55 | 17.28 | 15.90 | 18.34 | 21.54 | 23.75 | 25.88 | 28.00 | 30.13 |
Source: own work.
– In the current scenario, Str1 (St1 and St2) exhibits higher and more stable relative humidity levels throughout the day compared to Str2 (St3 and St4), with a maximum value of 44.16% recorded at 6:00 a.m. at Station St1, and a minimum value of 26.77% recorded at 4:00 p.m. at Station St2. In contrast, Str2 in its current condition experiences greater fluctuations and lower relative humidity levels, with the highest value of 25.44% observed at 4:00 a.m. at station St3 (located beneath a palm tree), while the lowest value of 10.06% was recorded at 4:00 p.m. at station St4 (beneath a tree).
– In the proposed scenario for Str2 (St3′ and St4′), relative humidity levels improved significantly compared to the current situation (St3 and St4). The maximum recorded value reached 32.88% at 6:00 a.m. at Station St3′, while the minimum value of 15.90% was observed at 4:00 p.m. at Station St4′. Thus, the proposed greening of the street resulted in clear improvements in relative humidity levels, making them more comparable to those observed in Str1.
When comparing the wind speed levels of the current and proposed scenarios between Streets Str1 and Str2, we noticed the following (Fig. 12, Table 7):
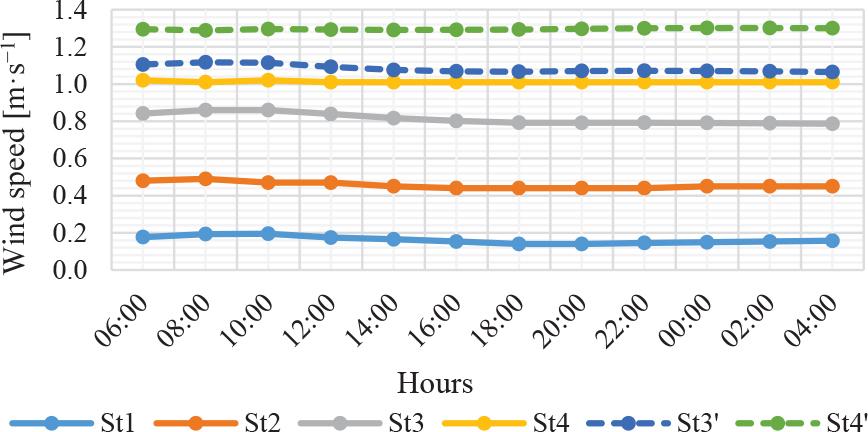
Comparison of the daily average wind speed in Streets Str1 and Str2: current versus proposed scenarios
Source: own work.
Comparison of the daily average wind speed for Streets Str1 and Str2
| Station | Hour | |||||||||||
|---|---|---|---|---|---|---|---|---|---|---|---|---|
| 6:00 | 8:00 | 10:00 | 12:00 | 14:00 | 16:00 | 18:00 | 20:00 | 22:00 | 0:00 | 2:00 | 4:00 | |
| St1 | 0.18 | 0.19 | 0.19 | 0.17 | 0.17 | 0.15 | 0.14 | 0.14 | 0.15 | 0.15 | 0.15 | 0.16 |
| St2 | 0.48 | 0.49 | 0.47 | 0.47 | 0.45 | 0.44 | 0.44 | 0.44 | 0.44 | 0.45 | 0.45 | 0.45 |
| St3 | 0.84 | 0.86 | 0.86 | 0.84 | 0.82 | 0.80 | 0.79 | 0.79 | 0.79 | 0.79 | 0.79 | 0.79 |
| St4 | 1.02 | 1.01 | 1.02 | 1.01 | 1.01 | 1.01 | 1.01 | 1.01 | 1.01 | 1.01 | 1.01 | 1.01 |
| St3′ | 1.10 | 1.12 | 1.11 | 1.09 | 1.08 | 1.07 | 1.07 | 1.07 | 1.07 | 1.07 | 1.07 | 1.06 |
| St4′ | 1.29 | 1.29 | 1.30 | 1.29 | 1.29 | 1.29 | 1.29 | 1.30 | 1.30 | 1.30 | 1.30 | 1.30 |
Source: own work.
– In the current scenario, Str1 (St1 and St2) exhibits relatively low wind speeds throughout the day, generally ranging from 0.14 to 0.49 m⸱s−1. In contrast, Str2 (St3 and St4) experiences higher wind speeds, with values ranging from approximately 0.79 m⸱s−1 to 1.12 m⸱s−1. These differences indicate that Str2, located within the collective housing fabric, is more exposed to wind compared to Str1, which is situated in the traditional individual residential fabric.
– In the proposed greening scenario for Str2 (St3′ and St4′), a slight increase in wind speed was observed, ranging from 1.06 to 1.30 m⸱s−1, compared to the current condition of the two streets. This improvement in airflow highlights the role of local palm trees in redirecting and stabilizing wind movement within contemporary urban fabrics, unlike the low wind conditions observed in Str1.
Overall, the analysis suggests that the proposed greening plan for Str2 could significantly enhance wind speeds in the area.
When comparing the daily average mean radiant temperature (MRT) of the current and proposed scenarios in Streets Str1 and Str2, we noticed the following (Fig. 13, Table 8):
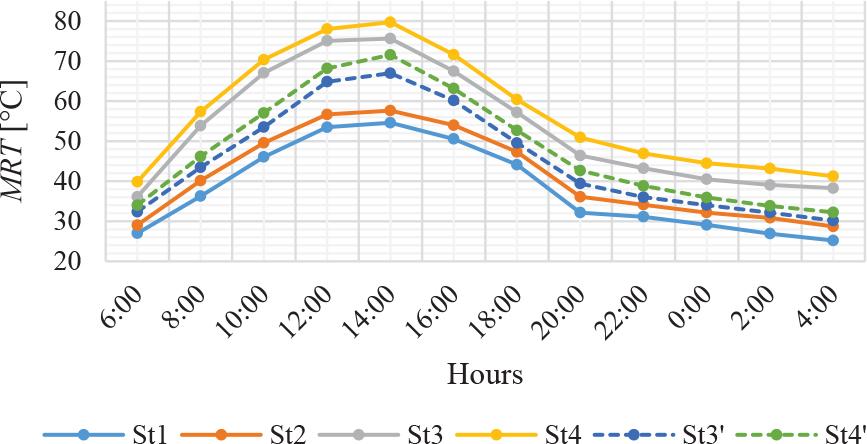
Comparison of the daily average mean radiant temperature (MRT) in Streets Str1 and Str2: current versus proposed scenarios
Source: own work.
Comparison of the daily average mean radiant temperature for Streets Str1 and Str2
| Station | Hour | |||||||||||
|---|---|---|---|---|---|---|---|---|---|---|---|---|
| 6:00 | 8:00 | 10:00 | 12:00 | 14:00 | 16:00 | 18:00 | 20:00 | 22:00 | 0:00 | 2:00 | 4:00 | |
| St1 | 27.01 | 36.28 | 46.07 | 53.48 | 54.61 | 50.56 | 44.12 | 32.15 | 31.13 | 29.09 | 26.91 | 25.20 |
| St2 | 29.04 | 40.14 | 49.57 | 56.68 | 57.62 | 54.01 | 47.30 | 36.11 | 34.12 | 32.16 | 30.86 | 28.70 |
| St3 | 36.11 | 53.85 | 67.03 | 75.05 | 75.62 | 67.49 | 57.18 | 46.42 | 43.23 | 40.49 | 39.07 | 38.26 |
| St4 | 39.85 | 57.36 | 70.33 | 77.99 | 79.71 | 71.61 | 60.40 | 50.94 | 46.93 | 44.49 | 43.15 | 41.25 |
| St3′ | 32.36 | 43.46 | 53.50 | 64.83 | 66.98 | 60.16 | 49.56 | 39.41 | 36.02 | 34.03 | 32.17 | 30.17 |
| St4′ | 34.00 | 46.19 | 57.05 | 68.16 | 71.55 | 63.15 | 52.68 | 42.67 | 38.84 | 35.92 | 33.85 | 32.24 |
Source: own work.
– In the current scenario, the average (MRT) of Str1 (St1 and St2) is consistently lower than that of Str2 (St3 and St4) throughout the day. Values for Str1 range from 25.20°C at 4:00 a.m. at Station St1 to 57.62°C at 2:00 p.m. at Station St2. In contrast, Str2 experiences greater fluctuations in MRT, with values ranging from approximately 36.11°C at 6:00 a.m. at Station St3 to 79.71°C at 2:00 p.m. at Station St4 during daytime hours.
– In the proposed greening scenario for Str2 (St3′ and St4′), there was a substantial reduction in average (MRT) compared to the current situation (St3 and St4). The difference between the minimum and maximum daily average values ranged from 5.94°C to 8.16°C during the day.
This analysis indicates that the proposed greening measures effectively reduced (MRT) in Street Str2. However, the thermal conditions in Str1 within the traditional individual residential fabric remained lower, despite not being subjected to a greening scenario, benefiting instead from the cooling effect of the surrounding local palm groves.
PET assessment revealed significant differences between the Street Str1, which is located in traditional individual residential fabric and the Street Str2 located in collective housing fabric. Street Str1 consistently maintains lower PET values throughout the day, with peak values at 14:00 reaching 60.7°C (St1) and 62.0°C (St2). In contrast, the current condition of Street Str2 exhibits higher thermal stress, with maximum PET values rising to 63.7°C (St3) and 64.9°C (St4). The measurement results of the current situation in both streets highlight the thermal resilience of traditional urban forms and the cooling effect of adjacent palm groves. This finding aligns with the conclusions of Abaas (2020) and Al-atrash and Al-ayyoub (2023), who emphasized the effectiveness of shading and urban form in reducing radiative exchange in hot and arid regions.
In the proposed simulation scenario of planting native palm trees along Street Str2, a clear improvement was observed, with PET values decreasing by 1.6°C (St3′) and 1.8°C (St4′) during solar peak hours (14:00). The cooling effect confirms the findings of Sayad et al. (2021) and Necira et al. (2024), who reported similar reductions in PET and UTCI following the implementation of linear afforestation in arid streets. Despite these improvements, PET values in all scenarios remain above 60°C in the afternoon (Fig. 14, Table 9). This suggests that while native palms effectively narrow the thermal performance gap between contemporary and traditional urban fabrics, additional mitigation strategies are required to achieve acceptable comfort levels in hot and dry climates. Such strategies may include increasing canopy density or integrating other tree species alongside palm trees (Ridha, 2017; Biqaraz et al., 2019).
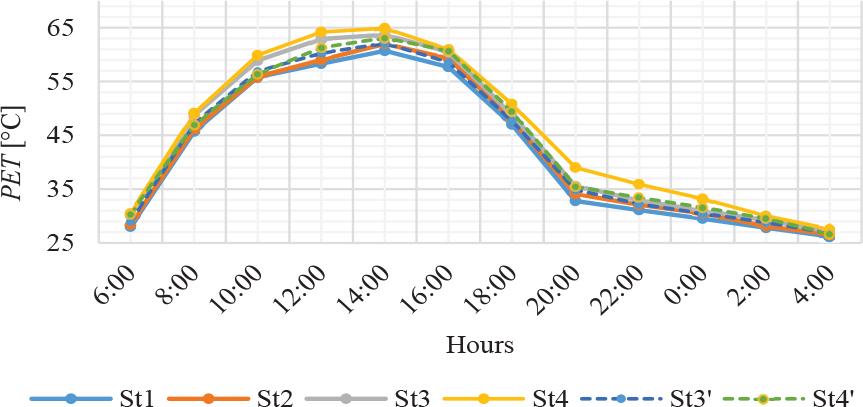
Comparison of the daily average physiological equivalent temperature (PET) in Streets Str1 and Str2: current versus proposed scenarios
Source: own work.
Comparison of the daily average physiological equivalent temperature for Streets Str1 and Str2
| Station | Hour | |||||||||||
|---|---|---|---|---|---|---|---|---|---|---|---|---|
| 6:00 | 8:00 | 10:00 | 12:00 | 14:00 | 16:00 | 18:00 | 20:00 | 22:00 | 0:00 | 2:00 | 4:00 | |
| St1 | 28.00 | 45.70 | 55.80 | 58.30 | 60.70 | 57.70 | 47.00 | 32.80 | 31.10 | 29.50 | 27.80 | 26.20 |
| St2 | 28.40 | 46.20 | 55.90 | 59.00 | 62.00 | 59.30 | 47.90 | 34.10 | 32.10 | 30.50 | 28.10 | 26.60 |
| St3 | 30.30 | 48.70 | 58.90 | 62.90 | 63.70 | 60.50 | 48.80 | 35.60 | 32.90 | 31.00 | 29.20 | 27.10 |
| St4 | 30.60 | 49.10 | 59.90 | 64.20 | 64.90 | 61.00 | 50.80 | 39.00 | 35.90 | 33.20 | 30.00 | 27.60 |
| St3′ | 29.00 | 47.20 | 56.90 | 60.30 | 62.10 | 58.60 | 47.70 | 34.90 | 32.20 | 30.50 | 28.80 | 26.80 |
| St4′ | 30.40 | 47.00 | 56.40 | 61.30 | 63.10 | 60.70 | 49.40 | 35.50 | 33.40 | 31.60 | 29.50 | 26.70 |
Source: own work.
When comparing the daily average new standard effective temperature (SET*) between the current and proposed scenarios in Streets Str1 and Str2, we observed the following (Fig. 15, Table 10):
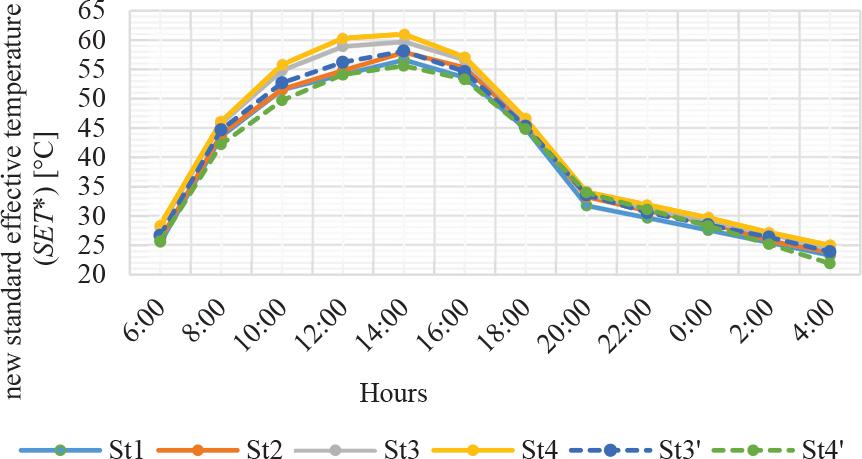
Comparison of the daily average new standard effective temperature in Streets Str1 and Str2: current versus proposed scenarios
Source: own work.
Comparison of the daily average new standard effective temperature for Streets Str1 and Str2
| Station | Hour | |||||||||||
|---|---|---|---|---|---|---|---|---|---|---|---|---|
| 6:00 | 8:00 | 10:00 | 12:00 | 14:00 | 16:00 | 18:00 | 20:00 | 22:00 | 0:00 | 2:00 | 4:00 | |
| St1 | 25.50 | 43.60 | 51.50 | 54.10 | 56.60 | 53.60 | 44.80 | 31.70 | 29.60 | 27.50 | 25.40 | 23.20 |
| St2 | 26.00 | 44.00 | 51.60 | 54.80 | 57.90 | 55.30 | 45.60 | 33.20 | 30.80 | 28.80 | 25.70 | 23.70 |
| St3 | 28.2 | 45.8 | 54.8 | 58.9 | 59.7 | 56.6 | 46.2 | 33.7 | 31.2 | 29 | 26.9 | 24.30 |
| St4 | 28.5 | 46.1 | 55.8 | 60.3 | 61.00 | 57.1 | 46.6 | 34.1 | 31.9 | 29.7 | 27.2 | 25.00 |
| St3′ | 26.7 | 44.7 | 52.7 | 56.2 | 58.1 | 54.6 | 45.3 | 33.6 | 30.6 | 28.5 | 26.4 | 23.9 |
| St4′ | 25.7 | 42.2 | 49.7 | 54.1 | 55.6 | 53.3 | 44.8 | 34 | 31.1 | 28.3 | 25.2 | 21.9 |
Source: own work.
– In the current situation, the results showed clear differences between the two streets: Str1 in traditional individual residential fabric (S1), and Str2 in collective housing fabric (S2). We note that Street Str1, surrounded by palm groves, demonstrated better thermal performance than Street Str2. At peak heat hour (2:00 p.m.), SET* values recorded at Stations St1 and St2 were 56.6°C and 57.9°C, respectively, while the SET* measurements at Street Str2 were higher, 59.7°C at Station St3 and 61.0°C at Station St4. This variation in measurements underscores the thermal resilience and adaptability of the traditional urban fabric in hot, dry climates, as confirmed by a study of Ridha (2017), and Khalil and Wahhab (2020).
– In the proposed simulation scenario of planting native palm trees (Phoenix dactylifera) along Street Str2, we observed a clear improvement and a decrease in SET* values: 1.6°C at Street St3′ (58.l°C) and 5.4°C at Street St4′ (55.6°C) at peak solar hour (14:00). This improvement highlights the lack of natural shading before the afforestation process.
The results are consistent with numerous previous studies conducted in hot and dry regions, which demonstrate that vegetation cover, particularly local palm trees, enhances the local climate by intercepting solar radiation (providing shading) and through transpiration.
Therefore, incorporating native palm trees into contemporary street design emerges as a vital strategy to bridge the thermal performance gap between contemporary and traditional urban fabrics in arid climates.
This study concluded that planting palm trees along urban streets constitutes a climatically appropriate strategy and a sustainable solution for enhancing outdoor thermal comfort in hot and arid environments. The research employed an integrated methodology combining field measurements with computational simulations using Envi-Met and Rayman, thereby providing a deeper understanding of the influence of local vegetation on urban climatic performance.
A comparative analysis was conducted between two streets representing distinct urban fabrics. The first street, part of a traditional individual residential fabric, had not undergone tree planting but was surrounded by local palm groves. In contrast, the second street, belonging to a collective housing fabric designed for collective housing, was subjected to a palm tree planting proposal. This comparison revealed significant differences in climatic performance between the two cases.
The results indicate that Str1 demonstrated a remarkable advantage in thermal comfort levels both before and after the palm tree planting plan proposed for Str2. This superiority is attributed to the surrounding palm groves, which enhanced street-level shading, in addition to the influence of building design and street width. In contrast, the proposed palm tree planting along Str2 revealed a significant improvement across all thermal comfort indicators compared to pre-planting measurements. Notably, reductions were recorded in all measured parameters, including the PET and the MRT, accompanied by an improvement in relative humidity.
The findings confirmed the effectiveness of selecting local palm trees and their strong adaptability to hot and arid climatic conditions, particularly in regions suffering from water scarcity. This demonstrates the importance of carefully choosing appropriate tree species for street planting to maximize cooling efficiency and sustainability, in contrast to deciduous trees that may negatively affect thermal conditions during the winter season.
Methodologically, the results of this study contribute to validating the field measurement approach by comparing it with digital simulations, thereby strengthening the alignment between empirical data collection and computational modeling for assessing and proposing future design scenarios that support afforestation projects in hot and arid climates. Furthermore, the findings call upon local authorities and decision-makers to prioritize street planting programs using local palm trees, ensuring appropriate spacing and adequate maintenance to enhance outdoor thermal comfort. Urban planning and building regulations for new projects should also stipulate a minimum tree planting density, with the possibility of verifying thermal comfort performance criteria through simulation tools such as Envi-Met.
This study examines two streets with contrasting characteristics, providing an opportunity to explore quantitative improvements within specific contexts. Nevertheless, conducting a broader spatial analysis that encompasses multiple neighborhoods with diverse architectural forms would enhance the generalizability of the findings and strengthen their reliability for applications in sustainable urban planning.