
Cold-formed steel (CFS) is shaped at ambient temperature through bending and rolling, unlike hot-rolled steel (HRS), which is formed at high temperatures. This process enables more precise shaping and sizing, making CFS ideal for construction applications where accuracy and consistency are essential (Dubina et al., 2012; Yu et al., 2019).
The benefits of cold-formed steel (CFS) in construction include its versatility, durability, and sustainability. CFS structures are lightweight yet remarkably strong, providing greater design flexibility and enabling the creation of complex architectural forms. Moreover, CFS is highly resistant to corrosion and requires minimal maintenance, making it a durable and eco-friendly building material. Its recyclability further contributes to sustainability, reducing waste and lowering the overall carbon footprint of construction projects (Johnston et al., 2018; Harini et al., 2020). Overall, the advantages of using cold-formed steel in construction are numerous, making it a popular choice among builders and architects.
However, there are some disadvantages; one major drawback is its higher initial cost compared to other building materials, such as wood or concrete. Additionally, cold-formed steel is more susceptible to buckling due to its thinness. Based on EN 1993-1-1 (European Committee for Standardization [CEN], 2005), CFS is categorized as a Class 4 section, due to a high width-to-thickness ratio.
A connection is part of a structure that is critical in ensuring stability and structural integrity. Proper connections can also help distribute loads evenly, prevent structural failure, and improve the overall performance of the construction project. Research on CFS connections has focused on apex and eaves (Pouladi et al., 2019; Chen et al., 2021; Wang et al., 2021; El-Hadary et al., 2022), trusses (Dar et al., 2020; Fitrah & Nofriyandi, 2020; Song et al., 2020; Bondok et al., 2021), and beam-column structures (Ye et al., 2019; Aminuddin et al., 2020; Firdaus et al., 2020a; Firdaus et al., 2020b; Seok et al., 2022). This recent study is limited to the beam--column connection.
Using finite element analysis, Seok et al. (2022) studied altering the through--plates to improve their usefulness in field applications. The numerical simulation results demonstrated that the proposed connection has an equivalent structural performance to the original design. For practicality, attaching a flange plate perpendicular to the diagonal edge is preferable to prevent buckling of the through-plate.
Research conducted by Ye et al. (2019) focused on an in-depth examination of the improvement of seismic behavior in beam-column bolted connections. Their research aimed to identify enhanced design solutions for CFS frames in connection areas susceptible to earthquakes through friction-slip mechanisms. Research demonstrates that the bolted friction-slip mechanism could significantly improve (by up to 200%) the flexibility, ability to dissipate energy, and damping coefficient of the connections, particularly for Class 3 and Class 4 CFS elements. The findings are used to identify optimal design configurations for enhancing the seismic responsiveness of the beam-column connections during intense earthquakes. While Class 3 and Class 4 cross-sections do not meet the American Institute of Steel Construction specifications for intermediate and special moment frames, the proposed connection mechanism has demonstrated effectiveness in regions with high seismic activity.
This paper presents an experimental study using a sub-assemblage frame test method to evaluate rectangular and haunched gusset plates. A top-seat angle was added to enhance connection resistance. This application used M12 bolts with a grade of 8.8, suitable for light steel profiles, as fasteners.
The flowchart of the current study, as shown in Figure 1, begins with preparation, where materials and equipment are organized. Next, assembling the specimens involves constructing the cold-formed steel beam-column connections according to the sub-assemblage frame method. Measurement instruments, such as load cells and displacement transducers, are then set up to monitor specimen behavior. The study then examines failure modes to identify structural failure. Finally, load-deflection results are analyzed to assess the connection’s performance under a monotonic load.
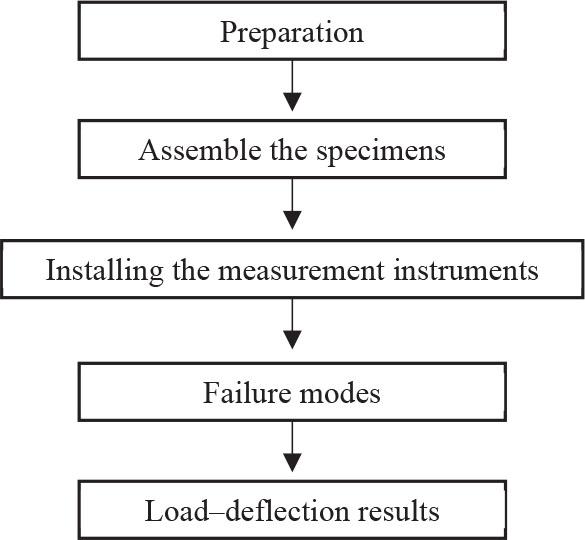
Flowchart of the current study
Source: own work.
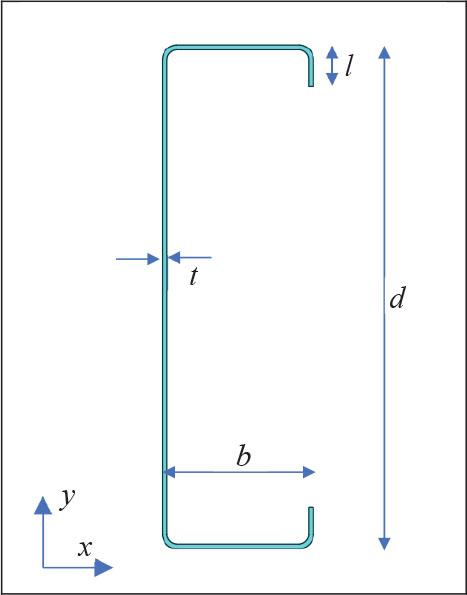
The arrangement of CFS is back-to-back with double-lipped channel sections. The column section utilized C300, while C200 and C250 were used for the beam section. Each member was designed with grade 450 N⋅mm−2, as specified in EN 1993-1-3 (CEN, 2006). The dimensions of the CFS sections are shown in Table 1 and Figure 2.
Cross-section of cold-formed steel
| Cross-section | Depth (d) | Thickness (t) | Flange width (b) | Lip (l) |
|---|---|---|---|---|
| mm | ||||
| C20024 | 200 | 2.4 | 75 | 16 |
| C25024 | 250 | 2.4 | 75 | 20 |
| C30024 | 300 | 2.4 | 100 | 25 |
Source: own work.
Cold-formed steel element
Source: own work.
Three distinct types of connections were employed: a rectangular gusset plate, a rectangular gusset plate with a flange cleat, and a haunched gusset plate. The gusset plate and flange cleat were fabricated from hot-rolled steel to connect the beam and column (Fig. 3, Table 2). Table 2 indicates that the abbreviation SAR denotes a sub-assemblage frame test for a rectangular gusset plate; SARFC signifies a sub-assemblage frame test with a rectangular gusset plate and flange cleat; and SAH represents a sub-assemblage frame test for a haunched gusset plate. Presented here are a few essential terms, as follows: tg denotes the thickness of the gusset plate, hg indicates the height of the gusset plate, e1 represents the horizontal distance of the bolt, e2 symbolizes the vertical distance of the bolt, p1 refers to the horizontal spacing of the bolt, p2 relates to the vertical spacing of the bolt, and p3 depicts the horizontal spacing of the bolt on both the column and beam.
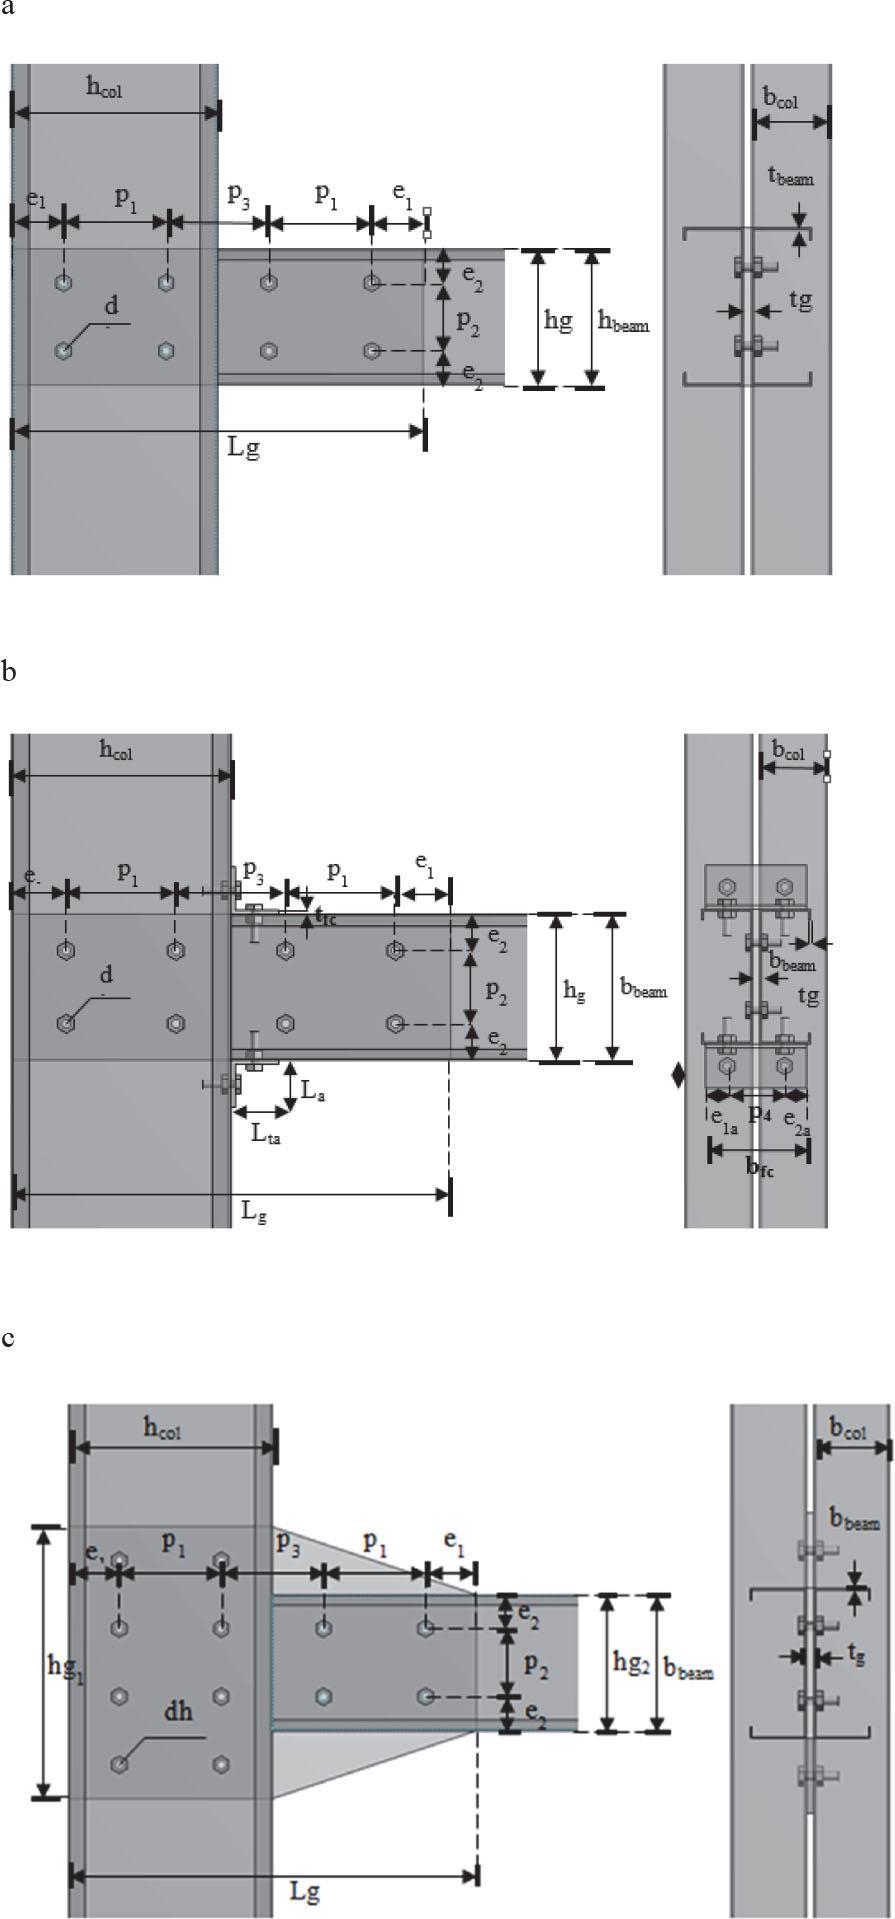
Configuration of beam-column connections: (a) rectangular gusset plate, (b) rectangular gusset plate with a top-seat angle, (c) haunched gusset plate
Source: own work.
Specimen configuration details
| Specimen | Beam | Column | Flange cleat | Connection details [mm] | |||||||
|---|---|---|---|---|---|---|---|---|---|---|---|
| tg | hg | Lg | e1 | e2 | p1 | p2 | p3 | ||||
| SAR-200 | C20024 | C30024 | – | 10 | 200 | 600 | 75 | 50 | 150 | 100 | 150 |
| SAR-250 | C25024 | C30024 | – | 10 | 250 | 600 | 75 | 50 | 150 | 150 | 150 |
| SARFC-200 | C20024 | C30024 | L 65 × 65 × 160 | 10 | 200 | 600 | 75 | 50 | 150 | 100 | 150 |
| SARFC-250 | C25024 | C30024 | L 65 × 65 × 160 | 10 | 250 | 600 | 75 | 50 | 150 | 150 | 150 |
| SAH-200 | C20024 | C30024 | – | 10 | 400 | 600 | 75 | 50 | 150 | 100 | 150 |
| SAH-250 | C25024 | C30024 | – | 10 | 550 | 600 | 75 | 50 | 150 | 150 | 150 |
Source: own work.
The dimensions of the flange cleat are shown in Figure 4 and Table 3. tfc stands for the thickness of the flange cleat, and rfc for the corner radius of the flange cleat. la indicates the length of the leg, lta represents the length of the top leg, e1a refers to the horizontal edge spacing of the bolt, e2a represents the vertical edge spacing, and bfc shows the width of the flange cleat.
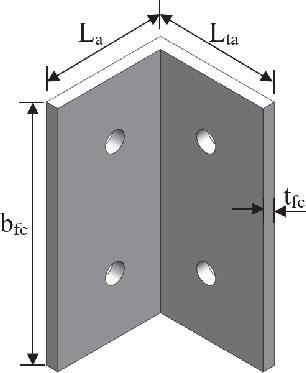
Flange cleat dimensions
Source: own work.
Flange cleat connection details
| Specimens | Beam | Column | Connection details [mm] | |||||||
|---|---|---|---|---|---|---|---|---|---|---|
| tfc | rfc | La | Lta | e1a | e2a | p2 | bfc | |||
| SARFC-200 | C20024 | C30024 | 6 | 5 | 65 | 65 | 32.5 | 32.5 | 85 | 160 |
| SARFC-250 | C25024 | 6 | 5 | 65 | 65 | 32.5 | 32.5 | 85 | 160 | |
Source: own work.
The span in this study was 4,000 mm, a typical construction dimension. Six samples were tested, each containing two proposed specimens. The arrangement of the sub-assemblage frame test specimen within the Magnus frame is shown, along with the precise locations of the load cell and spreader beam (Fig. 5). The Magnus frames were organized according to the specimen’s structural configuration. A pump-equipped hydraulic jack applied the load, with a load cell positioned at the center, and the spreader beam placed at two points separated by a two-meter distance. The distance of the spreader beam is based on a quarter of the length of the beam span to ensure the bending condition of the beam. The load was incrementally applied to a value between 0.2 and 0.5 kN using a hydraulic jack.
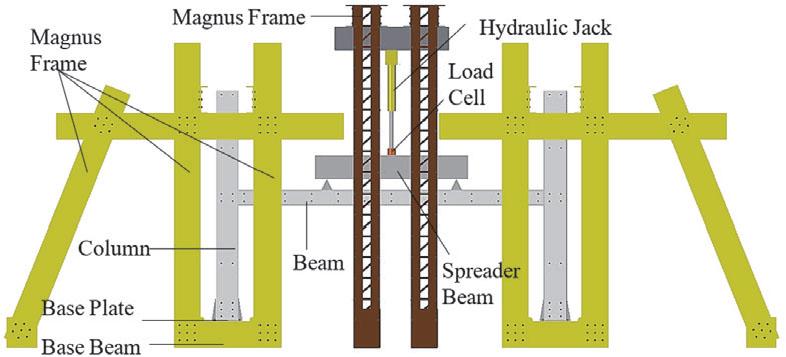
Schematic diagram of the sub-assemblage frame test and boundary conditions
Source: own work.
The sub-assemblage tests feature full-scale construction with a connecting beam spanning two columns positioned 4,000 mm apart. The gusset-plate connection is placed 1,500 mm from the column center, with the column height measuring 3,000 mm. The beam dimensions are categorized into two sizes: C200 and C250. The columns, on the other hand, have a standard section dimension of C300 with a grade of 450 N⋅mm−2, according to EN 1993-1-3 (CEN, 2006) specifications.
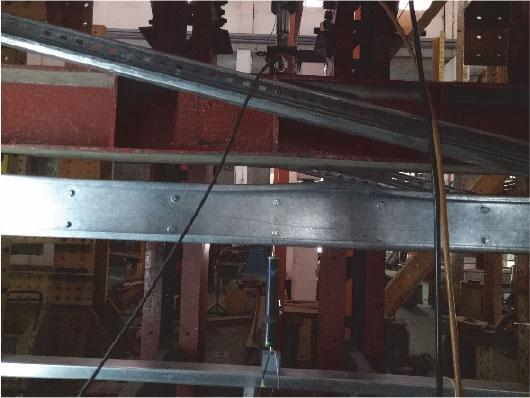
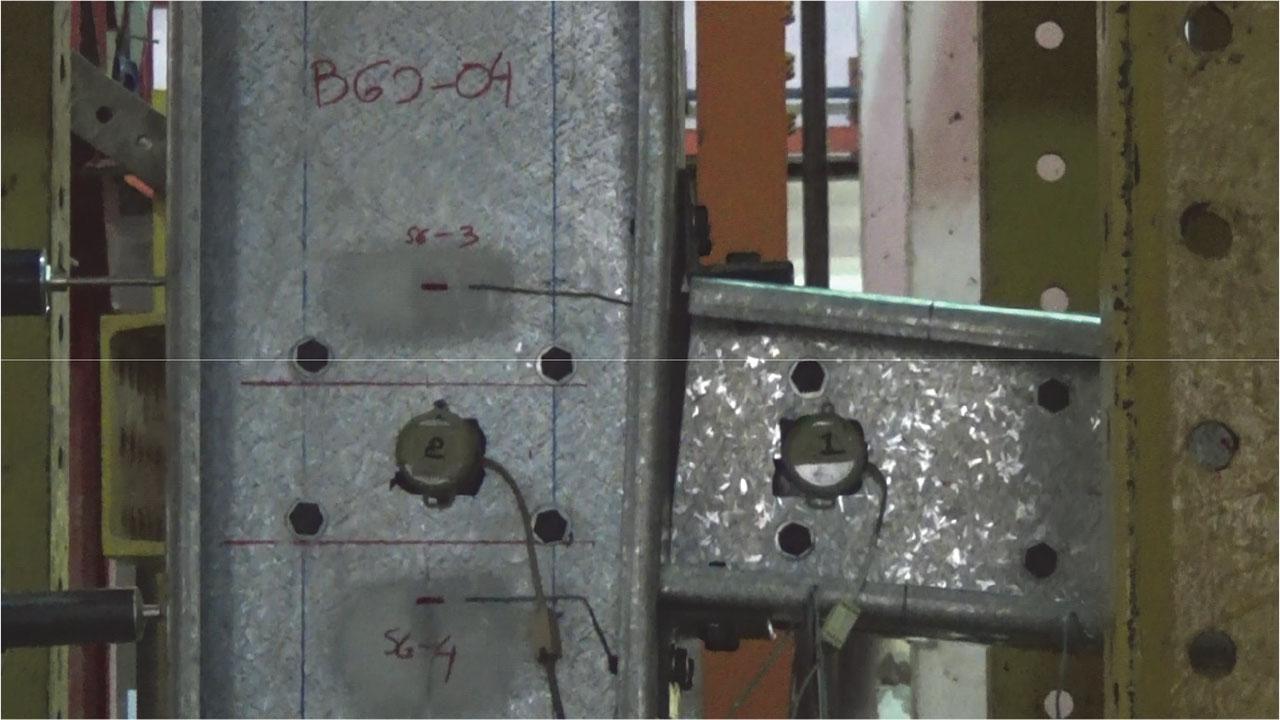
Eleven LVDT units are employed, with LVDTs 1‒3 positioned at the beam’s midpoint, precisely where the highest moment occurs. LVDTs 8‒11 are mounted horizontally on both web columns, while LVDTs 4‒7 are arranged to capture accurate vertical deformation (Fig. 6).
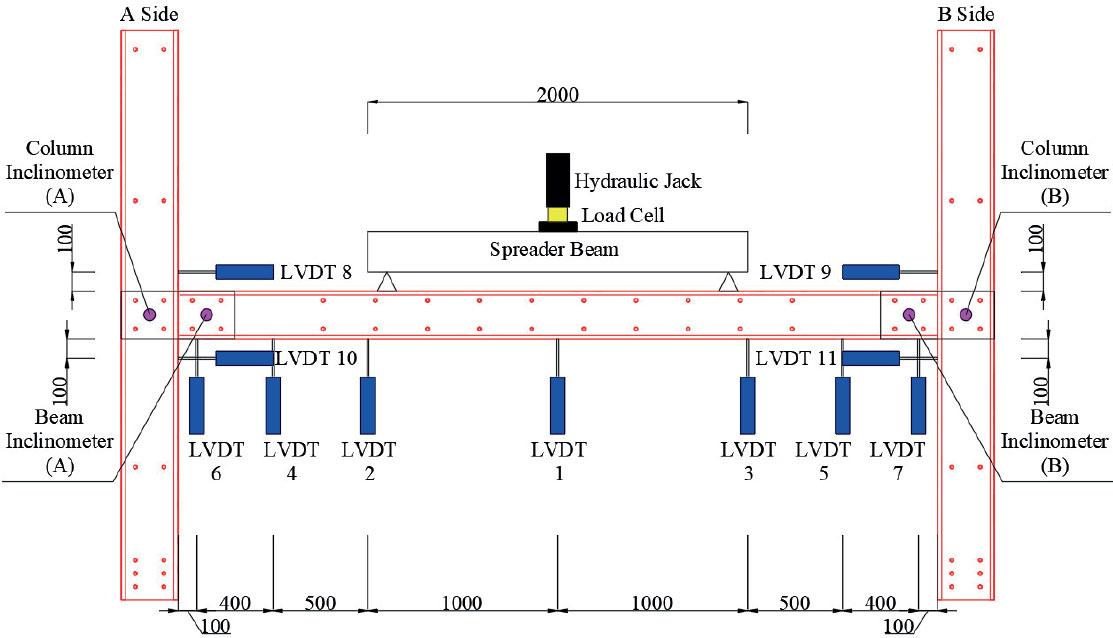
Instrument position on the specimen
Source: own work.
The test concluded upon observing either a visible failure mode or a sudden and significant displacement increase. The examination identified the failure mechanisms, including buckling at the column flange and substantial rotation of the connection due to bearing failure at the bolt hole. Additionally, thorough visual monitoring was carried out during all examinations, encompassing visual and physical inspections and video documentation for animation. Photographs were taken of each significant item, location, and incident.
A monotonic load distributed at two points was applied to the beam (Fig. 7). The SAR-200 failure mechanism appears to occur in the compression zone of both the column flange and the bottom beam flange (Fig. 8). This is due to the bottom of the beam flange pushing toward the face of the column flange.
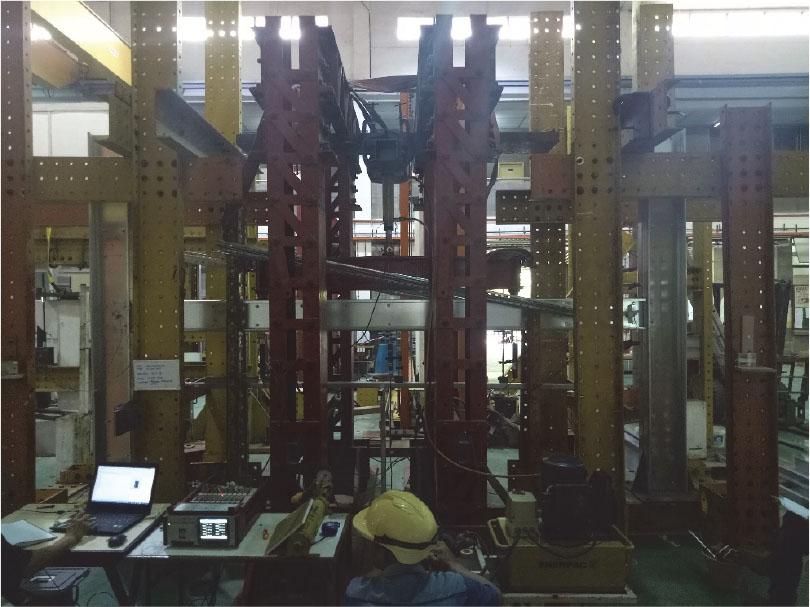
Full-scale test using the sub-assemblage frame test method
Source: own work.
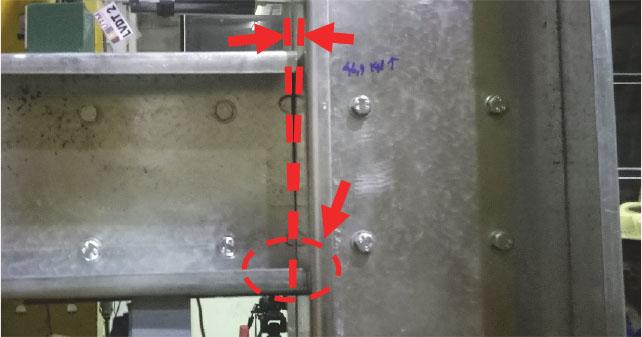
Deformation in the SAR-200 specimen
Source: own work.
The failure process of bending the web beam under the applied load occurred (Fig. 9). Lateral-torsional buckling of the beam caused crushing on the top flange and web. The midspan failure was due to twisting induced by this buckling.
Failure on the beam’s top flange
Source: Own work
The failure mode occurred because the top flange was the most vulnerable component (Fig. 10). The test ended due to lateral-torsional buckling, which led to a reduction in the applied load. The flange deformation occurred with compression observed at both the top and bottom due to the load applied to the beam (Fig. 11).
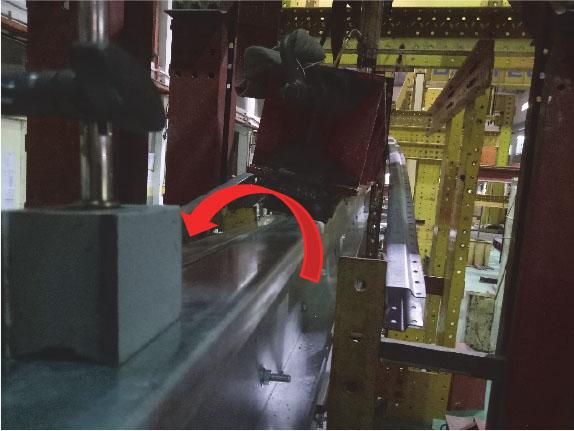
Lateral-torsional buckling of the beam
Source: own work.
Crushing failure on the beam’s top flange
Source: own work.
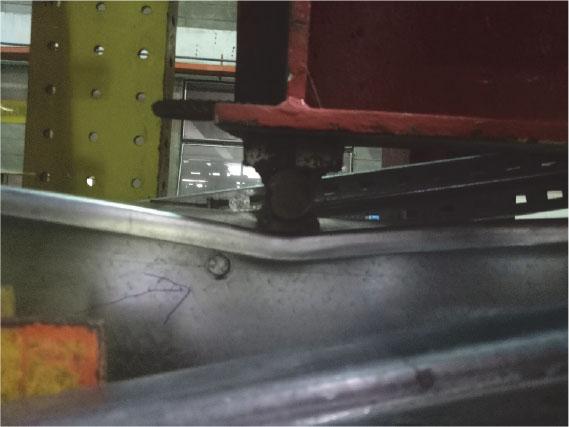
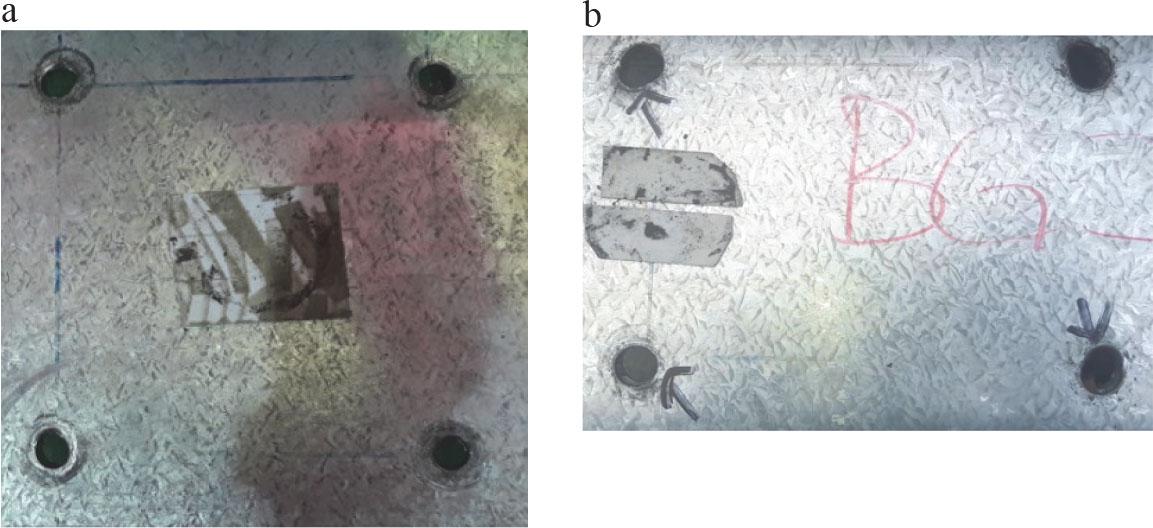
The bearing failure modes occurred on the joint for SAR specimens (Fig. 12). The failure occurred due to the thinness of the CFS section on both the beam and column.
Typical failure modes of SAR specimens on (a) column and (b) beam
Source: own work.
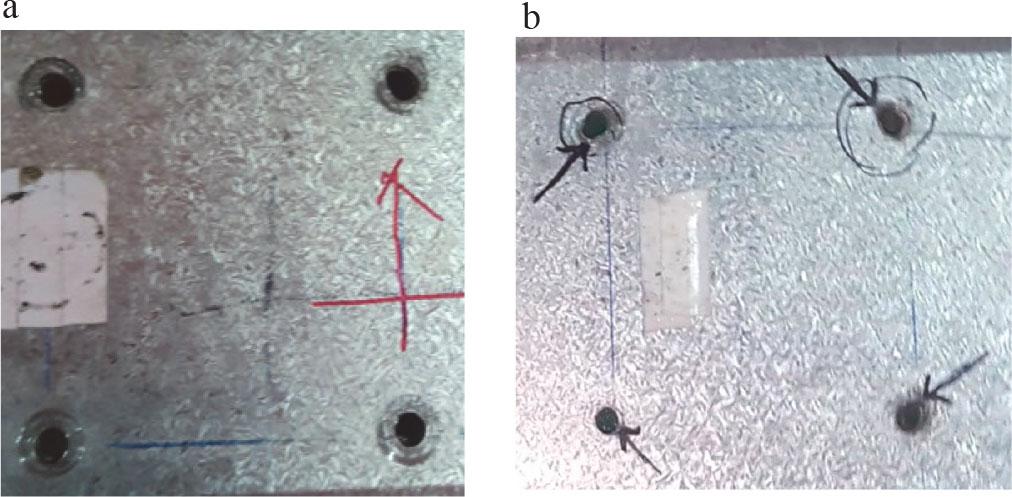
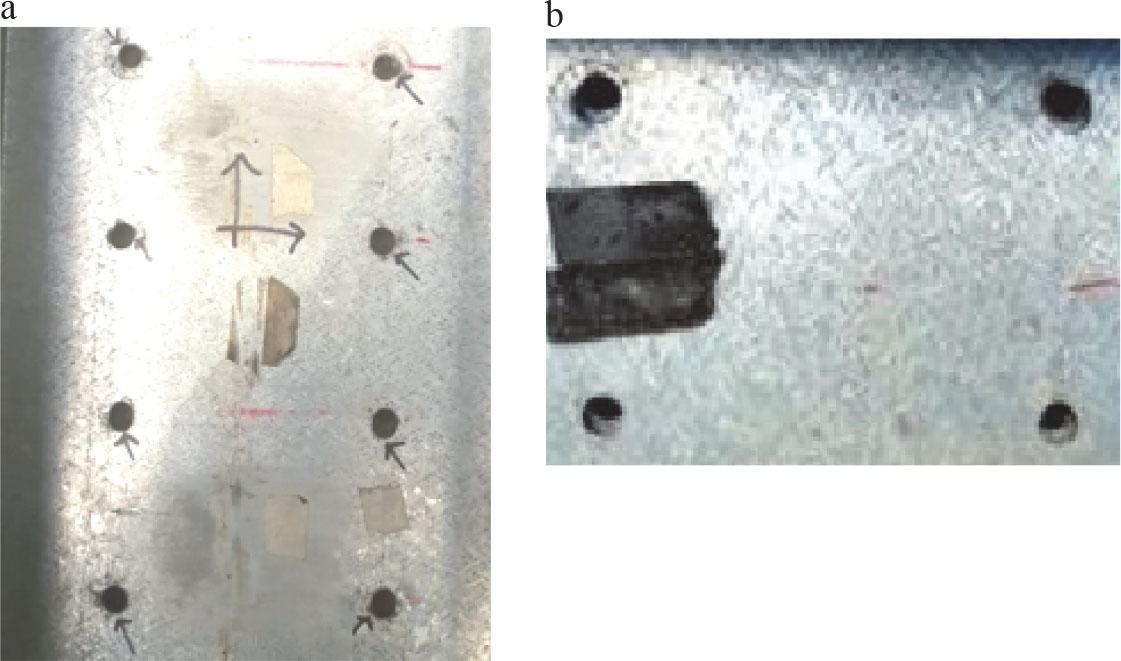
For SARFC specimens, bearing failure also occurs on the beam and column. The bearing failure is shown in Figure 13. The bearing failure occurred due to the thinness of the CFS section.
Typical bearing failure modes of SARFC specimens on (a) column and (b) beam
Source: own work.
Failure of the flange cleat was observed on SARFC specimens (Fig. 14). The bending of the column flange (Fig. 14) is due to the tensile force occurring on the bolts between the flange cleat and the column. In the compression zone, the buckling of the flange-cleat occurs. The failure indicated that the compression zone sustained greater damage to the flange cleat.
Typical failure modes of SARFC specimens on the joint
Source: own work.
The bearing failure mechanisms appeared on the joint for SAH specimens (Fig. 15). The thinness of the CFS section in both the beam and column led to insufficient load-bearing capacity, which ultimately resulted in the observed failures.
Typical failure modes of HG specimens on the joint
Source: own work.
The experiment data were recorded in the data logger. The load was analyzed concerning deflection to establish the relationship between load and beam resistance. Graphs were generated to visualize this correlation between load and deflection.
The beam’s deflection was measured with LVDTs positioned to determine the maximum deflection. Ensuring the load is at the deflection limit under the service limit state is crucial. Enhanced connection rigidity reduces beam bending. The load-deflection relationship was analyzed at the midpoint of the specimen, specifically at the position of LVDT-1. The maximum allowable deflection at the beam’s midpoint is specified by Eurocode 3 (category: beams carrying plaster or other brittle finishing):
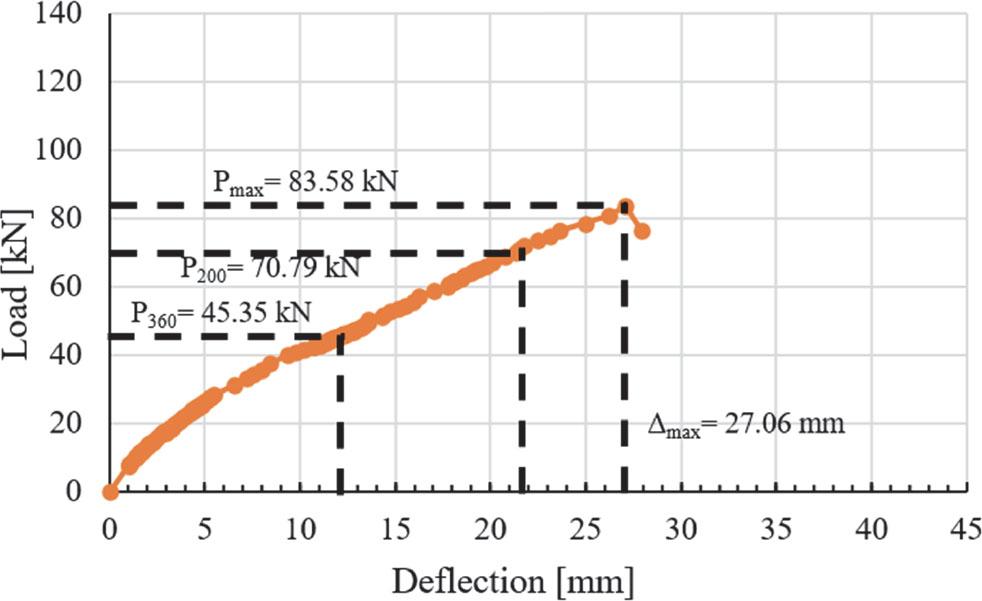
The load for allowed deflection is obtained from the test using the acceptable deflection formula. P200 denotes the load corresponding to a deflection of L/200, whereas P360 indicates the load at a deflection of L/360. The graphs illustrate the correlation between load and deflection for the SAR-200 and SAR-250 models (Figs. 16 and 17). The SAR-200 maintains a maximum load of 68.82 kN and demonstrates a maximum deflection of 26.19 mm. The maximum allowable load for P200 is 59.04 kN, but for P360 it is 34.21 kN.
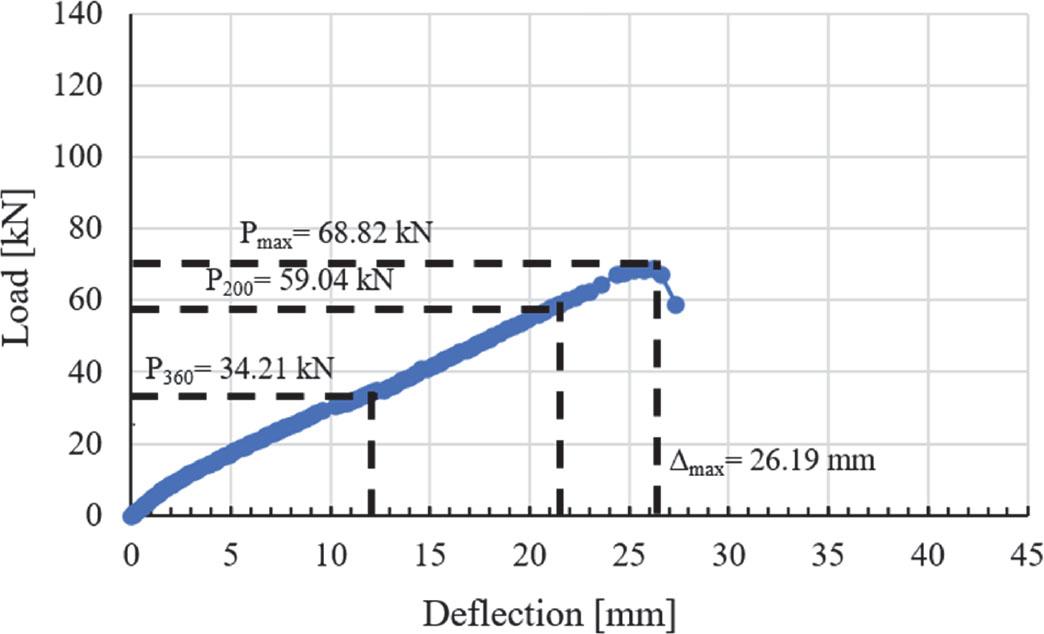
Load-deflection relation curve for SAR-200
Source: own work.
Load-deflection relation curve for SAR-250
Source: own work.
Figure 16 illustrates the load–deflection relationship for SAR-250. The maximum load, denoted as Pmax, is 83.58 kN, while the maximum deflection is recorded as 27.06 mm. The maximum allowable load for P200 is 70.79 kN, whereas for P360 it is 45.35 kN.
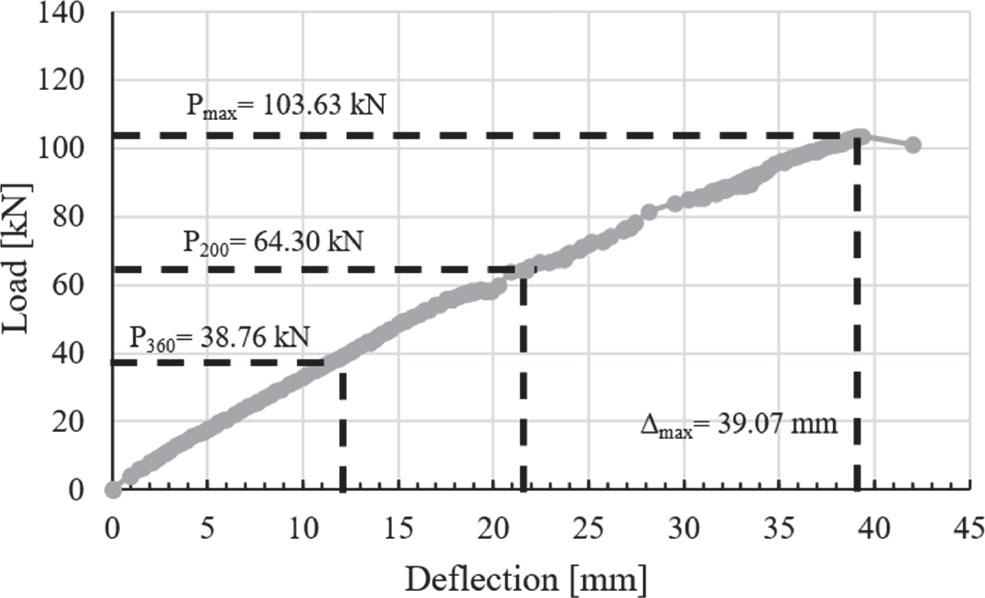
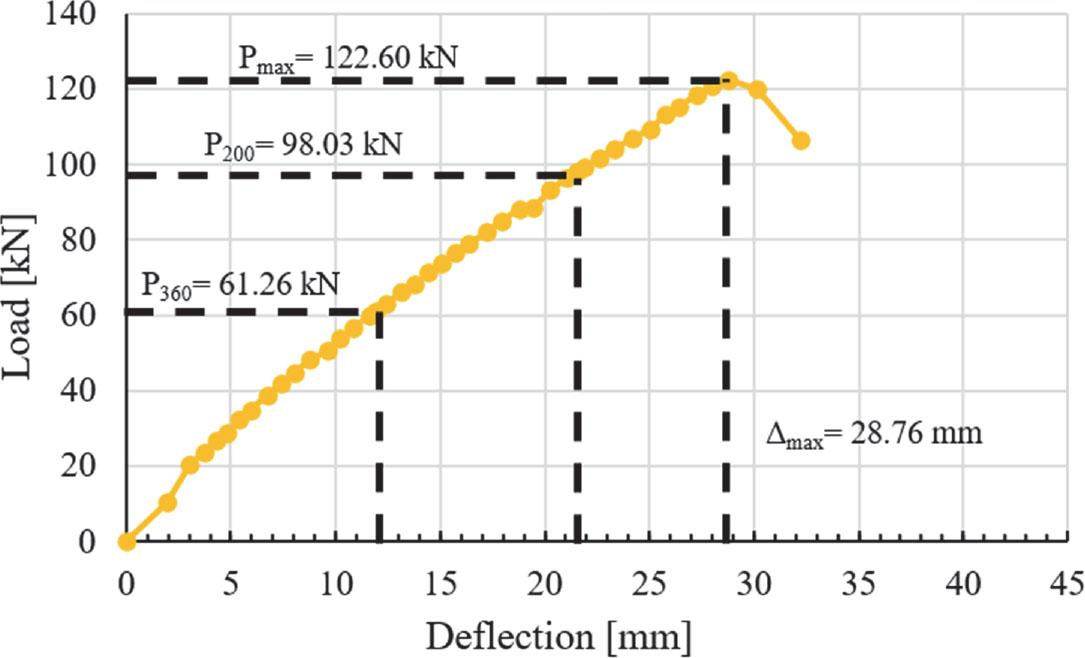
The SARFC-200 accommodates a maximum load of 103.63 kN with a deflection of 39.07 mm (Fig. 18). The maximum load for P200 is 64.30 kN, while P360 has a maximum load of 38.76 kN. The load-deflection graph of SARFC-250 indicates a Pmax of 122.60 kN and a maximum deflection of 28.76 mm (Fig. 19). The allowable load limit for P200 is 98.03 kN, whereas for P360 it is 61.26 kN.
Load-deflection relation curve for SARFC-200
Source: own work.
Load-deflection relation curve for SARFC-250
Source: own work.
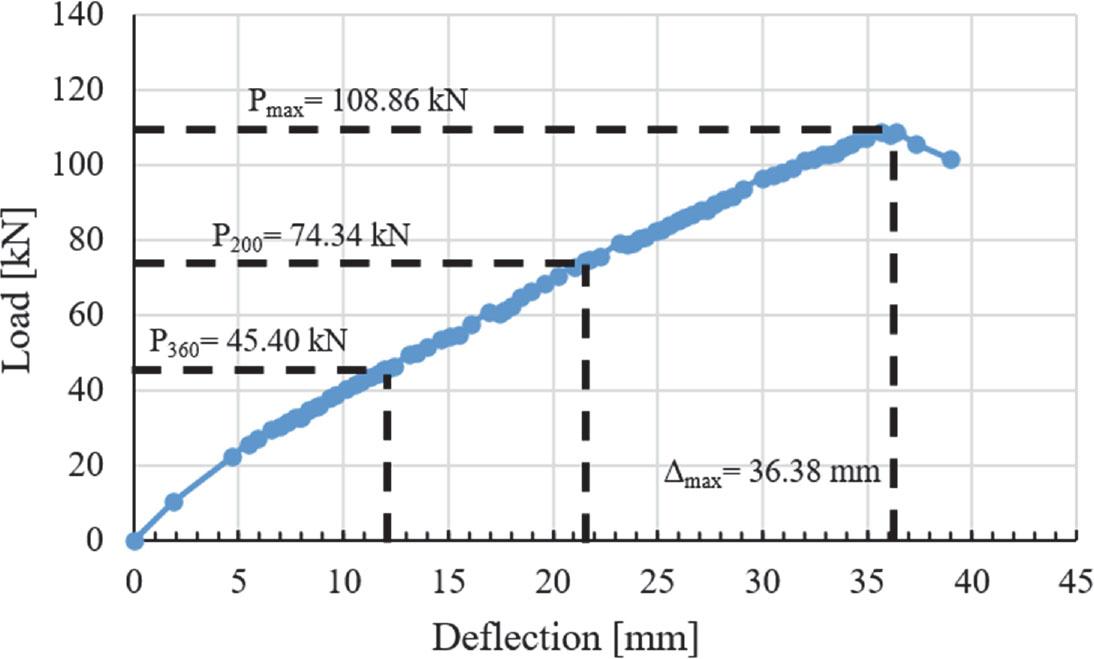
The SAH-200 accommodates a maximum load of 108.86 kN with a deflection of 36.38 mm (Fig. 20). The maximum load for P200 is 74.34 kN, while P360 has a restriction of 45.40 kN. The load-deflection graph of SAH-250 exhibits a maximum load (Pmax) of 124.73 kN and a maximum deflection of 25.78 mm (Fig. 21). The permissible load limit for P200 is 112.51 kN, whereas for P360 it is 68.64 kN.
Load-deflection relation curve for SAH-200
Source: own work.
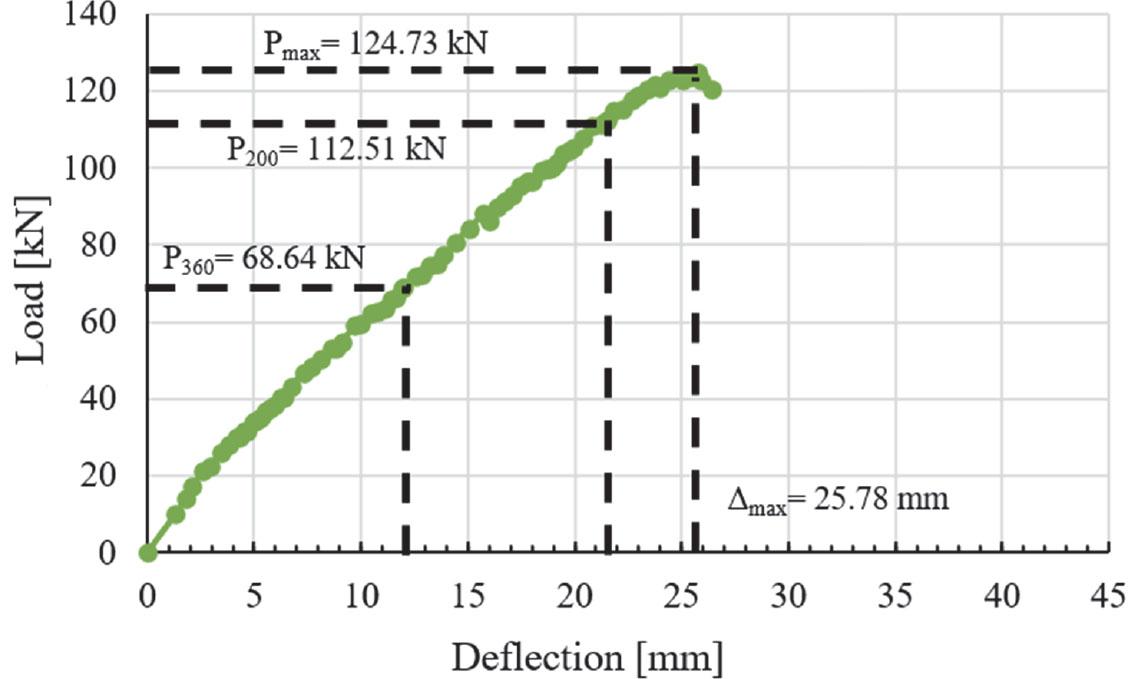
Load-deflection relation curve for SAH-250
Source: own work.
The SAH-250 specimen has the highest maximum load (Pmax), while the SAR-200 specimen reveals the lowest (Table 4). SAR and SARFC connections possess a decreased load capacity relative to SAH, related to the gusset plate shape, which inhibits excessive beam deflection and results in more resilient connections. SAH-200 has a maximum load that is 55.03% more than that of SAR-200 and 6.94% higher than SARFC-200. SAH-250 has a maximum load that is 42.22% more than that of SAR-250 and 5.00% higher than SARFC-250. The SAH-250 has a maximum load that exceeds that of the SAH-200 by 14.58%. It shows that the height of the beam influences the beam deflection and the load capacity. The taller the beam, the more it increased the load capacity and decreased the beam deflection.
Summary of load and deflection curves
| Specimen | Pmax [kN] | δmax [mm] | P360 [kN] | P200 [kN] |
|---|---|---|---|---|
| SAR-200 | 70.22 | 26.72 | 34.29 | 59.43 |
| SAR-250 | 87.70 | 28.39 | 46.25 | 71.50 |
| SARFC-200 | 101.8 | 38.38 | 38.67 | 64.34 |
| SARFC-250 | 118.8 | 27.87 | 60.73 | 97.14 |
| SAH-200 | 108.86 | 36.38 | 45.40 | 74.34 |
| SAH-250 | 124.73 | 25.78 | 68.64 | 112.51 |
Source: own work.
The utilization of flange cleats on SARFC also increases the load capacity significantly compared to SAR specimens. The SARFC-200 specimen has a load capacity 44.97% higher than the SAR-200, while the SARFC-250 has a load capacity 35.46% higher than the SAR-250. The influence of beam height shows that SARFC-250 has a load capacity 16.70% higher than SARFC-200.
Thus, the shape of the gusset plate, the height of the beam, and the utilization of flange cleats have a significant role in determining the load capacity and deflection of connections. Therefore, choosing the appropriate gusset plate shape, beam height, and the addition of a flange cleat is crucial for ensuring resilient connections in structural design.
A study was conducted on the SAFT of a cold-formed steel beam-column connection. The key conclusions are:
- –
SAH-250 has enhanced load capacity relative to other specimens, owing to the different type of gusset plate and an increased beam depth. SAH-250 has a maximum load that is 42.22% higher than SAR-250, while SAH-250 has a maximum load that exceeds SAH-200 by 14.58%.
- –
The utilization of flange cleats on rectangular gusset plates minimizes the difference of load capacity to haunched gusset plates by 6.94% for the C200 beam and 5% for the C250 beam. It shows that the utilization of flange cleats on SARFC also increases the load capacity significantly compared to SAR specimens by 44.97% for the C200 beam and 35.46% for the C250 beam.
- –
Failures observed in the specimens are consistent, including buckling of the beam’s flange and web, as well as lateral torsional buckling.
- –
All of the specimens experienced bearing failure in the bolt hole in the beam and column. Additionally, a flange cleat failure occurred on the SARFC specimen.
Recommendations for future research include changing the beam profile to a sigma-type profile, or adding a stiffener on the web or flange to increase the stiffness of the CFS beam. Increasing the stiffness of the CFS beam may enhance its load-bearing capacity and overall structural performance. Future studies could also explore the effects of different materials or composite reinforcements to further improve the beam’s resilience under various loading conditions. Additionally, investigating the impact of optimized geometric configurations and innovative connection methods could yield significant insights into maximizing the efficiency of CFS beams. By combining these approaches, researchers may develop advanced solutions that not only improve structural integrity but also reduce material usage and construction costs.