
FIGURE 1.
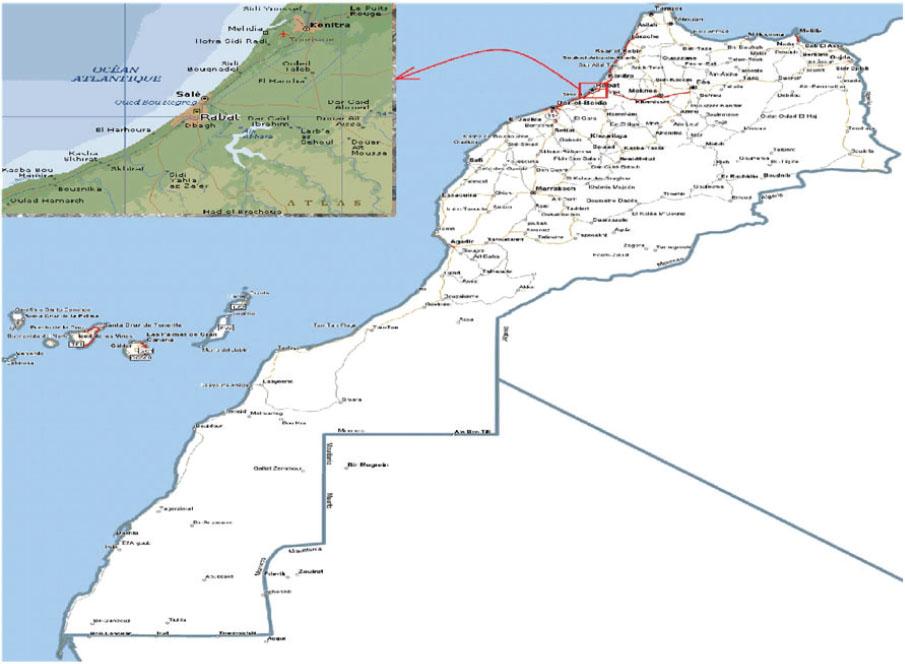
FIGURE 2.
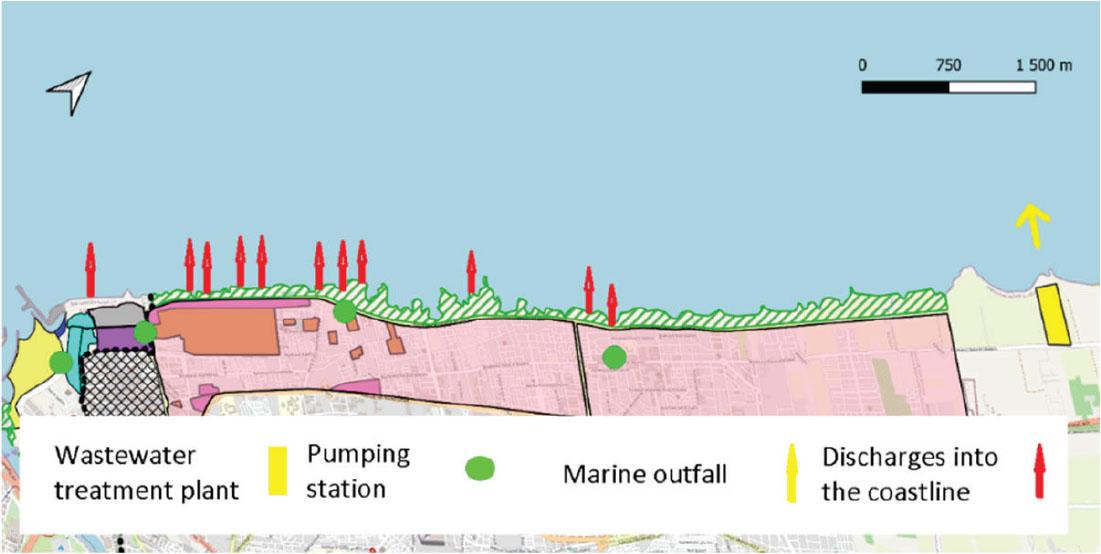
FIGURE 3.

FIGURE 4.
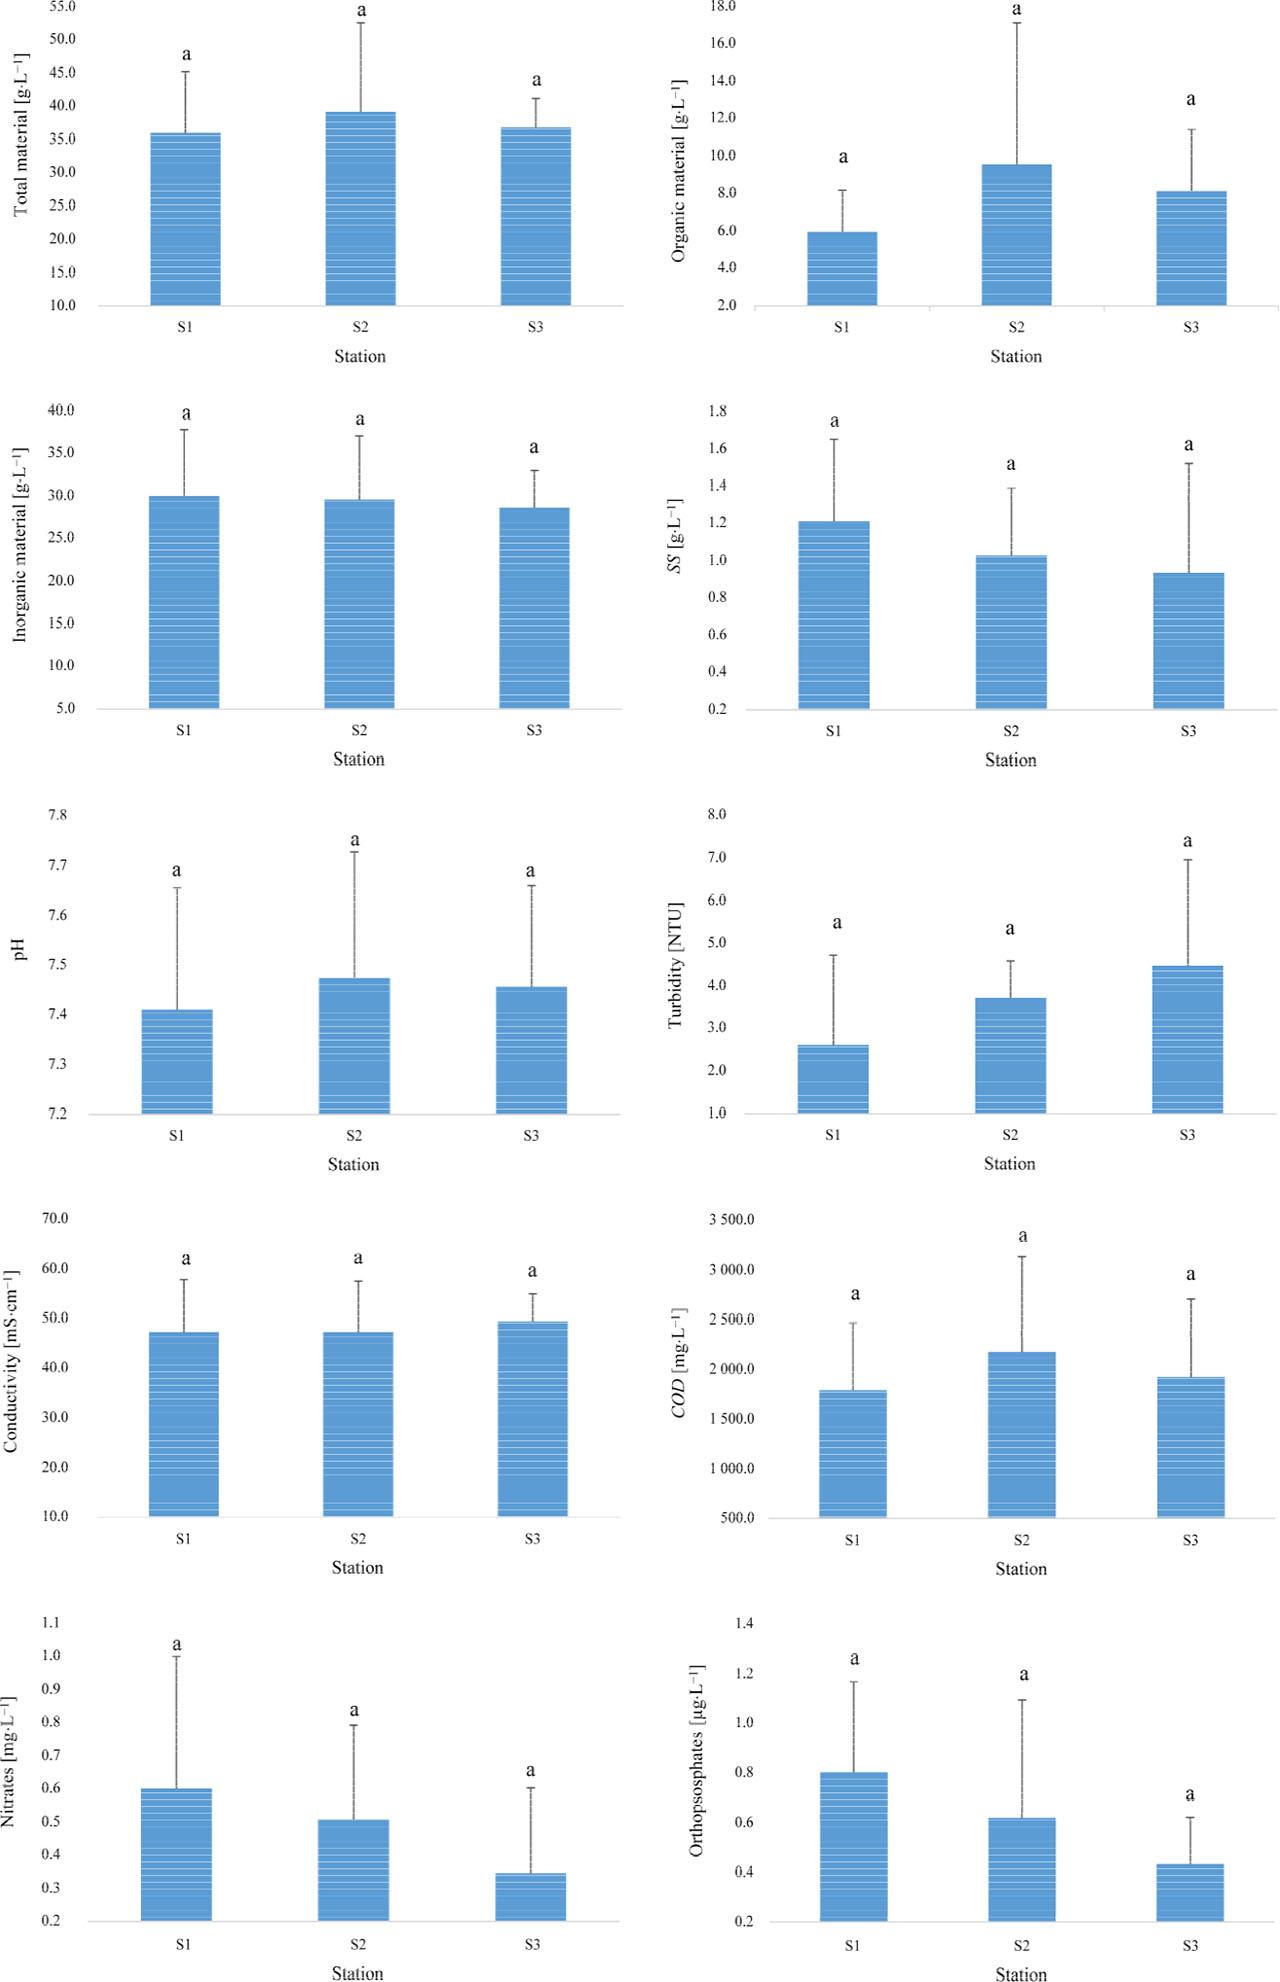
FIGURE 5.
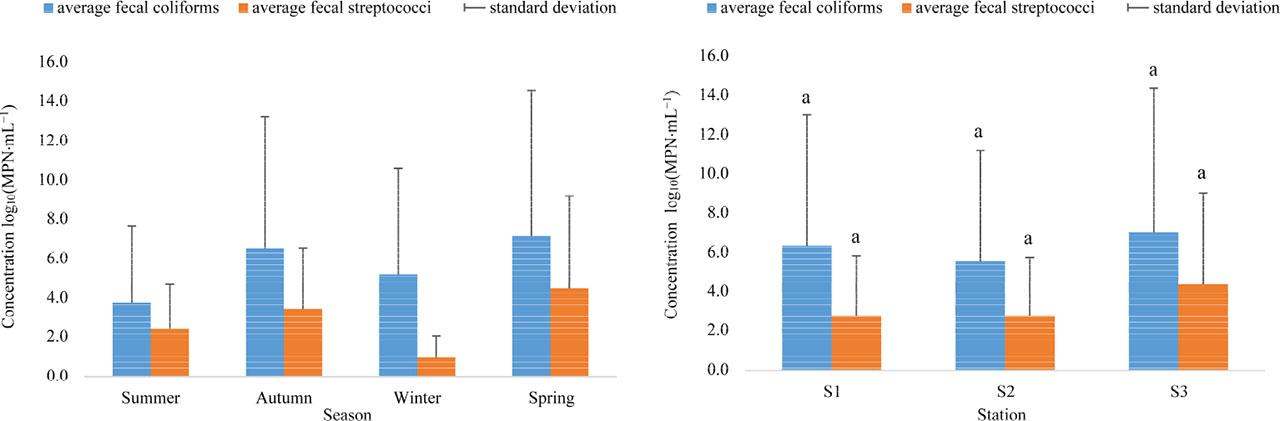
FIGURE 6.

Heavy metal concentrations [µg·L−1] in the city of Salé
| Metal | Mean | Min | Max |
|---|---|---|---|
| Zinc (Zn) | 42.0 | 0.1 | 83.9 |
| Lead (Pb) | 0.1 | 0.1 | 0.1 |
Seasonal average of selected physicochemical parameters from stations S1–S3: pre- and post-WWTP installation
| Water quality parameter | Unit | Without WWTP | With WWTP | Percentage reduction |
|---|---|---|---|---|
| Turbidity | NTU | 7.99 | 3.81 | 52.25 |
| Solid material | mg·L−1 | 52.34 | 37.82 | 27.74 |
| Inorganic material | mg·L−1 | 34.12 | 28.84 | 15.48 |
| Organic material | mg·L−1 | 18.22 | 8.98 | 50.68 |