Introduction
Children who are blind and visually impaired are expected by law (IDEA, 2004) to receive free, appropriate education just to meet their unique needs and to help them participate fully, the traditional curriculum has been expanded to include areas such as orientation and mobility, assistive technology, communication, vocational, and social skills (Corn, Hatlen, Huebner, Ryan and Sil-ler, 1995; Hatlen, 1996). However, it can be a challenge to fit these in-dividualised educational opportunities of the ex-panded core curriculum into the average school day. It is important to ensure that instructional time and resources are wisely spent. The “No Child Left Behind Act” (NCLBA, 2002) man-dates that educators consider evidence- based research when making choices for instructional interventions. The purpose of this study was to add to the evidence base regard-ing orientation and mo-bility (O&M) instruction. Specifically, this study provides a description of receipt of O&M by ele-mentary age children and addresses ques-tions about the associa-tion of O&M instruction with student performance of activities that are directly related to mobility activities
Review of the Literature
Orientation is defined as the process of using the senses to establish one’s position and relationship to objects within an environment. Mobility is the capacity, readiness, and ability to move throughout an environment (Hill and Ponder, 1976). Experts identify a wide range of O&M skills necessary for individuals with blindness and low vision, so the specific O&M skills on an IEP can vary (Wall Emerson and Corn, 2006). One key practice found in all O&M instruction is the attempt to use the natural environment for instruction and assessment. That environment can include the child’s home, classroom, school, and community. As part of O&M instruction, students are encouraged to travel safely, independently, efficiently, and gracefully through all appropriate environments. Experts in the field suggest that O&M instruction provides “fundamental and enabling life skills” (Huebner and Wiener, 2005, p. 579). A Cochrane Collaboration Review, completing a systematic search of all published research in O&M, was done in 2006 (Virgili and Rubin, 2009) and resulted in the conclusion that available research based evidence was unable to show that participation in O&M by adults was beneficial beyond normal recreation activities. In contrast, a study of adults’ spatial perception (Fiehler, Reuschel and Rosler, 2009) found that adults who were congenitally blind and started O&M instruction before the age of 12 demonstrated spatial perception that neared the levels of sighted peers, whereas those who began O&M training after age 12 had lower scores. The authors suggested that spatial abilities can be improved for blind individuals through early O&M training. These contradictions between professional opinion and the research evidence about whether O&M training is necessary and beneficial, provided the impetus for the current research.
O&M in the Schools
Elementary-age students with vision loss may receive O&M instruction as a related service within their individualised educational plans (lEPs) (IDEA, 2004). The process typically begins with an assessment by an O&M specialist. An O&M assessment generally includes: a) an interview with the student, family, and teacher, b) a review of the student’s educational and medical files, c) completion of an age-appropriate assessment tool, d) observation of the student during natural routines, e) travel in familiar and unfamiliar environments, and f) demonstration of selected O&M activities (Fazzi and Petersmeyer, 2001). Assessments should be individualised and allow students the opportunity to demonstrate their highest level of independence on all mobility related activities.
The practice of O&M has kept its focus on the unique needs of the individual, and the field has not developed and tested standardised assessment tools to measure change in these skills. This is a limiting factor for conducting large scale studies of O&M efficacy. Additionally, Sauerburger (2010) expressed a concern that O&M professionals have been slow to respond to the need for curriculum updates and revisions. Many individuals and small groups have developed informal assessment protocols that are used within a particular school or area, but research-based standardised tools are not available. One widely distributed O&M assessment tool for elementary age students is available as a companion to the comprehensive curriculum, Teaching Age-Appropriate Purposeful Skills (TAPS) (Pogrund et al., 1995). It is designed to assess each student’s ability to perform a wide range of functional mobility tasks across a variety of environments. The assessment by the O&M specialist is shared with the IEP team, and if the team determines that O&M instruction is needed, goals and objectives are developed to meet the specific needs of the individual student and added to their IEP. Assessment is expected to be an ongoing part of all O&M instruction to evaluate whether progress is being made in the student’s ability to demonstrate O&M related skills (Fazzi and Petersmeyer, 2001). This criterion-referenced measure provides a starting place for the development of standardised tools, but as of yet, none have been developed.
Orientation and mobility curricula have been developed to meet the specific needs of elementary age students by individual practitioners, schools, and districts by using key resources in the field (Hill and Ponder, 1976; Jacobson, 1993; LaGrow and Weessies, 1994). As an example, the TAPS curriculum (Pogrund et al., 1993) was developed with the specific needs of students with blindness or low vision in mind. The areas of instruction target abilities to: a) travel using a sighted guide to all familiar locations; b) travel indoors using rote routes; c) travel to other school areas or other buildings using rote routes; d) create new routes between familiar places indoors; e) execute a route, given a set of verbal directions to an unfamiliar location within one building; f) execute a route, given a set of verbal directions to an unfamiliar location in another building; g) locate an unfamiliar place by using numbering systems; h) orient self to an unfamiliar room; i) solicit help to orient self to a building; and j) solicit help to orient self to a high school campus or to a workplace.
Progress on specific goals and objectives is reported to parents on a regular basis, with a new IEP developed by the IEP team annually. Assessments are generally administered by the same O&M specialist who has provided instruction. They are often designed by the instructor and do not use a standardised assessment tool. Although it is typical for O&M instructors to document progress for each student after O&M instruction, there are no standardised scores that verify those findings.
The low incidence of visual impairment and the heterogeneity of the population of people with visual impairments have made research with this group very difficult. As reported in 2007, less than .05 percent of children ages 6 to 21 were designated as having a visual impairment and receiving services for visual impairments under part B of the IDEA (U.S. Department of Education, 2007). The combination of these factors leaves O&M specialists with limited curriculum, intervention, or assessment resources that meet the rigorous standard of having the support of research-based evidence. Often the highest level of evidence an O&M instructor can bring with a resource is the support of expert opinion. The purpose of the current study was to add to the research base by using a large national dataset to ask whether participation in O&M is associated with demonstration of ability to perform O&M related activities for students who are elementary age.
Methods
Participants
The study involved students in the U.S. with visual impairment who participated in the Special Education Elementary Longitudinal Study (SEELS), which included a nationally representative sample of elementary and middle school students with disabilities. The sampling was taken from 245 local education authorities and 35 state-supported special schools from 1999 through 2004. It included children who ranged from 6 to 12 years of age during the first year of the study (Godard et al., 2007). Sampling methods ensured that the cases included were representative of the U.S. special education population and age cohort. Disability categories were over-sampled in this design, allowing these data to be weighted and allowing the user to make generalisations nationally. The full sample included 1,110 students with visual impairment. The sample for this study varied for different analyses, but at most, included 850 students.
Data Source
The SEELS dataset was obtained from the U.S. Office of Special Education Programs. The dataset contains electronic data from parent interviews, direct or alternative assessments, school program surveys, school characteristics surveys, and teacher surveys. Data were collected longitudinally in three waves conducted over five years. For this study, the variable of participation in O&M was taken from waves 1, 2, and 3 of the parent survey. The variables for performance of mobility activities for the current study were taken from the school program survey. Demographic variables were found in the parent survey and cross index sections of the database.
Study Design and Research Questions
This was a correlational study, using secondary data analysis of variables from the SEELS dataset using SPSS version 17. The researcher obtained approval from the Human Subjects Institutional Review Board at Western Michigan University for conducting the analysis (HSIRB #10-07-09). The first question addressed in this study asked: What is the demographic makeup of the students with visual impairments who had the opportunity to participate in O&M, and those who did not? The study then addressed the primary question: Is participation in O&M associated with improved performance of O&M activities? A third question asked if there was an association between the time (i.e., in which wave) an individual receives O&M training and performance of O&M activities.
Definitions of Variables and Data Analysis
To answer research question one, regarding student characteristics most associated with receiving O&M services, cross-tabulations were performed to examine characteristics of students who received O&M, including the existence of multiple disabilities and frequencies of other demographic variables. The independent variables were taken from the parent survey and the cross index sections of SEELS and included: visual impairment as a primary disability, number of multiple disabilities, age, gender, grade, income, ethnicity, and urbanicity (urban, suburban or rural). The dependent variable was participation in O&M during the past 12 months, taken from the parent survey.
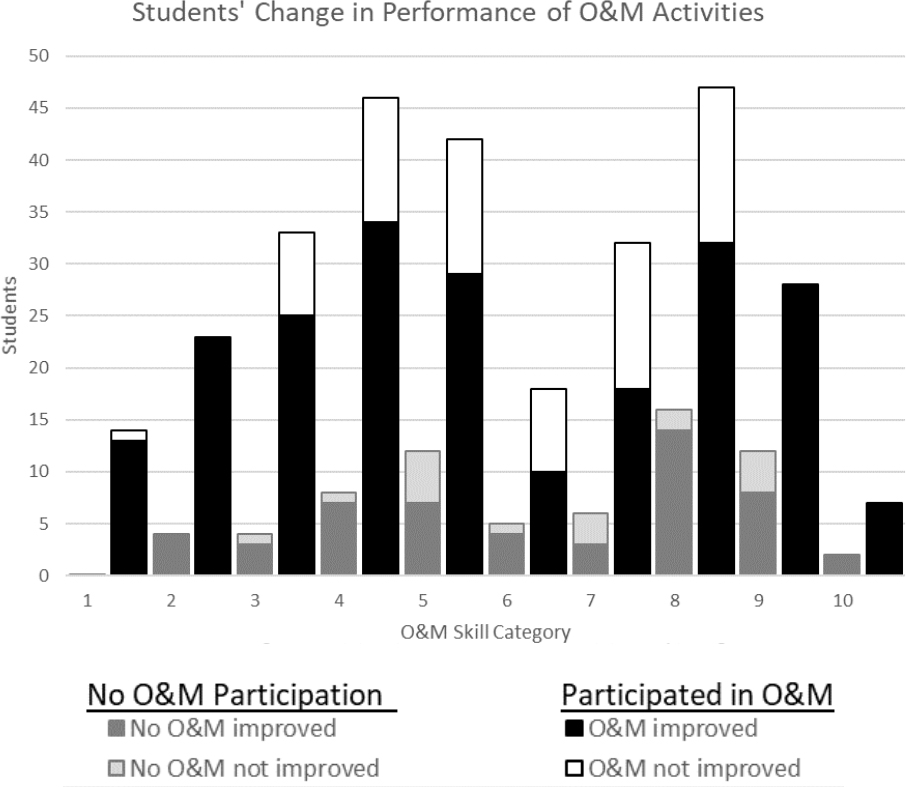
Chi Square analyses were conducted to analyse data to answer the research question: Is participation in O&M associated with performance of O&M related activities? Participation in O&M was taken from the parent survey, and the O&M related activities were taken from the school program survey. For each of 10 O&M activities, the respondent indicated how well the student performed each of the mobility activities. The levels of response included: “Not very well,” “pretty well,” “very well.” The mobility activities were those outlined in the TAPS curriculum (Pogrund et al., 1995), and included questions about the child’s ability to:
travel using a sighted guide to all familiar locations
travel indoors using rotely learned routes,
travel to other school areas or other buildings using rotely learned routes,
create new routes between familiar places indoors,
execute a route, given a set of verbal directions to an unfamiliar location within one building,
execute a route, given a set of verbal directions to an unfamiliar location in another building,
locate an unfamiliar place by using numbering systems,
orient self to an unfamiliar room,
solicit help to orient self to a building, and
solicit help to orient self to a high school campus or to a workplace
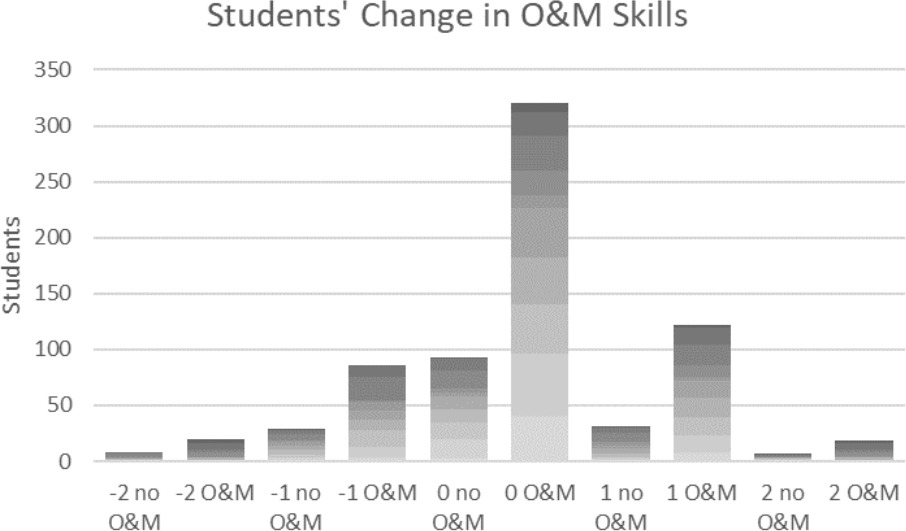
To answer the third research question, regarding whether there was an association between the time the child begins O&M training and performance on mobility activities, chi square analyses were conducted. The independent variable for the analysis was the time O&M instruction began, which was identified from the parent survey. The times a student could have begun O&M instruction were in wave 1 or in wave 3. These data represent a difference of two years. Wave 2 data were not included because during that wave of parent surveys many of the parents of students who are blind and visually impaired did not respond, so much of the data in wave 2 is missing.
Results
Descriptive summary statistics (Table 1) were generated for the 850 students in the SEELS who were identified by their parents as having a visual impairment or blindness. Variables describing the study or blindness. Variables describing the study sample included the demographic variables: blindness, visual impairment, age, grade, gender, ethnicity, income, urbanicity, and number of disabilities.
Table 1.
Demographics of Students with Visual Impairments Who Received O&M (N = 850)
| Characteristic | N | Wave 1 % Participated | CI | N | Wave 2 % Participated | CI | N | Wave 3 % Participated | CI |
|---|---|---|---|---|---|---|---|---|---|
| Vision | |||||||||
| Blind | *290 | 65.2 | .67-.72 | 146 | 23.9 | .12-.38 | *211 | 59.7 | .52-.66 |
| Vis. Impaired | *723 | 46.2 | .42-.50 | *146 | 17.5 | .12-.25 | *716 | 37.6 | .34-.41 |
| Age | |||||||||
| 7-9 (8-10) 11-12 | 267 | 42.3 | 3.7-5.0 | 48 | 20.8 | .10-.36 | 237 | 39.2 | .32-.45 |
| 10-12(11-13) 13-14 | 366 | 46.7 | .46-.40 | 77 | 19.5 | .09-.28 | 288 | 39.6 | .33-.44 |
| 13-14(14-16) 15-17 | 105 | 50.5 | .40-.61 | 29 | 13.8 | .01-.31 | 228 | 36.4 | .30-.43 |
| Grade | |||||||||
| Ungraded | 58 | 60.3 | .47-.73 | 10 | 20.0 | -.14--.64 | 70 | 35.7 | .21-.44 |
| 1-3(1-4) 1-5 | 170 | 42.4 | .35-.50 | 37 | 16.2 | .04-.30 | 99 | 41.4 | .33-.53 |
| 4-5 (5-6) 6-8 | 267 | 46.1 | .40-.52 | 60 | 25.0 | .13-.36 | 374 | 39.8 | .34-.44 |
| 6&up 7&up 9-12 | 208 | 44.2 | .37-.51 | 40 | 15.0 | .02-. 24 | 210 | 35.7 | .29-.43 |
| Gender | |||||||||
| Male | 447 | 43.4 | .38-.48 | 86 | 21.1 | .12-.31 | 467 | 36.4 | .31-.40 |
| Female | 291 | 49.1 | .43-.55 | 68 | 14.7 | .07-.26 | 286 | 42.0 | .36-.47 |
| Ethnicity | |||||||||
| White | *468 | 48.1 | .43-.53 | 103 | 19.4 | .11-.27 | 483 | 38.9 | .34-.43 |
| African American | *126 | 40.5 | .33-.51 | 30 | 30.0 | .13-.49 | 122 | 36.1 | .28-.45 |
| Hispanic | *113 | 48.7 | .38-.57 | 14 | 0 | - | 112 | 42.0 | .32-.51 |
| Other | *30 | 20.0 | .52-.38 | 6 | 0 | - | 35 | 28.6 | .14-.47 |
| Income | |||||||||
| 25,000 and under | 253 | 42.7 | .37-.49 | 64 | 20.3 | .12-.34 | 236 | 36.4 | .30-.42 |
| 25,001-50,000 | 213 | 48.8 | .42-.56 | 34 | 17.6 | .05-.34 | 193 | 38.3 | .31-.45 |
| Over 50,000 | 232 | 44.8 | .39-.52 | 55 | 18.2 | .05-.27 | 308 | 39.6 | ,34-.45 |
| Urbanicity | |||||||||
| Rural | *33 | 39.4 | .22-.57 | 9 | 22.2 | -.17-.73 | *81 | 40.7 | .30-.52 |
| Suburban | *309 | 40.1 | .35-.46 | 59 | 15.3 | .06-.26 | *327 | 30.3 | .25-.35 |
| Urban | *267 | 51.5 | .45-.56 | 151 | 17.9 | .12-.31 | *340 | 45.6 | .39-.50 |
| # of Disabilities | |||||||||
| 0 | - | - | - | - | - | 6 | 50.0 | .07-1.07 | |
| 1 | 248 | 44.0 | .37-.50 | 45 | 24.4 | .11-.38 | 345 | 40.6 | .35-.45 |
| 2 | 175 | 49.1 | .42-.58 | 28 | 14.3 | .00-.28 | 174 | 30.5 | .22-36 |
| 3 | 107 | 45.8 | .35-.55 | 22 | 9.1 | -.04-.22 | 113 | 40.7 | .31-.50 |
| 4 | 83 | 39.8 | .27-.50 | 24 | 20.8 | .03-.38 | 68 | 44.1 | .31-.56 |
| 5 | 68 | 1.5 | .42-.67 | 14 | 14.3 | -.07-.35 | 24 | 37.5 | .18-.61 |
| 6 | 33 | 42.4 | .22-.60 | 9 | 22.2 | -.12-.56 | 15 | 26.7 | .01-.52 |
| 7 | 16 | 31.3 | .01-.52 | 2 | 0 | - | 4 | 75.0 | .05-1.55 |
| 8 | 4 | 75.0 | .46-1.55 | 1 | 0 | - | 3 | 33.3 | 1.10-1.77 |
| 9 | 2 | 50.0 | 5.85-6.85 | 1 | 0 | - | 1 | 100 | - |
| 10 | 2 | 100 | - | - | - | - | - | - | - |
| X2(dF, N) | P | ||||
|---|---|---|---|---|---|
| Wave 1 | Blindness | X2(1, N=290) = 73.276 | p = .000 | ||
| Visual Impairment | X2(1, N=723) = 4.64 | p = .037 | |||
| Urbanicity | X2(2, N=609) = 9.334 | p = .009 | |||
| Ethnicity | X2(3, N=737) = 10.837 | p = .013 | |||
| Wave 2 | Visual Impairment | X2(1, N=146) = 4.716 | p. = .030 | ||
| Wave 3 | Blindness | X2(1, N=211) = 55.653 | p = .000 | ||
| Visual Impairment | X2(1, N=716) = 5.469 | p = .016 | |||
| Urbanicity | X2(2, N=748) = 16.745 | p = .000 | |||
| Both | Wave 1 | Wave 3 | None | ||
|---|---|---|---|---|---|
| w1 - w3 | w1 - w3 | w1 - w3 | w1 -w3 | ||
| Travel Using Sighted Guide: Familiar Locations | |||||
| Not Very Well | 1.2 - 8.4 | 7.1 - 8.4 | 0 - 0 | 4.5 - 0 | |
| Pretty Well | 19.8 - 14.5 | 35.7 - 16.7 | 0 - 15.8 | 22.7 - 22.6 | |
| Very Well | 79 - 77.1 | 57.1 - 75.0 | 100 - 84.2 | 72.7 - 77.4 | |
| n | 81 83 | 28 12 | 7 19 | 22 21 | |
| Wave 1, X2 (6) = 8.92 p = .178 | Wave 3, X2 (6) = 5.24, p = .514 | ||||
| Travel Indoors: Rotely Learned Routes | |||||
| Not Very Well | 5.1 - 4.6 | 9.4 - 4.0 | 0-6.7 | 3.8-1.4 | |
| Pretty Well | 28.3 - 30.6 | 18.8-16.0 | 7.7-6.7 | 17-11.3 | |
| Very Well | 66.7 - 64.8 | 71.9-80.0 | 92.3 - 86.7 | 79.2 - 87.3 | |
| n | 99 108 | 32 25 | 13 30 | 53 71 | |
| Wave 1, X2 (6) = 7.18 p = .304 | Wave 3, X2 (6) = 16.91 p = .010* | ||||
| Travel to Other Areas: Other Learned Routes | |||||
| Not Very Well | 13.4 - 12.4 | 20.0 - 7.7 | 0 - 6.9 | 7.8 - 4.4 | |
| Pretty Well | 32.0 - 34.0 | 13.3 - 19.2 | 28.6 - 20.7 | 15.7 - 14.7 | |
| Very Well | 54.6 - 53.6 | 66.7 - 73.1 | 71.4-72.4 | 76.5 - 80.9 | |
| n | 97 97 | 30 26 | 14 29 | 51 68 | |
| Wave 1, X2(6) = 12.36, p = .054 | Wave 3, X2 (6) = 14.64 p = .023* | ||||
| Create New Routes: Familiar Places Indoors | |||||
| Not Very Well | 27.3 - 28.7 | 15.6 - 12.0 | 6.3 - 13.3 | 18.5 - 9.5 | |
| Pretty Well | 38.6 - 33.0 | 40.6 - 32.0 | 25.0 - 6.7 | 16.7 - 20.3 | |
| Very Well | 34.1 - 38.3 | 43.8 - 56.0 | 68.8 - 80.0 | 64.8 - 70.3 | |
| n | 88 94 | 32 25 | 16 30 | 54 74 | |
| Wave 1, X2(6) = 18.51, p = 005* | Wave 3, X2 (6) = 28.12 p = .000* | ||||
| Execute Route within Building with Verbal Directions | |||||
| Not Very Well | 36.0 - 32.2 | 23.1 - 12.5 | 6.7 - 11.1 | 27.5 - 17.8 | |
| Pretty Well | 25.6 - 33.3 | 34.6 - 50.0 | 40.0 - 25.9 | 17.6 - 19.2 | |
| Very Well | 38.4 - 34.4 | 42.3 - 37.5 | 53.3 - 63.0 | 54.9 - 63.0 | |
| n | 86 90 | 26 24 | 15 27 | 51 73 | |
| Wave 1, X2 (6) = 9.87 9.87, p = .130 | Wave 3, X2 (6) = 22.43 p = .001* | ||||
| Execute Route in another Building with Directions | |||||
| Not Very Well | 30.8 - 41.6 | 42.9 - 21.7 | 14.3 - 11.12.2010 28.6 - 44.4 | 16.0 - 21.7 | |
| Pretty Well | 28.2 - 35.1 | 14.3 - 52.2 | 16.0 - 17.4 | ||
| Very Well | 41.0 - 23.4 | 42.9 - 26.1 | 57.1 - 44.4 | 68.0 - 60.9 | |
| n | 39 77 | 14 23 | 7 27 | 25 69 | |
| Wave 1, X2 (6) = 7.05, p = .316 | Wave 3, X2 (6) = 32.24 p = .000* | ||||
| Locate Unfamiliar Place by Numbering System | |||||
| Not Very Well | 58.5 - 47.8 | 47.1 - 30.0 | 22.2 - 21.7 | 51.6 - 22.6 | |
| Pretty Well | 30.2 - 32.8 | 23.5 - 40.0 | 33.3 - 47.8 | 16.1 - 15.1 | |
| Very Well | 11.3 - 19.4 | 29.4 - 30.0 | 44.4 - 30.4 | 32.3 - 62.3 | |
| n | 53 67 | 17 20 | 9 23 | 31 53 | |
| Wave 1, X2 (6) = 10.30, p = .113 | Wave 3, X2 (6) = 29.69 p = .000* | ||||
| Orient Self to Unfamiliar Room | |||||
| Not Very Well | 31.9 - 30.5 | 44.1 - 8.0 | 6.7 - 3.3 | 8.1 - 10.5 | |
| Pretty Well | 36.2 - 43.2 | 17.6 - 60.0 | 33.3 - 33.3 | 33.9 - 20.9 | |
| Very Well | 31.9 - 26.3 | 38.2 - 32 | 60 - 63.3 | 58.1 - 68.6 | |
| n | 94 95 | 34 25 | 15 30 | 62 86 | |
| Wave 1, X2 (6) = 25.89, p = .000* | Wave 3, X2 (6) = 47.51 p = .000* | ||||
| Solicit Help to Orient Self to Building | |||||
| Not Very Well | 39.6 - 36.4 | 33.3 - 18.2 | 16.7 - 20.8 | 18.0 - 19.4 | |
| Pretty Well | 25.3 - 33.0 | 33.3 - 40.9 | 50.0 - 16.7 | 32.0 - 20.8 | |
| Very Well | 35.2 - 30.7 | 33.3 - 40.9 | 33.3 - 62.5 | 50.0 - 59.7 | |
| n | 91 88 | 30 22 | 12 24 | 50 72 | |
| Wave 1, X2 (6) = 10.40, p = .109 | Wave 3, X2 (6) = 19.00 p = .004* | ||||
| Solicit Help to Orient Self to Campus or Workplace | |||||
| Not Very Well | 66.7 - 42.9 | 45.5 - 16.7 | 20.0 - 16.7 | 31.3 - 18.4 | |
| Pretty Well | 14.3 - 21.4 | 36.4 - 33.3 | 0 - 16.7 | 6.3 - 16.3 | |
| Very Well | 19.0 - 35.7 | 18.2 - 50.0 | 80.0 - 66.7 | 62.5 - 65.3 | |
| n | 21 56 | 11 12 | 5 18 | 16 49 | |
| Wave 1, X2 (6) = 16.26, p = .012* | Wave 3, X2 (6) = 14.22 p = .027* | ||||