
TABLE 1.
Descriptive statistics and between-group differences
| Variable | Internalizing group | Control group | Between-group differences | Effect sizes | ||||||
|---|---|---|---|---|---|---|---|---|---|---|
| n | Mean | Sd | n | Mean | Sd | U | p | η 2 | d | |
| Internalizing problems | 33 | 68.70 | 9.0 | 24 | 46.92 | 8.53 | 30.0 | <.001** | 0.61 | 2.52 |
| Affect Consciousness 1 | 33 | 3.28 | 0.62 | 24 | 4.25 | 0.56 | 87.5 | <.001** | 0.44 | 1.76 |
| Awareness 2 | 33 | 3.67 | 0.82 | 24 | 4.56 | 0.60 | 152.0 | <.001** | 0.27 | 1.23 |
| Tolerance | 32 | 3.71 | 0.58 | 24 | 4.54 | 0.51 | 110.5 | <.001** | 0.37 | 1.52 |
| Emotional Expressivity | 33 | 3.51 | 0.67 | 24 | 4.69 | 0.64 | 73.0 | <.001** | 0.48 | 1.91 |
| Conceptual Expressivity | 33 | 2.30 | 0.67 | 24 | 3.20 | 0.79 | 151.5 | <.001** | 0.27 | 1.23 |
| Interest/Excitement 3 | 33 | 3.82 | 1.07 | 24 | 4.78 | 0.67 | 179.5 | <.001** | 0.22 | 1.05 |
| Enjoyment/Joy | 33 | 3.97 | 1.03 | 24 | 4.81 | 0.48 | 181.5 | <.001** | 0.21 | 1.03 |
| Fear/Panic | 33 | 3.27 | 0.98 | 24 | 4.27 | 0.90 | 171.0 | <.001** | 0.23 | 1.10 |
| Anger/Rage | 33 | 3.14 | 0.76 | 24 | 4.40 | 0.90 | 118.5 | <.001** | 0.35 | 1.48 |
| Shame/Humiliation | 33 | 2.26 | 0.67 | 23 | 3.08 | 1.04 | 201.5 | .003* | 0.16 | 0.86 |
| Sadness/Despair | 33 | 3.02 | 0.79 | 24 | 4.10 | 0.97 | 155.5 | <.001** | 0.27 | 1.20 |
| Envy/Jealousy | 33 | 2.46 | 1.15 | 24 | 3.43 | 1.43 | 244.0 | .014* | 0.11 | 0.69 |
| Guilt/Remorse | 33 | 3.12 | 1.15 | 24 | 3.98 | 1.15 | 234.0 | .009* | 0.12 | 0.74 |
| Tenderness/Care | 33 | 4.46 | 1.17 | 24 | 5.30 | 0.63 | 168.0 | <.001** | 0.24 | 1.12 |
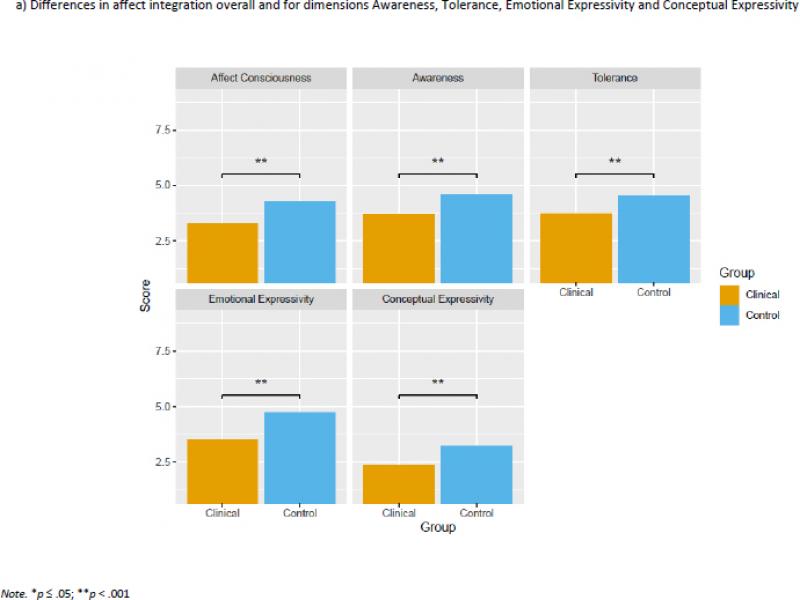
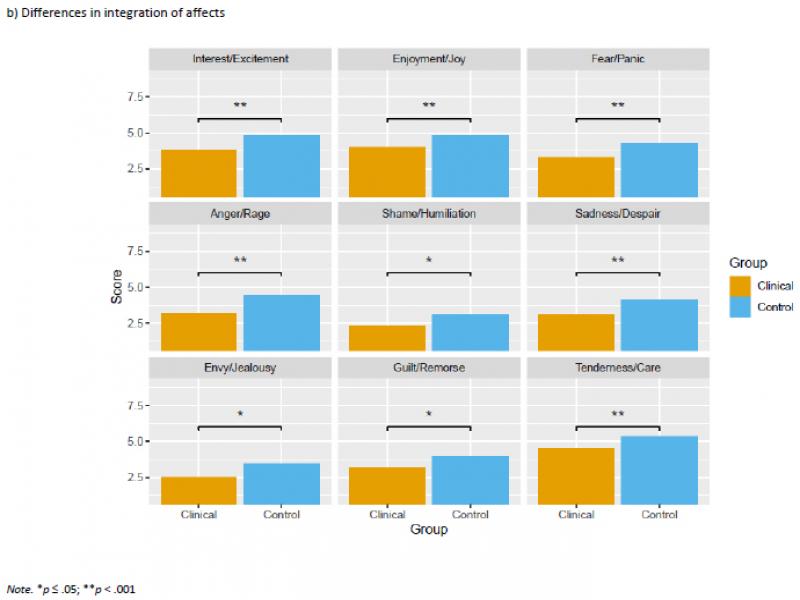
Figure 1.
Visual representations of between-group differences in affect integration
TABLE 2.
Correlations between overall affect integration and dimensions
TABLE 3.
Correlations between affective categories
| Variable | n | Interest Excitement | Enjoyment Joy | Fear Panic | Anger Rage | Shame Humiliation | Sadness Despair | Envy Jealousy | Guilt Remorse | Tenderness Care |
|---|---|---|---|---|---|---|---|---|---|---|
| Interest Excitement | 57 | - | ||||||||
| Enjoyment Joy | 57 | .66** | - | |||||||
| Fear Panic | 57 | .39* | .43** | - | ||||||
| Anger Rage | 57 | .36* | .22 | .66** | - | |||||
| Shame Humiliation | 56 | .26 | .37* | .37* | .28* | - | ||||
| Sadness Despair | 57 | .50** | .38* | .50** | .50** | .42* | - | |||
| Envy Jealousy | 57 | .44** | .49** | .41* | .23 | .30* | .25 | - | ||
| Guilt Remorse | 57 | .45** | .50** | .36* | .24 | .40* | .52** | .41** | - | |
| Tenderness Care | 57 | .58** | .51** | .35* | .40* | .37* | .49** | .39* | .33* | - |