
Introduction
Attention deficit hyperactivity disorder (ADHD) is a commonly occurring psychiatric disorder associated with poor psychiatric, social, educational, and occupational outcomes across the age-range (1). ADHD is a highly heritable condition (2, 3) but higher levels of intelligence may act as a protective factor for developing ADHD (4). Among the factors associated with poor outcomes in ADHD is the individual’s general mental or cognitive abilities as indexed by the Full Scale IQ (FSIQ) score from standardized tests of intelligence (5-7). This is important because meta-analytic studies routinely find that individuals with ADHD, across the age range, present with significantly lower FSIQ scores than control groups (8). However, while lower FSIQ scores are associated with poorer functional outcomes, they do not appear to predict the persistence or remittance of ADHD symptoms over the long-term (9-13). The relationship between ADHD, IQ and functional outcomes is further complicated by population-based studies that find that FSIQ scores are less stable during childhood for all children (14-16). While there is evidence suggesting that active symptoms of psychiatric disorder may interfere with cognitive functioning during childhood, longitudinal studies tracking both intelligence and psychiatric symptoms are needed (17).
To date, only a handful of longitudinal studies have examined the stability of FSIQ scores in children and adolescents with ADHD. Five studies involving comparison groups have found that (prorated) FSIQ scores tend to be stable at the group level for youth with ADHD. However, these studies employed earlier versions of the Wechsler intelligence scales. This is relevant because subtests and scoring procedures are updated with each new version (18), which may impact interpretations about the stability of the FSIQ and other indices of cognitive functioning in youth with ADHD (19).
Two studies followed youth with ADHD and non-clinical controls using the Wechsler Intelligence Scale for Children (WISC)-III (20) and found that the FSIQ and composite scores were largely stable at the group level over time (11, 21). The more recent study also investigated individual change and found that both FSIQ and other composite scores were largely stable at both the group and individual level, and the composites were not associated with the persistence or severity of ADHD into adulthood (11). To date, one study has examined the stability of WISC-IV (22) composite scores in referred youth with learning disorders with or without attention deficits (23). Composite scores were largely stable at the group but not at the individual level. Longitudinal studies are needed that examine the stability of cognitive functioning from the latest versions of the WISC and Wechsler Adult Intelligence Scale (WAIS), in youth with ADHD. Moreover, such studies should examine the relationship between the severity of ADHD symptoms and functional outcome at each assessed interval. Furthermore, to our knowledge, no study has investigated the association between school grades, the WISC-IV composite scores, and ADHD symptoms at each time point.
In the present study, we examined the long-term outcome of the five composites of the WISC-IV and the WAIS-IV (24) in a group of clinically referred children with ADHD with no known intellectual disability as well as in a control group of the same age. In the ADHD group, the long-term outcome of ADHD symptoms measured with the SNAP-IV and their relationship with Wechsler composites and school grades were investigated. First, and based on the evidence available, we hypothesized that FSIQ (i.e. standardized composite scores, based on comparison to same-aged peers) would be stable at the group level between the baseline and the follow-up assessment in the ADHD group. Based on the limited evidence available, Verbal Comprehension, Perceptual Reasoning, Working Memory, Processing Speed (i.e. standardized index scores, based on comparison to same-aged peers) would be stable between measuring points. Second, we anticipated that the Wechsler composite scores and the severity of ADHD symptoms at the baseline and follow-up assessments would be unrelated based on previous studies finding that neither FSIQ nor the four composites were associated with ADHD remittance or persistence (11). In reference to findings that both ADHD diagnosis and IQ predict educational outcome (1, 7), we anticipated that ADHD symptom scores and all the Wechsler composite scores at both time points would be associated with school grades.
Methods
Participants
Youth with ADHD were recruited from consecutive diagnostic assessments at the Neuropsychiatric Unit of the Child and Adolescent Psychiatry (CAP) Clinic in Lund, Sweden; controls were youth of the same age recruited from schools in the same region as the CAP. The inclusion criteria for this longitudinal study were a DSM-IV diagnosis of ADHD (25), fluency in Swedish, and the absence of a DSM-IV diagnosis of mental retardation (25), hereafter referred to as intellectual disability. Individuals with specific learning difficulties (assessed by their school) were not excluded. In the present study, only children assessed with the WISC-IV or the WAIS-IV at baseline were included, resulting in a sample size of N = 184 (ADHD = 125: male = 87, female = 38; Controls = 59: male =31, female = 28). Written informed consent was obtained from all participants (and their parents). This study was approved by the Research Ethics Committee at Lund University, Lund, Sweden (Reg. No. 2012/88), and registered in ClinicalTrials.gov Protocol Registration and Result System (ID: NCT04201509, protocol ID: 2012/88).
Measures
Five to Fifteen
Five to Fifteen (FTF) (26) is a parent- and teacher-completed screen for development-related impairments and behavioral problems in children and adolescents. The instrument consists of 181 items on a three-point scale (0 = Does not apply, 1 = Applies sometimes/ to some extent, and 2 = Applies), comprising 8 main domains: Motor skills, Executive functions, Perception, Memory function, Language, Learning ability, Social skills, and Emotional difficulties / behavioral problems, all of which have further subdomains. We used scores on the parent-report FTF at baseline to describe the additional impairments of the ADHD group. Scores on the Acting Out and Internalized subdomains (98th percentile cut-off) of the Emotional difficulties / behavioral problems domain were used as controlling variables in the analysis of predictors of academic outcome in the ADHD group. The FTF has acceptable psychometric properties and evidence of clinical validity (27).
The Swanson-Nolan-Pelham scale, version IV
The Swanson-Nolan-Pelham scale, version IV (SNAP-IV), is a DSM-IV-based ADHD rating scale for parents and teachers (28, 29). The version of the SNAP-IV used here is comprised of the 18 diagnostic criteria of DSM-IV ADHD, supplemented with eight statements concerning ODD symptoms and four supplementary statements regarding ODD and ADHD. Each item is rated on a 4-point scale (0 = not all; 3 = very much), with higher scores indicating greater frequency/severity. Sum scores (continuous values) from the parent ratings of the SNAP-IV (ADHD-combined score) subscales are analysed in this study (referred to as SNAP-IV). The SNAP-IV has acceptable psychometric properties and evidence of clinical validity (28, 29). The current study used parent ratings of the SNAP-IV (ADHD-combined score) at the baseline and at the follow-up as independent variables.
Wechsler Intelligence Scales
Cognitive functioning was measured with the WISC-IV (30) and for youth 16 years or above with the WAIS-IV (31). The WISC-IV and the WAIS-IV consist of ten core battery subtests, yielding four composites. The WISC-IV composites (subtests) are: Verbal Comprehension (Similarities, Vocabulary, Comprehension); Perceptual Reasoning (Block Design, Picture Concepts, Matrix Reasoning); Working Memory (Digit Span, Letter–Number Sequencing); Processing Speed (Coding, Symbol Search); General Ability Index (GAI) and FSIQ. The composites for the WAIS-IV are the same as for the WISC-IV, but the WAIS-IV composites replace some of the subtests: Verbal Comprehension replaces Comprehension with Information; Perceptual Reasoning replaces Pictures Concepts with Puzzles; and Working Memory replaces Letter– Number Sequencing with Arithmetic (32). All composite scores on the WISC-IV and WAIS-IV are standardized according to age, with a mean of 100 and standard deviation (SD) of 15 (32, 33). As the WISC-IV and WAIS-IV use the same indexes but not the same core subtests, Verbal Comprehension, Perceptual Reasoning, Working Memory, Processing Speed, and FSIQ are used as outcome variables to test our hypothesis.
Procedure
Baseline assessments
Figure 1 presents the workflow of the baseline and follow-up assessments. For the ADHD participants recruited from the CAP clinic, all diagnostic assessments were carried out by child and adolescent psychiatrists. An ADHD diagnosis was made based on the DSM-IV criteria (25) using information from multiple sources, including: comprehensive psychiatric interview with the child and their parents (including the SNAP-IV and FTF); semi-structured telephone interviews with teachers; and neuropsychological assessments using the WISC-IV/WAIS-IV (n = 120/5, depending on age) carried out by a psychologist. For most ADHD participants, the neuropsychological assessments were carried out by the referring school psychologists prior to the child’s assessment at the CAP clinic. All ADHD participants were medicine-naïve at the baseline assessment.
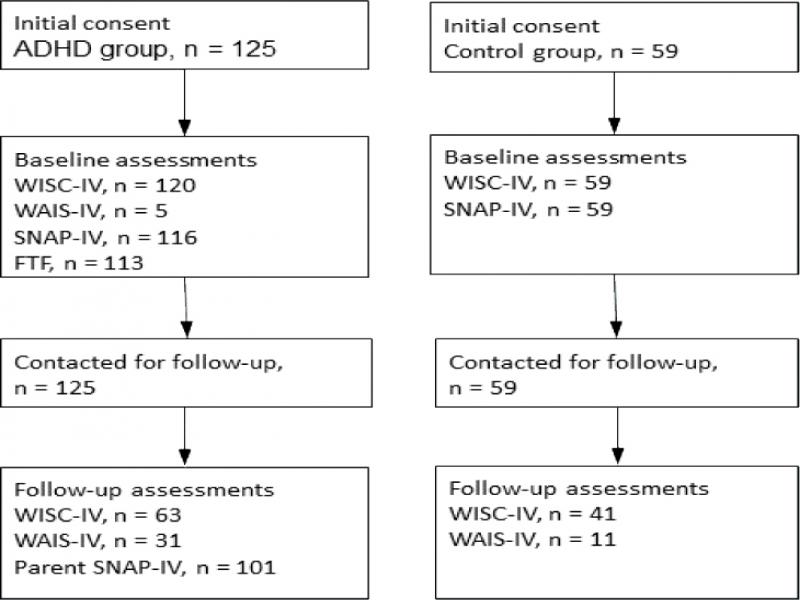
FIGURE 1.
Flow-Chart
ADHD = attention deficit hyperactivity disorder; FTF = Five To Fifteen; SNAP-IV = Swanson-Nolan-Pelham scale, version IV; WAIS-IV = Wechsler Adult Intelligence Scales, fourth edition; WISC-IV = Wechsler Intelligence Scales for children, fourth edition
No formal diagnostic assessments were carried out with the participants in the Control group. As part of the written informed consent procedure, parents of controls completed the SNAP-IV and answered written questions about their educational level. WISC-IV assessments were carried out by experienced clinical psychologists with a specialization in neuropsychology, or by a supervised clinical psychology student trained to use these scales (WISC-IV) in a quiet room at the participant’s school.
Follow-up assessments
After the child was assessed and diagnosed with ADHD at baseline, all parents attended a psychoeducation program for parents of youth with ADHD, and most of the ADHD participants were started on an approved stimulant medication (81%). Approximately 3-4 years after the baseline assessment, participants in the ADHD and Control groups were invited for reassessment involving either the WISC-IV or WAIS-IV (n = 63/31 in the ADHD group, and 41/11 in the Control group), the SNAP-IV (parent version), and a written form comprised of dichotomous questions about their current status with respect to medication use, support from school, and school grades. In the ADHD group the parents also answered the question about special educational supports, and 80 parents and seven youths answered the question about grades. In the Control group, the youth answered the questions about grades and special educational supports. All ADHD participants were asked to stop taking any ADHD medication 24 hours prior to the follow-up assessment. The ADHD group were followed-up at the CAP clinic and the Control group in a quiet room at their school or at the CAP clinic. For both groups, the WISC-IV/WAIS-IV assessments were carried out by fully qualified neuropsychologists or supervised clinical psychology students trained to administer these scales.
Statistical analyses
Between group comparisons, differences between composites and logistic regression analyses were carried out using version 25 of SPSS (IBM Corp., Armonk, NY, USA). Linear mixed model regression analyses were carried out using version 9.4 of SAS (SAS Institute Inc., Cary, NC, USA). Between-group comparisons (ADHD vs Control group; completers vs dropouts) were analyzed with Chi-Square and Student's Independent t-tests. Linear mixed models with an autoregressive covariance structure were used to analyze change over time for the standardized composite scores between baseline and follow-up in the ADHD and control groups, as well as the difference between the slopes for the two groups, after controlling for the use of WAIS-IV in relation to WISC-IV. An interaction term between group and time was included to compare change over time for the two groups. Because of the impact of the attrition concerning the Wechsler composite scores, estimated and adjusted mean scores from the linear mixed models were used when comparing the mean scores between the two groups. Linear mixed models with an autoregressive covariance structure were also used in separate analyses of the dependent variables (i.e. the Wechsler composite scores at baseline and follow-up) with several independent variables. For the ADHD group, the independent variables were time (follow-up time in years), gender, use of the WAIS-IV versus WISC-IV, receipt of special educational supports, parental rating of ADHD symptom severity (SNAP-IV ADHD-combined score), and treatment with ADHD medication. For the Control group, the same independent variables were evaluated with the exception of parental ratings from the SNAP-IV and treatment with ADHD medication at follow-up. Unstandardized betas with corresponding 95% confidence intervals and p-values are reported.
Logistic regression models were used to identify ADHD symptom severity (SNAP-IV ADHD-Combined Score) and cognitive functioning (Wechsler scales) at either baseline or follow-up predicted school grades (dependent variable) at follow-up in the ADHD group (only). School grades was a dichotomized variable reflecting whether the participant had either a simple majority of passing grades or a simple majority of failing grades at follow-up. The predictor variables were added in two models, one with baseline scores from the SNAP-IV (ADHD-combined score) and Wechsler composite scores, and the other with the follow-up scores on these same measures. A number of controlling variables (assessed at baseline) were entered in each model: sex (being female); receiving special educational supports; assessment via the WAIS-IV (vs WISC-IV); parents’ education level; and scores on the Externalizing and Internalizing subdomains from the parent-rated FTF. Odds ratios with corresponding 95% CI’s and p-values are reported.
Results
Sociodemographic characteristics and attrition
Of the 125 participants in the ADHD group at baseline, 87 (70%) were boys compared to 31 of 59 (52%) participants in the Control group (χ2(1) = 5.1, p = .024). The gender ratio at the follow-up assessment was similar but with no significant differences. The two groups did not differ for age at baseline (ADHD = 11.40 (SD = 3.27), Controls = 11.97 (SD = 2.15)) or at follow-up (ADHD = 15.13 (SD = 2.98); Controls = 14.80 (SD = 2.03)). The two groups did not differ at baseline for parents’ level of education: primary school only (to age 16): ADHD = 11%, Controls = 4%; high school (age 16-19 years): ADHD = 46%, Controls = 35%; university or above: ADHD = 43%, Controls = 61% (χ2(2) = 5.3, p = .071). At follow-up, the ADHD and Control groups significantly differed with respect to the proportion of participants receiving special educational supports (ADHD = 59%, Controls = 23%; χ2(1) = 17.70, p = .001) and receiving a simple majority of passing grades (ADHD = 61%, Controls = 100%; χ2(1) = 19.92; p = .001).
There was no difference in the attrition rate between baseline and follow-up with 103/125 (82.4%) of the ADHD and 52/59 (88.1%) of the Control participants completing the baseline and follow-up assessments. However, ADHD participants lost to follow-up performed significantly worse than those who completed the follow-up assessment on the FSIQ (mean difference (M diff ) = 8.54; t(123) = 3,39; p = 0.001; 95% CI: 3.55, 13.52)), Verbal Comprehension (M diff = 7.57; t(123) = 2,81; p = 0.006;95% CI: 2.23,12.90), and Perceptual Reasoning (M diff = 7.89; t(123) = 2,79; p = 0.006; 95% CI: 2.29, 13.50). There were no significant differences between completers and non-completers of the follow-up assessments in the Control group for any of the IQ measures/composites. Table 1 presents the means and standard deviations for the Wechsler composite scores (FSIQ, Verbal Comprehension, Perceptual Reasoning, Working Memory, and Processing Speed), parent-rated SNAP-IV (ADHD-combined score) at baseline. Table 2 presents descriptive data for parent rated functional impairments at the baseline (FTF).
TABLE 1.
Means and standard deviations for scores on the Wechsler scales and SNAP-IV for ADHD and Control participants
| Groups | |||||||
|---|---|---|---|---|---|---|---|
| ADHD | Controls | ||||||
| Baseline measures | n | Mean (SD) | n | Mean (SD) | |||
| WISC-IV/WAIS-IV | 120/5 | 59/0 | |||||
| FSIQ | 125 | 88.90 (12.67) | 59 | 96.51 (9.71) | |||
| Verbal comprehension | 125 | 93.43 (13.36) | 59 | 95.12 (12.97) | |||
| Perceptual reasoning | 125 | 97.06 (14.04) | 59 | 101.41 (12.00) | |||
| Working memory | 125 | 82.03 (12.95) | 59 | 93.02 (10.45) | |||
| Processing speed | 124 | 88.69 (13.59) | 59 | 98.42 (11.06) | |||
| SNAP–IV | 116 | 30.69 (10.58) | 59 | 5.98 (6.81) | |||
| Percentiles | |||||||
|---|---|---|---|---|---|---|---|
| FTF variables | < 90 | ≥ 90 | < 98 | ≥ 98 | |||
| n | % | n | % | n | % | ||
| Motor skills | 67 | 60 | 35 | 31 | 10 | 9 | |
| EF | 14 | 12 | 62 | 55 | 36 | 32 | |
| Perception | 46 | 41 | 51 | 46 | 15 | 13 | |
| Memory | 39 | 35 | 58 | 51 | 16 | 14 | |
| Language | 54 | 48 | 40 | 35 | 19 | 17 | |
| Learning | 25 | 26 | 39 | 41 | 32 | 33 | |
| Social skills | 38 | 34 | 56 | 50 | 19 | 17 | |
| Externalized | 27 | 24 | 39 | 34 | 47 | 42 | |
| Internalized | 59 | 52 | 38 | 34 | 16 | 14 | |
| Compulsivity | 71 | 57 | 34 | 27 | 8 | 6 | |

| Dependent variable | Independent variables | Groups | |||||
|---|---|---|---|---|---|---|---|
| ADHD | Controls | ||||||
| T1, n = 90, T2, n = 93 | T1, n = 59, T2, n = 52 | ||||||
| Betaa | 95% CI | p−value | Betaa | 95% CI | p−value | ||
| FSIQ | Time (year) | −.93 | −1.51 ;−.35 | .002 | 1.10 | .41 ; 1.79 | .002 |
| Girls vs boys | 4.10 | −1.05 ; 9.25 | .117 | −1.37 | −6.65 ; 3.91 | .605 | |
| WAIS vs WISC | 3.11 | −.86 ; 7.07 | .119 | −.71 | −5.34 ; 3.92 | .740 | |
| Special education supports | −.95 | −5.80 ; 3.89 | .696 | −9.25 | −16.49 ; −2.02 | .013 | |
| SNAP IV T1, T2 b | −.08 | −.23 ; .06 | .250 | −.04 | −.54 ; .45 | .861 | |
| ADHD medication | 1.55 | −4.47 ; 7.56 | .611 | ||||
| Verbal comprehension | Time (year) | −.92 | −1.58 ;−.26 | .007 | 2.13 | 1.19 ; 3.06 | <.001 |
| Girls vs boys | 4.39 | −1.35 ; 10.12 | .132 | −3.75 | −10.27 ; 2.77 | .253 | |
| WAIS vs WISC | −5.79 | −10.31 ;−1.27 | .014 | −2.59 | −8.78 ; 3.60 | .374 | |
| Special education supports | −3.26 | −8.65 ; 2.13 | .232 | −6.71 | −15.65 ; 2.22 | .137 | |
| SNAP IV T1, T2b | −.02 | −.18 ; .15 | .821 | .14 | −.47 ; .75 | .654 | |
| ADHD medication | .50 | −6.20 ; 7.19 | .884 | ||||
| Perceptual reasoning | Time (year) | −.43 | −1.07 ; .21 | .184 | .88 | −.19 ; 1.94 | .104 |
| Girls vs boys | 1.73 | −4.21 ; 7.68 | .564 | −5.61 | −12.20 ; .98 | .093 | |
| WAIS vs WISC | .98 | −3.43 ; 5.38 | .653 | −2.48 | −9.45 ; 4.49 | .446 | |
| Special education supports | .29 | −5.87 ; 5.30 | .919 | −7.45 | −16.48 ; 1.58 | .104 | |
| SNAP IV T1, T2 b | .07 | −.09 ; .23 | .390 | .02 | −.60 ; .64 | .954 | |
| ADHD medication | 1.94 | −5.00 ; 8.89 | .579 | ||||
| Working memory | Time (year) | −.28 | −1.06 ; .50 | .484 | −.52 | −1.45 ; .41 | .268 |
| Girls vs boys | .77 | −3.95 ; 5.49 | .746 | 4.78 | .45 ; 9.11 | .031 | |
| WAIS vs WISC | 5.35 | .30 ; 10.40 | .039 | 3.59 | −2.22 ; 9.40 | .198 | |
| Special education supports | −.48 | −4.92 ; 3.95 | .830 | −4.06 | −10.01 ; 1.88 | .176 | |
| SNAP IV T1, T2b | −.23 | −.41 ; −.06 | .009 | −.23 | −.64 ;.17 | .252 | |
| ADHD medication | −.79 | −6.28 ; 4.70 | .775 | ||||
| Processing speed | Time (year) | −1.37 | −2.21 ; −.53 | .002 | .30 | −.86 ; 1.47 | .602 |
| Girls vs boys | 6.19 | .70 ; 11.68 | .028 | 3.36 | −2.17 ; 8.89 | .228 | |
| WAIS vs WISC | 10.51 | 4.98 ; 16.04 | .001 | .09 | −7.18 ; 7.37 | .978 | |
| Special education supports | 3.02 | −2.14 ; 8.18 | .248 | −9.52 | −17.11 ; −1.94 | .015 | |
| SNAP IV T1, T2 b | −.12 | −.32 ; .07 | .212 | −.16 | −.68 ; .36 | .538 | |
| ADHD medication | 2.91 | −3.48 ; 9.30 | .369 | ||||
| Model statistics | Variables | Odds Ratio | 95% CI | p-value |
|---|---|---|---|---|
| T1 Measures | SNAP-IV T1 | .99 | .94 ; 1.04 | .678 |
| Χ2 = 5.86 | Verbal comprehension | 1.05 | 1.00 ; 1.10 | .031 |
| df = 5 | Perceptual reasoning | .99 | .96 ; 1.04 | .788 |
| p for model = .32 | Working memory | .98 | .94 ; 1.02 | .335 |
| Nagelkerke R2 = .094 | Processing speed | 1.00 | .97 ; 1.04 | .815 |
| n = 82 | ||||
| T2 Measures | SNAP-IV T2 | .92 | .87 ; .98 | .007 |
| Χ2 = 23.80 | Verbal comprehension | 1.11 | 1.04 ; 1.19 | .001 |
| df = 5 | Perceptual reasoning | 1.01 | .96 ; 1.07 | .624 |
| p for model < .001 | Working memory | .95 | .89 ; 1.00 | .073 |
| Nagelkerke R2 = .356 | Processing speed | 1.00 | .96 ; 1.04 | .897 |
| n = 79 |