
TABLE 1.
Comparing means by t-tests
| DSH (n=649 ) | No DSH (n=2978 ) | p-value | |||
|---|---|---|---|---|---|
| Variable | n | mean | n | mean | |
| Female | 468 | 72,1% | 1304 | 43.8% | <.0001 |
| Suicide attempted (age 18) | 125 | 19,5% | 19 | 0.6% | <.0001 |
| Mental disorder or psychotropic drugs (age 0–18) | 299 | 47,1% | 395 | 13.5% | <.0001 |
TABLE 2.
DSH and ADHD
| n | Pct. of sample (n=3627) | Pct. of reported | DSH Pct. of ADHD diagnosed | Pct. of ADHD symptoms | |
|---|---|---|---|---|---|
| DSH, total | 649 | 17.9% | 100% | 34.9% | 28.8% |
| ADHD diagnosed | 95 | 2.5% | 4.6% | 100% | 6.3% |
| ADHD symptoms | 1037 | 27.7% | 43.5% | 68.4% | 100% |
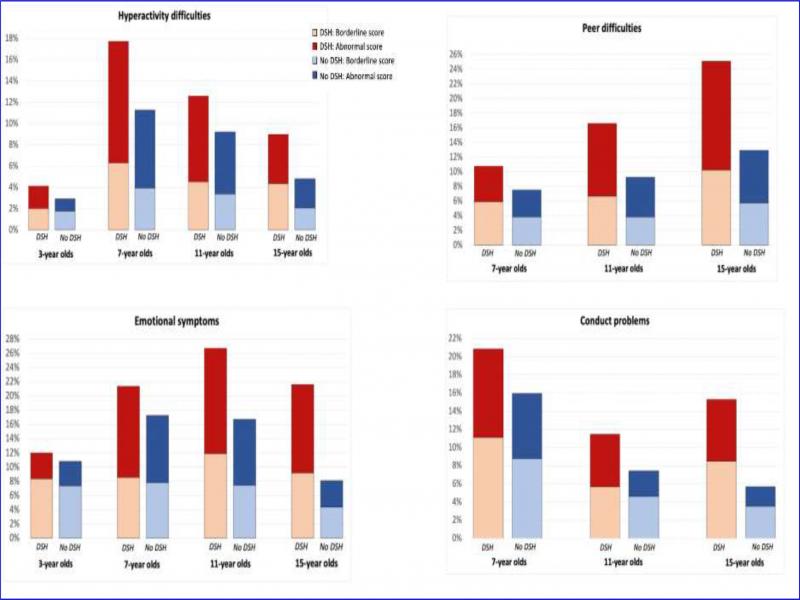
FIGURE 1.
SDQ 1999–2011
TABLE 3.
Logistic regression of the specified model
| Analysis of maximum likelihood estimates | |||||
|---|---|---|---|---|---|
| Parameter | Estimate | Standard Error | Wald Chi-Square | Pr > ChiSq | |
| intercept | -1.9419 | 0.0954 | 414.0452 | <.0001 | |
| female | 0 | -0.6679 | 0.0543 | 151.4615 | <.0001 |
| Hyperactivity difficulties, 3 years | 0.0685 | 0.0325 | 4.4403 | 0.0351 | |
| Hyperactivity difficulties, 7 years | 0.0841 | 0.0224 | 14.1493 | 0.0002 | |
| Peer difficulties, 7 years | 0.0839 | 0.0388 | 4.6803 | 0.0305 | |
| Parents divorced | 0 | -0.2348 | 0.0593 | 15.6575 | <.0001 |
| Maternal smoking | 0 | -0.2211 | 0.0503 | 19.3254 | <.0001 |
| Maternal mental health, 3-7 years | 0.1205 | 0.0462 | 6.7893 | 0.0092 | |
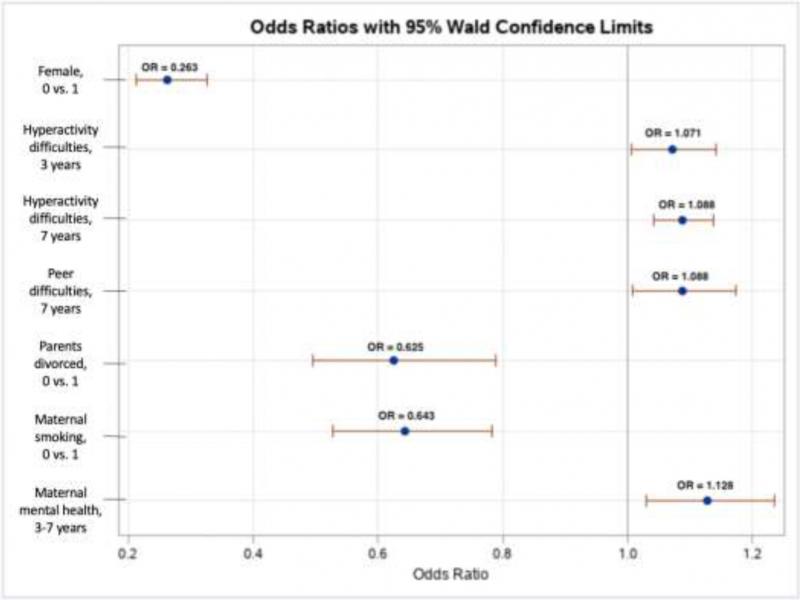
FIGURE 2.
Odds ratios from the logistic regression of the specified model
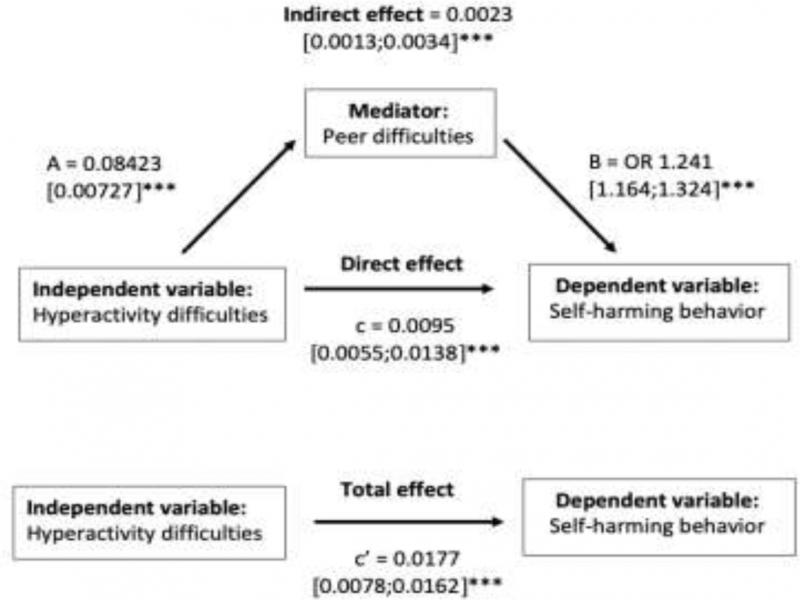
FIGURE 3.
Mediation analysis
Note. ***= p < 0.0001; Each arrow represents a regression model (Baron & Kenny, 1986). A was performed as a linear regression with the following control variables: gender, maternal smoking, maternal mental health, parents’ divorce. B was performed as a logistic regression, involving the same controls. The mediation analysis was performed as a bootstrap, and the parentheses shown are bootstrap CI. Percentage mediated = 19.3***