
Introduction
Food blogs are a common source of meal ideas in the United States, particularly among Internet users 18 to 34 years of age (Doub, Small, Levin, LeVangie, & Brick, 2016). Food blogs feature recipes, product reviews, and personal stories that further establish a blogger’s audience credibility and relatability (Doub, Small, & Birch, 2016a; Lepkowska-White & Kortright, 2018; Lynch, 2012; Schneider, McGovern, Lynch, & Brown, 2013). Popular food bloggers are known as social media influencers, meaning they have the capacity to shape the attitudes and behaviors of individuals who interact with their content (Freberg, Graham, McGaughey, & Freberg, 2011). Relatedly, food blogs that are considered influential based on metrics such as large audience size or high content engagement (e.g., number of comments on blog posts) are targeted for paid partnerships with corporate brands to promote products and services, a practice known as influencer marketing (Galeotti & Goyal, 2009; Lepkowska-White & Kortright, 2018; Stoldt, Wellman, Ekdale, & Tully, 2019). To date, research on food-related social media influencers has been limited, which is a critical gap given the potential reach and impact of nutrition information shared through blogs and social networking sites such as Twitter, Instagram, and Pinterest (Coates, Hardman, Halford, Christiansen, & Boyland, 2019; Korda & Itani, 2013; Li, Barnett, Goodman, Wasserman, & Kemper, 2013).
Although nutrition information can be widely disseminated on blogs and social networking sites (e.g., recommendations for or against specific foods, beverages, and eating behaviors), the quality of nutrition information shared on food blogs varies by blogger credentials (Chan, Drake, & Vollmer, 2018), recipe type (Schneider et al., 2013), and post topic (Doub, Small, & Birch, 2016a). Research identifying factors that influence the content and information design practices of food bloggers such as tone, recipe types, references, and use of photo and video, could guide nutrition education professionals toward understanding and improving the quality of nutrition information disseminated through blogs and social networking sites (Doub, Small, & Birch, 2016b; Dumas, Lapointe, & Desroches, 2018; Leak et al., 2014; Li et al., 2013; Shan et al., 2015; Tobey & Manore, 2014). Importantly, theory and experimental research indicate eating behavior is influenced by behaviors espoused by popular and relatable social models (Coates et al., 2019; Higgs, 2015; König, Giese, Stok, & Renner, 2017), highlighting the need for research that determines how social media influencers generate ideas for the content they share. As a first step, formative research on the community structure of food bloggers is needed to describe how bloggers connect to each other, as these connections create opportunities for bloggers to observe and spread content and information design practices (Agarwal, Liu, Tang, & Yu, 2012; Pei, Muchnik, Tang, Zheng, & Makse, 2015; Sosa, 2010).
Previous research on blogs focused on food (Lepkowska-White & Kortright, 2018), wine (Marlowe, Brown, Schrier, & Zheng, 2017), and travel (Azariah, 2012) suggests that bloggers use social networking sites to promote content from their blogs and establish audience credibility. However, little is known about patterns of social relationships among social media influencers, including popular food bloggers, on social networking sites. Such research could reveal connections that facilitate or inhibit the spread of content and information design practices among influencers that ultimately influence appetite. The current study begins to address this gap by leveraging social network analysis and theoretical frameworks of social relationships to explore and interpret patterns of connections among food bloggers on Twitter.
Social Networking Sites Facilitate Connections Among Bloggers
To establish themselves as social media influencers, bloggers must display their identities in an authentic manner online, learn and meet the professional standards of the blogging community, and develop strategies (often commercialized) to maximize audience engagement (Blum-Ross & Livingstone, 2017). Forming connections with other bloggers is thus critical as bloggers assert themselves as a part of a community of social media influencers (Agarwal et al., 2012; Kozinets, de Valck, Wojnicki, & Wilner, 2010). Historically, bloggers first connected to other bloggers by commenting directly on each other’s blog posts and referring readers to recommended blogs on blogrolls (Schmidt, 2007). Bloggers also connect through social networking sites (Park, Ok, & Chae, 2016). Blogs and social networking sites are interconnected through “social plug-in” features, which allow users to easily navigate to a blogger’s content across multiple platforms. For example, bloggers can include hyperlinks to their social networking site profiles on their blog homepages. Similarly, bloggers can include a hyperlink to their blog homepages in their social networking site profiles. Social networking sites thus play an increasingly important role in connecting bloggers to each other and in helping bloggers establish their online presence (Liang & Kee, 2018).
Social networking sites provide venues for bloggers to assert themselves as a part of a community of social media influencers by building following relationships (signaling outreach to other users) and follower relationships (signaling popularity among other users). Bloggers can also use social networking sites to establish opinion leadership through contributing original content and endorsing, replying to, or disseminating content created by other bloggers (Doub, Small, & Birch, 2016b; Hanna, Rohm, & Crittenden, 2011; Walden, 2013). To better understand how food bloggers use social networking sites to connect to each other and build influence, research is needed that describes the network structure of blogger connections on social networking sites. Research is also needed to test how social networking site use is associated with outreach and popularity among fellow bloggers and among all social networking site users.
Social Network Analysis in the Context of Twitter
Social network analysis is an ideal analytic approach for research questions concerning the structure and patterns of connections within communities (Borgatti, Everett, & Johnson, 2013; Wasserman & Faust, 1994). Social network analysis allows researchers to quantify structural characteristics of individual network members’ (i.e., actors’) positions in the network (e.g., degree centrality measures of outreach and popularity), characteristics of connections (i.e., ties) between network members (e.g., tie reciprocity), and characteristics of the whole network (e.g., density of ties). This study used social network analysis to quantify structural characteristics of a network of food bloggers on Twitter.
Content creators, including bloggers, seeking to become influencers often promote their own content on social networking sites and reciprocally promote each other’s content (Boyd, Golder, & Lotan, 2010; Lewis, Holton, & Coddington, 2014). Twitter has specific platform affordances that enable two users to easily observe and spread each other’s content, without requiring tie reciprocity (Ellison & boyd, 2013). In the context of Twitter, following relationships are directed ties that signal outreach, meaning Blogger A follows Blogger B’s content. Follower relationships are directed ties that signal popularity, meaning Blogger B’s content is followed by Blogger A. Analyzing the reciprocity of Twitter following and follower relationships using social network analysis can shed light on the hidden community structures of groups of Twitter users with common yet diverse interests, including food bloggers (Himelboim, 2017; Shi & Macy, 2016).
Social Relationships: Capital, Resources, and Homophily
The current study drew upon three theoretical frameworks of social relationships to explore and interpret patterns of connections among food bloggers on Twitter: Social capital (Lin, 1999, 2002), conservation of resources (Hobfoll, Freedy, Lane, & Geller, 1990), and homophily (McPherson, Smith-Lovin, & Cook, 2001; Rogers & Bhowmik, 1970). Social capital broadly relates to an individual’s motivation to form social relationships to gain access to resources (Lin, 1999, 2002). Some existing research suggests a positive association between social networking site use and perceived social capital. For example, Facebook users who engaged in relationship maintenance behaviors, such as responding to their friends’ good news or information requests, reported higher perceptions of social capital specific to Facebook and social capital generally than users who did not engage in these maintenance behaviors (Ellison, Vitak, Gray, & Lampe, 2014). Food bloggers seeking to establish influence by using Twitter may be motivated to be maximally connected to other bloggers to gain access to resources that promote social capital (and commercialization potential), such as amplified visibility through cross-promotion (e.g., retweets, mentions) and content engagement (e.g., favorites, comments).
Another helpful lens to understand connections among bloggers is the conservation of resources framework, which suggests social ties carry personal costs alongside potential resources (Hobfoll et al., 1990). Bloggers may expect promotion and endorsements in return for those they provide on Twitter, which take time and attention (Lee & Sundar, 2013). Bloggers are also expected to follow norms within communities of like-interested bloggers (Kozinets et al., 2010). Consequently, there may be some missing connections due to anticipated costs. Existing findings on whether connections among bloggers support the conservation of resources framework have been mixed. For example, in a study of wine bloggers, blog readership and incoming comments were positively associated with measures of outreach and input (e.g., reading other blogs, outgoing comments, time spent on blogging, posting frequency), suggesting increasing returns on investments (Marlowe et al., 2017). In contrast, a study of mom bloggers found that 41.1% followed another blogger in this network on Twitter, and only 16.7% mentioned another blogger in this network on Twitter (Burton, Tew, & Thackeray, 2013), demonstrating a pattern of conservative connection and engagement. More research is needed to explore evidence of conservation of resources among prominent food bloggers.
Thirdly, the homophily framework (McPherson et al., 2001; Rogers & Bhowmik, 1970) proposes individuals selectively form relationships with similar individuals. Given the broad range of topics represented in food blogs, food bloggers may selectively establish Twitter following relationships with bloggers focused on similar topical subcategories, such as cooking method (e.g., baking, cooking), niche food interest (e.g., special diets such as gluten-free, cocktails), or cooking context (e.g., family cooking, regional cuisine; Schmidt, 2007). Previous research suggests that when individuals perceive fellow members of an online network as similar in background, they are more likely to feel supported by individuals in that network (Wright, 2012). The positive association between perceived similarity and social support has implications for how individuals structure and maintain social ties (McPherson et al., 2001). For example, bloggers may believe that connecting to bloggers who produce similar content would maximally amplify their visibility to interested audiences (e.g., through cross-promotion), or establish credibility through ties to popular bloggers in the same subcategory (Agarwal et al., 2012).
Together, these frameworks suggest three possible patterns of connections that were explored in the current study in a network of prominent food bloggers on Twitter: a) a maximally connected network, supporting social capital as bloggers seek to maximize access to potential resources by connecting to all other bloggers; b) a partially connected network in which bloggers do not show differential connections by topical subcategory, supporting conservation of resources without homophily as bloggers seek to minimize potential costs of maintaining social relationships, irrespective of topical subcategory; or c) a partially connected network in which bloggers are differentially connected based on topical subcategory, supporting conservation of resources with homophily as bloggers seek to minimize potential costs of maintaining social relationships, and selectively form ties to bloggers in the same topical subcategory.
Study Aims
The current study had two related exploratory aims that were examined using a social network analysis approach in a sampled network of 44 prominent food bloggers who had Twitter profiles. All bloggers in the study were nominated for a “Best Food Blog” award within eight topical subcategories of food blogs by a popular food-related media company, Saveur (Saveur, 2014). Bloggers comprised a one-mode social network (i.e., bloggers connected to bloggers) with directed ties indicating Twitter following and follower relationships. The first aim was to explore structural evidence of social capital, conservation of resources, and homophily, as described above. To further explore structural evidence supporting the social capital or conservation of resources frameworks, the second aim was to test the association between Twitter use (i.e., number of tweets, favorited tweets) and centrality characteristics (i.e., outreach and popularity) within the sampled network of food bloggers and among all Twitter users.
METHODS
Sample
To identify a complete network of prominent food bloggers who had a presence on Twitter and focused on topics that were divided into subcategories, the first author screened the nominees for Saveur’s 2014 fifth annual food blog award competition for study inclusion (Saveur, 2014). Saveur is a popular food-related media company with digital and physical publications (e.g., a website, social media profiles, and magazine). Blogs that published new content between January 1, 2013 and December 31, 2013 were eligible for an award nomination by blog readers into one or more subcategories of food blogs: Baking and desserts, cocktails, cooking, culinary travel, family cooking, new blog, original recipes, photography, regional cuisine, special diets, use of video, wine or beer, and writing. Nominations were held from March 31, 2014 through April 9, 2014 and the final nominees (75 unique bloggers) were announced on April 14, 2014. Saveur editors, previous Saveur food blog award competition winners in each subcategory, and blog reader nominations determined six final nominees in each subcategory.
Sixty-nine out of 75 unique bloggers had Twitter profiles at the time data was collected for the current study (January, 2015). Bloggers nominated for subcategories related only to individual blog or blogger characteristics (i.e., new blog, original recipes, photography, use of video, and writing) rather than for topical blog content were excluded (n = 24). One additional blogger was excluded because they had over four standard deviations above the mean for overall following relationships on Twitter, which may have indicated the account was automated rather than personally maintained. Thus, the final sample included 44 food bloggers who had publicly available Twitter profiles and focused on eight topical subcategories: Baking and desserts (n = 6); cocktails (n = 6); cooking (n = 6); culinary travel (n = 5); family cooking (n = 5); regional cuisine (n = 5); special diets (n = 6); and wine or beer (n = 5). NodeXL (Smith et al., 2010), a software program for social media data collection and analysis, was used to create an adjacency matrix that contained data on the directed Twitter following and follower ties among the 44 bloggers. Review by the authors’ respective Institutional Review Boards was not required for this study because information made publicly available on the Internet was not considered human subjects research, as per the United States Department of Health and Human Services guidelines (U.S. Department of Health and Human Services, 2016).
Measures
Structural measures of the network: Centrality, reciprocity, and density. The following structural measures of the social network were calculated using UCINET 6 (Borgatti, Everett, & Freeman, 2002), a social network data analysis software program:
In-degree centrality. In-degree centrality is an actor-level, structural measure of popularity (Wasserman & Faust, 1994). Raw in-degree centrality is the sum of the directed ties present in a network that terminate at a given actor. For comparison purposes, the raw value is standardized by dividing by one less than the total number of actors in the network. In the current study, standardized in-degree values represented the proportion of other bloggers following a given blogger in the network (i.e., Twitter follower relationships). Bloggers with higher standardized in-degree values had more incoming Twitter follower relationships with other bloggers in the network. In tables, in-degree centrality is referred to as “Saveur Network Followers.”
In-degree centralization is a complementary network-level, structural measure of the focal organization of actors in the network (Freeman, 1979). In-degree centralization values range from 0.00 to 1.00, with lower values indicating more egalitarian networks. In the current study, an in-degree centralization value of 0.00 indicates a completely egalitarian network in which all bloggers are connected through Twitter follower relationships. An in-degree centralization value of 1.00 indicates a star network in which a single focal blogger connects to all other bloggers through Twitter follower relationships, but these other bloggers do not connect to one another.
Out-degree centrality. Out-degree centrality is an actor-level, structural measure of expansiveness (i.e., outreach; Wasserman & Faust, 1994). Raw out-degree centrality is the sum of the directed ties present in a network that originate at a given blogger. For comparison purposes, the raw value is standardized by dividing by one less than the total number of actors in the network. In the current study, standardized out-degree values represented the proportion of other bloggers a given blogger followed (i.e., Twitter following relationships). Bloggers with higher standardized out-degree values had more outgoing Twitter following relationships with other bloggers in the network. In tables, out-degree centrality is referred to as “Saveur Network Following.”
Out-degree centralization is a complementary network-level, structural measure of the focal organization of actors in the network (Freeman, 1979). Out-degree centralization values range from 0.00 to 1.00, with lower values indicating more egalitarian networks. In the current study, an out-degree centralization value of 0.00 indicates a completely egalitarian network in which all bloggers are connected through Twitter following relationships. An out-degree centralization value of 1.00 indicates a star network in which a single focal blogger connects to all other bloggers through Twitter following relationships, but these other bloggers do not connect to one another.
Dyad reciprocity. Dyad reciprocity is a network-level measure of mutuality; it refers to the proportion of ties that are mutually endorsed within the network (Wasserman & Faust, 1994). Values range from 0.0 to 1.0. A value of 1.0 indicates all ties are reciprocated. In this study, dyad reciprocity was calculated as the proportion of blogger dyads that had reciprocal Twitter following relationships.
Density. Density is a network-level measure of connectivity; it refers to the proportion of observed directed ties divided by the number of all possible directed ties in a network or subgroup (Wasserman & Faust, 1994). Density values range from 0.0 to 1.0. A value of 1.0 indicates a maximally connected network. In this study, density was calculated two ways. First, it was calculated as the number of ties present in the entire network divided by the total number of all possible ties in the entire network. Higher density values indicate a more connected network. Secondly, density was calculated for subgroups of food bloggers defined by their topical subcategories (i.e., the number of ties present among bloggers in the same topical subcategory divided by the total number of all possible ties among bloggers in the same topical subcategory). Higher density values among bloggers in the same topical subcategory indicates homophily.
Twitter use and Twitter centrality. During initial data collection, NodeXL was used to collect the following attribute data for each blogger in the network: Number of tweets posted; number of favorited tweets (outgoing) among all Twitter users (referred to in tables as, “Number of favorited tweets”); number of Twitter following relationships among all Twitter users (referred to in tables as, “Overall Twitter following”); and number of Twitter follower relationships among all Twitter users (referred to in tables as, “Overall Twitter followers.”)
Analyses
Network visualization. The structure of the Saveur network was visualized as a sociogram in the Fruchterman-Reingold layout (Fruchterman & Reingold, 1991) using the igraph software package (Csardi & Nepusz, 2006) implemented in the R statistical programming environment (R Core Team, 2018).
Aim 1. To address Aim 1 (explore structural evidence of social capital, conservation of resources, and homophily), in-degree and out-degree centrality, in-degree and out-degree centralization, network-level density, and dyad reciprocity were calculated. Additionally, the density of directed ties within and between subgroups of bloggers defined by their topical subcategory were calculated and a structural blockmodel ANOVA density test was conducted to evaluate the null hypothesis that there was no evidence of homophily (i.e., more dense ties) among food bloggers by topical subcategory. A structural blockmodel ANOVA density test is a permutation-based test that compares the observed density of ties between dyads in the same and different subgroups to randomly generated density values (Hanneman & Riddle, 2005). The ANOVA density test was conducted in UCINET 6 using 10,000 permutations. Results were considered significant at p < .05.
Aim 2. To address Aim 2 (test the association between Twitter use, outreach, and popularity), quadratic assignment procedure (QAP) correlations (Hubert & Schultz, 1976) were calculated among the following blogger attributes: Number of tweets posted, number of favorited tweets, overall Twitter following relationships, overall Twitter follower relationships, Saveur network following relationships, and Saveur network follower relationships. QAP correlation is a permutation-based analysis that accounts for interdependence in social network data by analyzing actor attributes as an adjacency matrix of difference scores (Hubert & Schultz, 1976). QAP correlations were conducted in UCINET 6 using 10,000 permutations. Results were considered significant at p < .05.
RESULTS
Social Network Structure of Food Bloggers on Twitter
The network of 44 food bloggers representing eight topical subcategories is displayed in Figure 1. There were 388 directed Twitter following ties present in this network of food bloggers. At the actor-level, the average raw in-degree was 8.6 (SD = 6.7; Range = 0 to 22; Median = 7). The average standardized in-degree was 20% (SD = 16%; Range = 0% to 51%; Median = 16%). These results revealed variance in blogger popularity: Some food bloggers were followed by over half of the other bloggers in the network on Twitter, while some were not followed at all. The average raw out-degree was 8.6 (SD = 6.3; Range = 0 to 20; Median = 10). The average standardized out-degree was 20% (SD = 15%; Range = 0% to 47%; Median = 23%). These results revealed variance in blogger outreach: Some food bloggers followed almost half of the other bloggers in the network on Twitter, while some followed none.
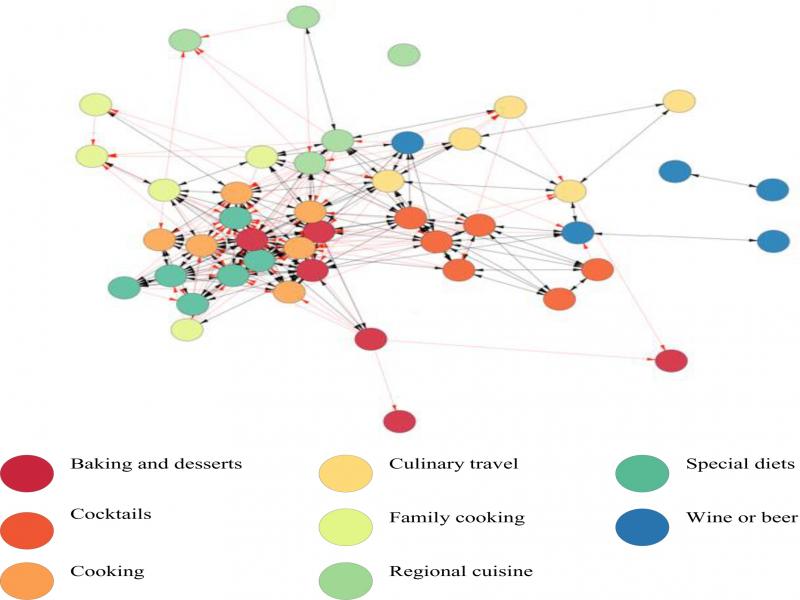
Figure 1.
Fruchterman-Reingold layout of directed Twitter following/follower ties among Saveuer network food bloggers (N = 44). Nodes represent individual food bloggers, color-coded by topical subcategory. Arrow color indicates tie reciprocity: Black arrows indicate reciprocal ties; Red arrows indicate unreciprocated ties. Node spacing is algorithmically determined by the density of ties.
At the network-level, in-degree centralization was 0.27 and out-degree centralization was 0.31, indicating that bloggers tended toward a more egalitarian network, but the network was not complete. The overall network density of directed ties was 21%, indicating approximately one-fifth of all possible directed ties were present in the network. Dyad reciprocity was 58%, indicating that over half of Twitter following relationships in the network were mutual.
Food bloggers with the highest popularity (i.e., bloggers with the top five standardized in-degree values) were in the cooking, baking and desserts, and special diets subcategories. The bloggers with the highest popularity were followed by 47% to 51% of other bloggers in the network. The food bloggers showing the most outreach (i.e., bloggers with the top five standardized out-degree values) were in the cooking and baking and desserts subcategories. Bloggers showing the highest outreach established following relationships with 40% to 47% of other bloggers in the network. Three out of five bloggers with the highest popularity also showed the most outreach. One food blogger, a representative of the regional cuisine subcategory, was the only isolate in the network. This blogger followed no one in the network, and no one else in the network followed this blogger on Twitter.
The density of directed ties within and between bloggers in each topical subcategory are displayed in Table 1. The structural blockmodel ANOVA density test revealed evidence of homophily within some, but not all, topical subcategories (R 2 = .30, p < .001). Differences in the density of directed ties by topical subcategory explained 30% of the variance in blogger-to-blogger ties. As indicated by density values significant at p < .05 (see Table 2), topical subcategory homophily was observed for cocktails, cooking, culinary travel, and special diets bloggers. Unexpectedly, results also showed a higher density of directed ties between bloggers in some different topical subcategories. Cooking bloggers had more Twitter following and follower relationships with special diets bloggers. Baking and desserts bloggers were more likely to be followed by cooking and special diets bloggers on Twitter. The high density of ties among baking and desserts, cooking, and special diets bloggers is reflected in the proximity of the individual blogger nodes in the network visualization (Figure 1).
Table 1.
Density of Directed Twitter Following and Follower Ties Among Food Bloggers Representing Eight Topical Subcategories of Food Blogs (N = 44)
| 1 | 2 | 3 | 4 | 5 | 6 | 7 | 8 | |
|---|---|---|---|---|---|---|---|---|
| 1. Baking and desserts | .43 | .14 | .58** | .03 | .20 | .07 | .50* | .07 |
| 2. Cocktails | .19 | 1.0*** | .19 | .07 | .03 | .10 | .14 | .17 |
| 3. Cooking | .47 | .08 | .83** | .20 | .23 | .03 | .58** | .00 |
| 4. Culinary travel | .13 | .10 | .13 | .65* | .04 | .12 | .07 | .08 |
| 5. Family cooking | .20 | .07 | .27 | .04 | .40 | .08 | .23 | .04 |
| 6. Regional cuisine | .13 | .13 | .27 | .16 | .08 | .40 | .17 | .04 |
| 7. Special diet | .39 | .03 | .64** | .03 | .03 | .00 | .70** | .00 |
| 8. Wine or beer | .10 | .13 | .03 | .08 | .04 | .04 | .00 | .20 |
| Attribute | Mean | Standard Deviation | Median | Range (min-max) | ||
|---|---|---|---|---|---|---|
| Number of tweets | 5667 | 6564 | 3075 | 132 to 27966 | ||
| Number of favorited tweets | 1197 | 1901 | 470 | 0 to 9595 | ||
| Overall Twitter following | 784 | 724 | 539 | 6 to 3199 | ||
| Overall Twitter followers | 3808 | 5022 | 2170 | 177 to 30529 | ||
| Saveur network following | 9 | 6 | 10 | 0 to 20 | ||
| Saveur network followers | 9 | 7 | 7 | 0 to 22 |
| Variable | 1 | 2 | 3 | 4 | 5 | 6 |
|---|---|---|---|---|---|---|
| 1. Number of tweets | -- | |||||
| 2. Number of favorited tweets | 0.39* | -- | ||||
| 3. Overall Twitter following | 0.58** | 0.02 | -- | |||
| 4. Overall Twitter followers | 0.60*** | 0.09 | 0.57*** | -- | ||
| 5. Saveur network following | -0.13 | 0.25* | -0.03 | -0.19 | -- | |
| 6. Saveur network followers | -0.13 | 0.32* | -0.18 | 0.09 | 0.73*** | -- |