
Introduction
Despite a downward trend in adolescent pregnancy since the 1990’s, pregnancy is still a relatively common occurrence among American teenagers. Approximately one in ten sexually active girls experience a pregnancy sometime during their teenage years – about 5% of adolescent females nationally (Guttmacher Institute, 2016). This prevalence makes the United States the leader in adolescent pregnancies amongst industrialized nations (Kearney & Levine, 2012). High incidence of teenage pregnancy is a public policy concern as teens experiencing pregnancy complete less schooling than their peers (Kane, Morgan, Harris, & Guilkey, 2013) and are more likely to struggle financially later in life (Assini-Meytin & Green, 2015). The pregnancy-related challenges faced by these girls often thwart regular school-going, leaving those who cut their education short vulnerable to employment and economic struggles in adulthood.
The support pregnant teens receive can help mitigate the negative repercussions of becoming pregnant. Pregnant teens have been found to rely on social supports more than older women experiencing pregnancies (Letourneau, Stewart, & Barnfather, 2004). Pregnant girls with broad social support networks report less stress and depression, and higher levels of contentedness and parenting abilities (Letourneau et al., 2004). Social connectedness is also an important factor in retaining teens in schools (Rumberger, 2011). As a population more at risk of drop out, pregnant teens may particularly benefit from school-based social support networks that encourage educational persistence. Indeed, a teen’s level of connectedness prior to pregnancy has been found to relate to her post-pregnancy educational attainment (Humberstone, 2018b).
Many of the obstacles that arise with a pregnancy can also impede one’s social interactions. Following pregnancy, teens may experience stigmatization, new educational environments and added responsibilities – all of which can alter the friendships they held prior to pregnancy. Past work has found that pregnant teens have less reciprocated friendships, and are less likely to be considered a friend by their peers than non-pregnant girls (Humberstone, 2018a). While this work elucidates friendship differences between pregnant and non-pregnant teens, its cross-sectional design looks only at social networks held after a pregnancy occurrence. Cross-sectional networks only capture information of the presence or absence of ties and position in the greater social network at one time. It is unable to account for the greater social tendencies within a school network that may drive change, or assess friendship stability across time. Further, as both friendship- and pregnancy-related challenges likely evolve over time, cross-sectional work may underestimate the extent of social disturbance pregnant teens face. More work is needed to understand how an individual’s network evolves following a pregnancy, and how this evolution may vary across different school environments within which pregnant girls are socially embedded.
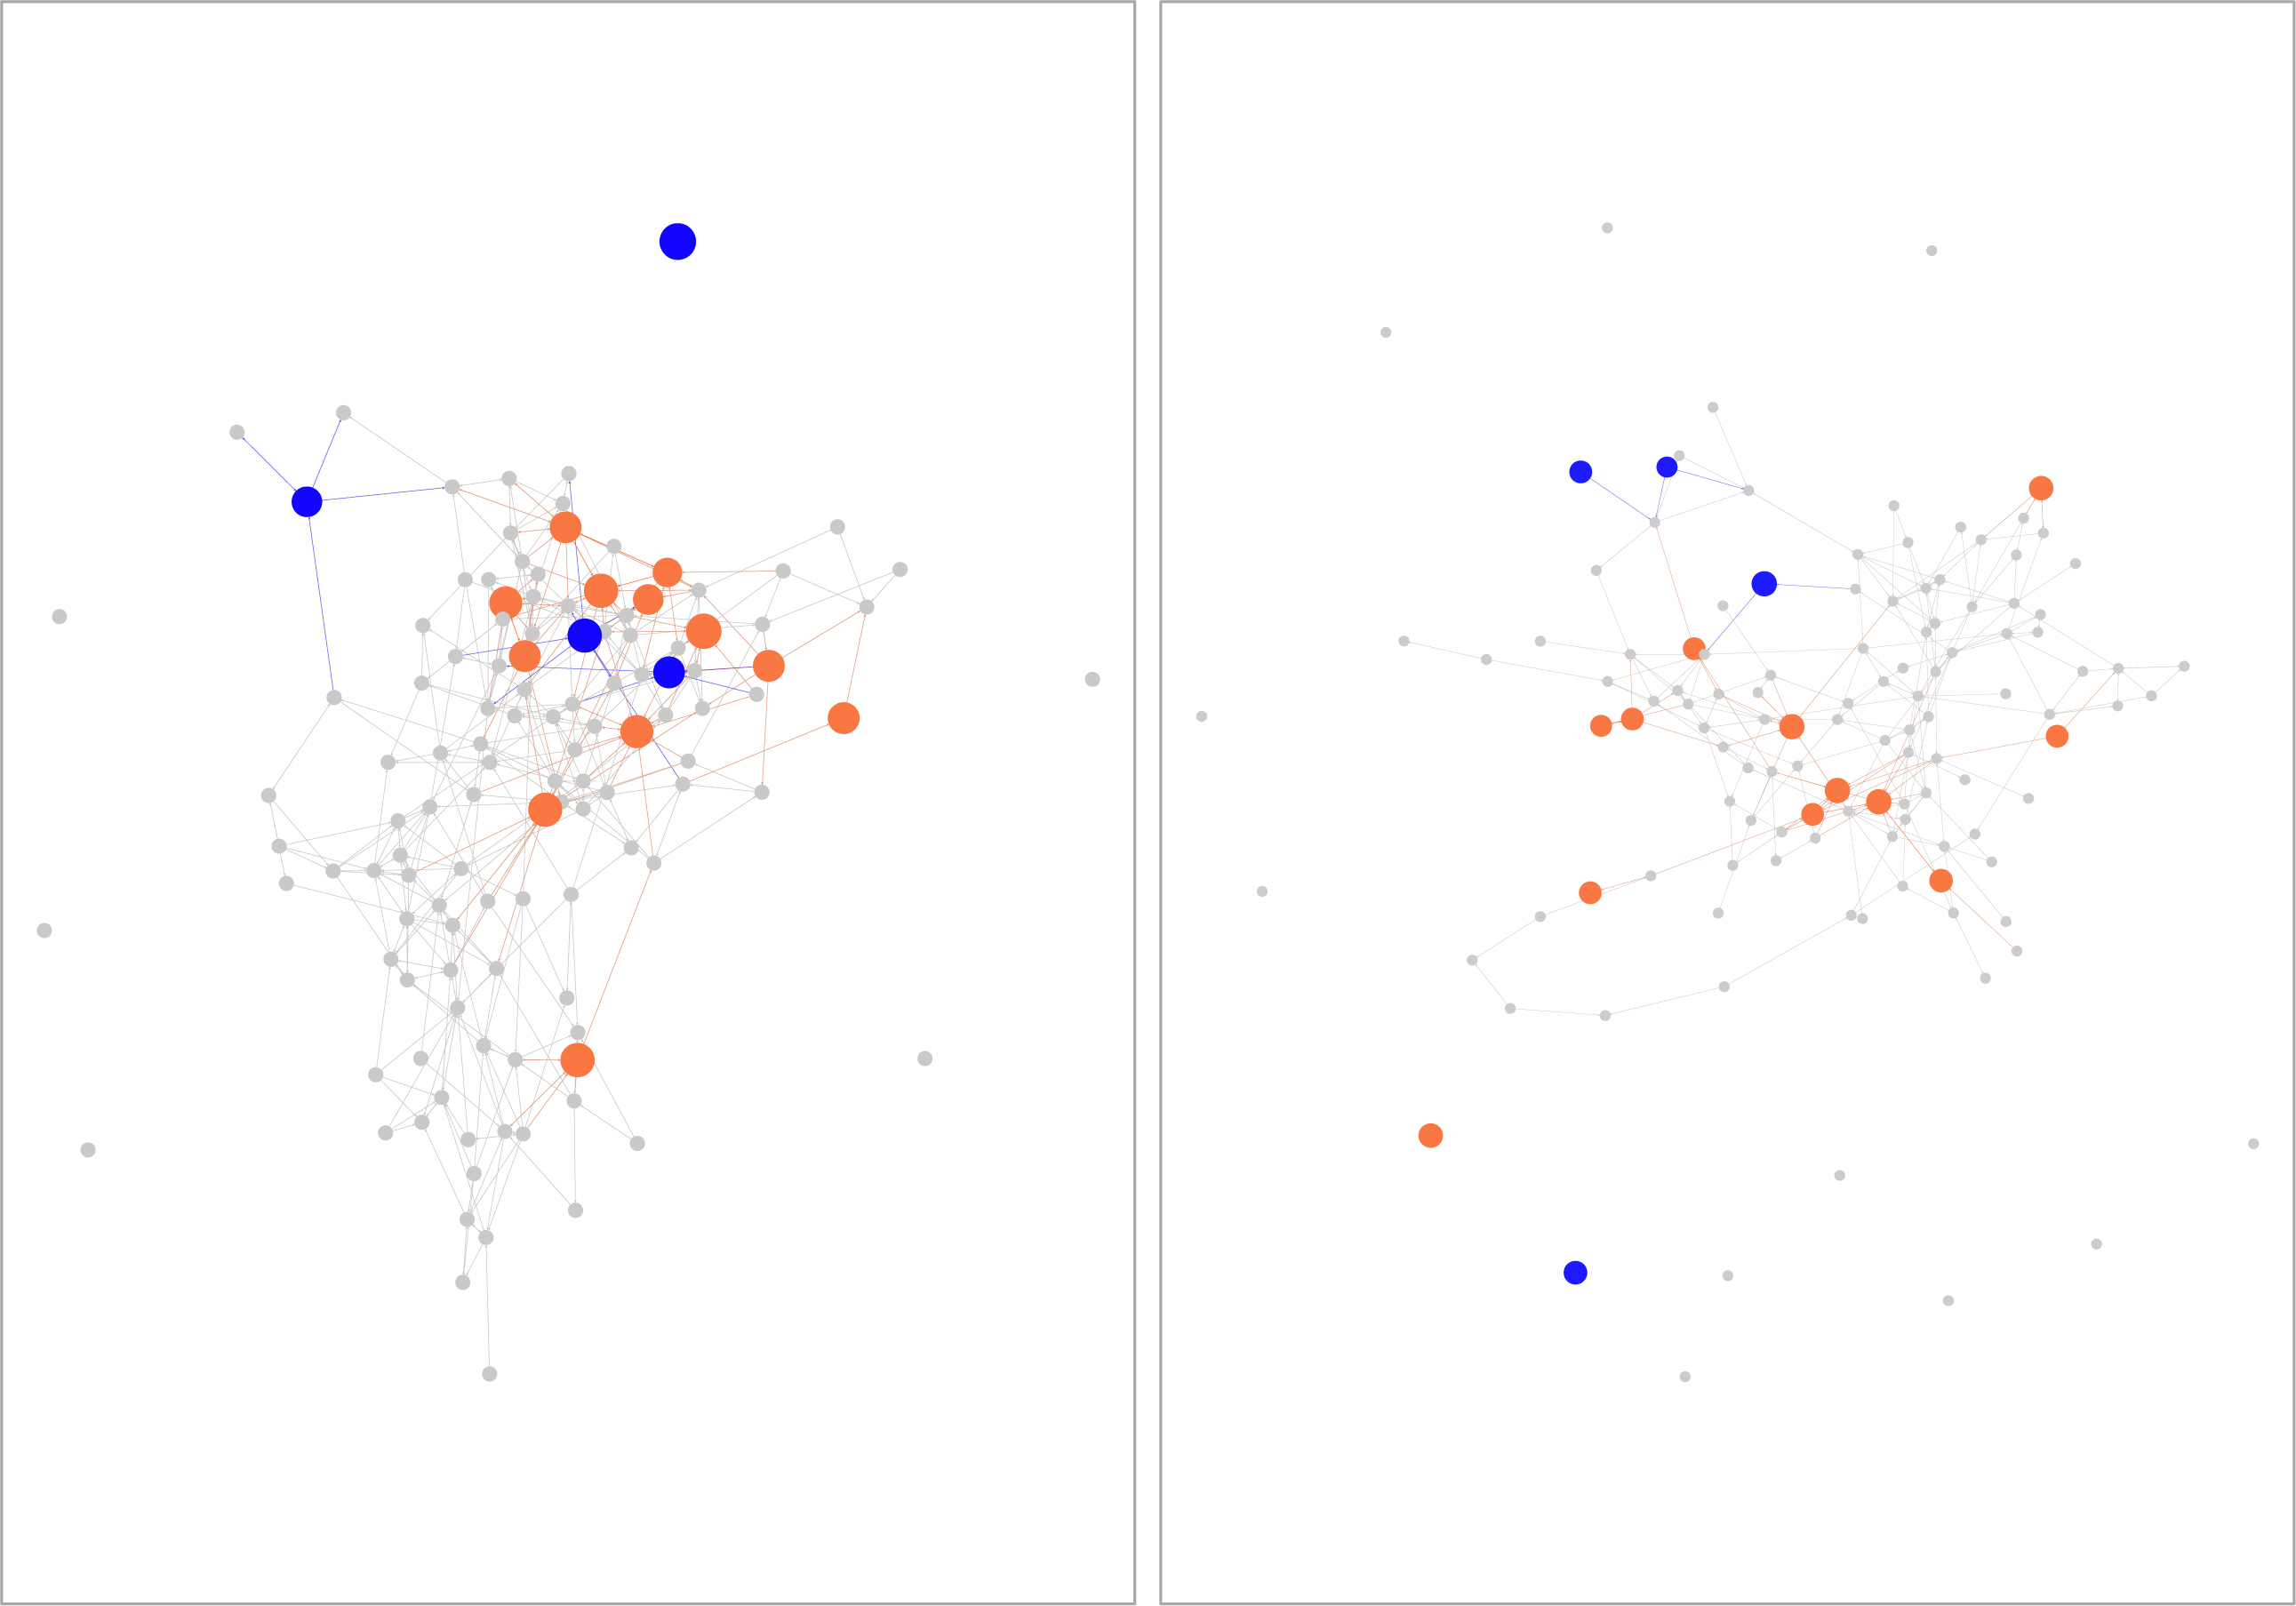
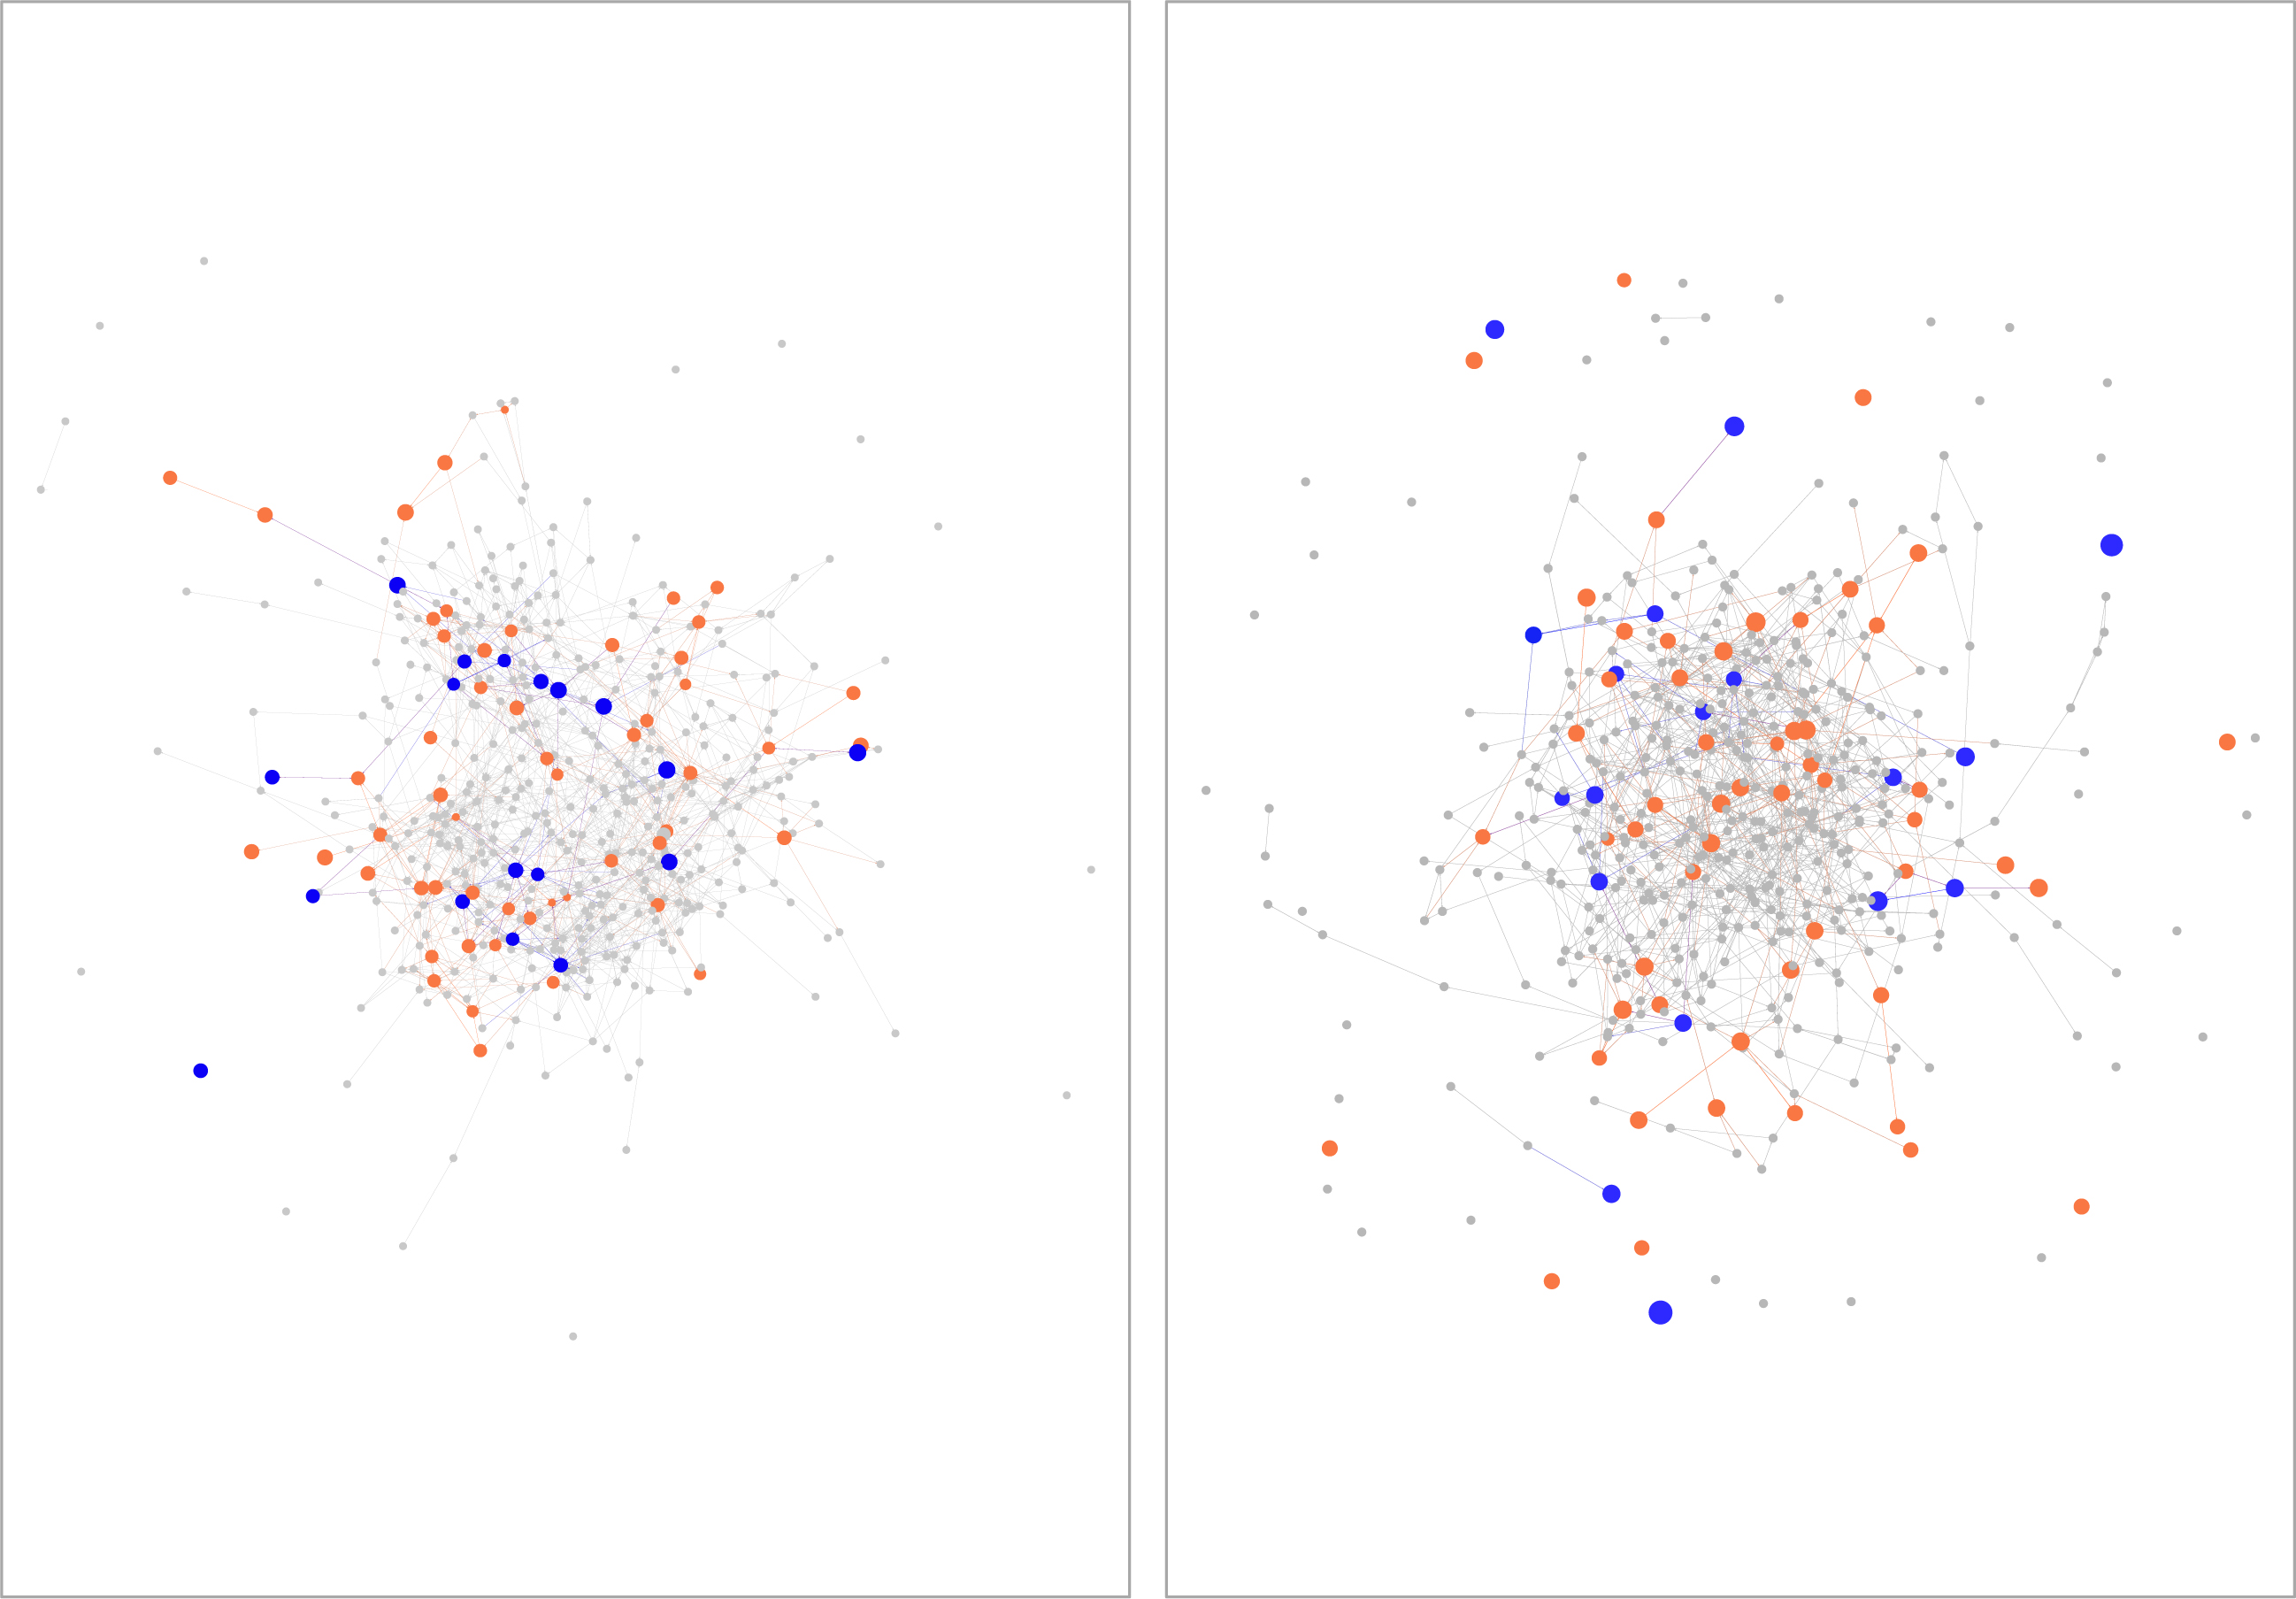
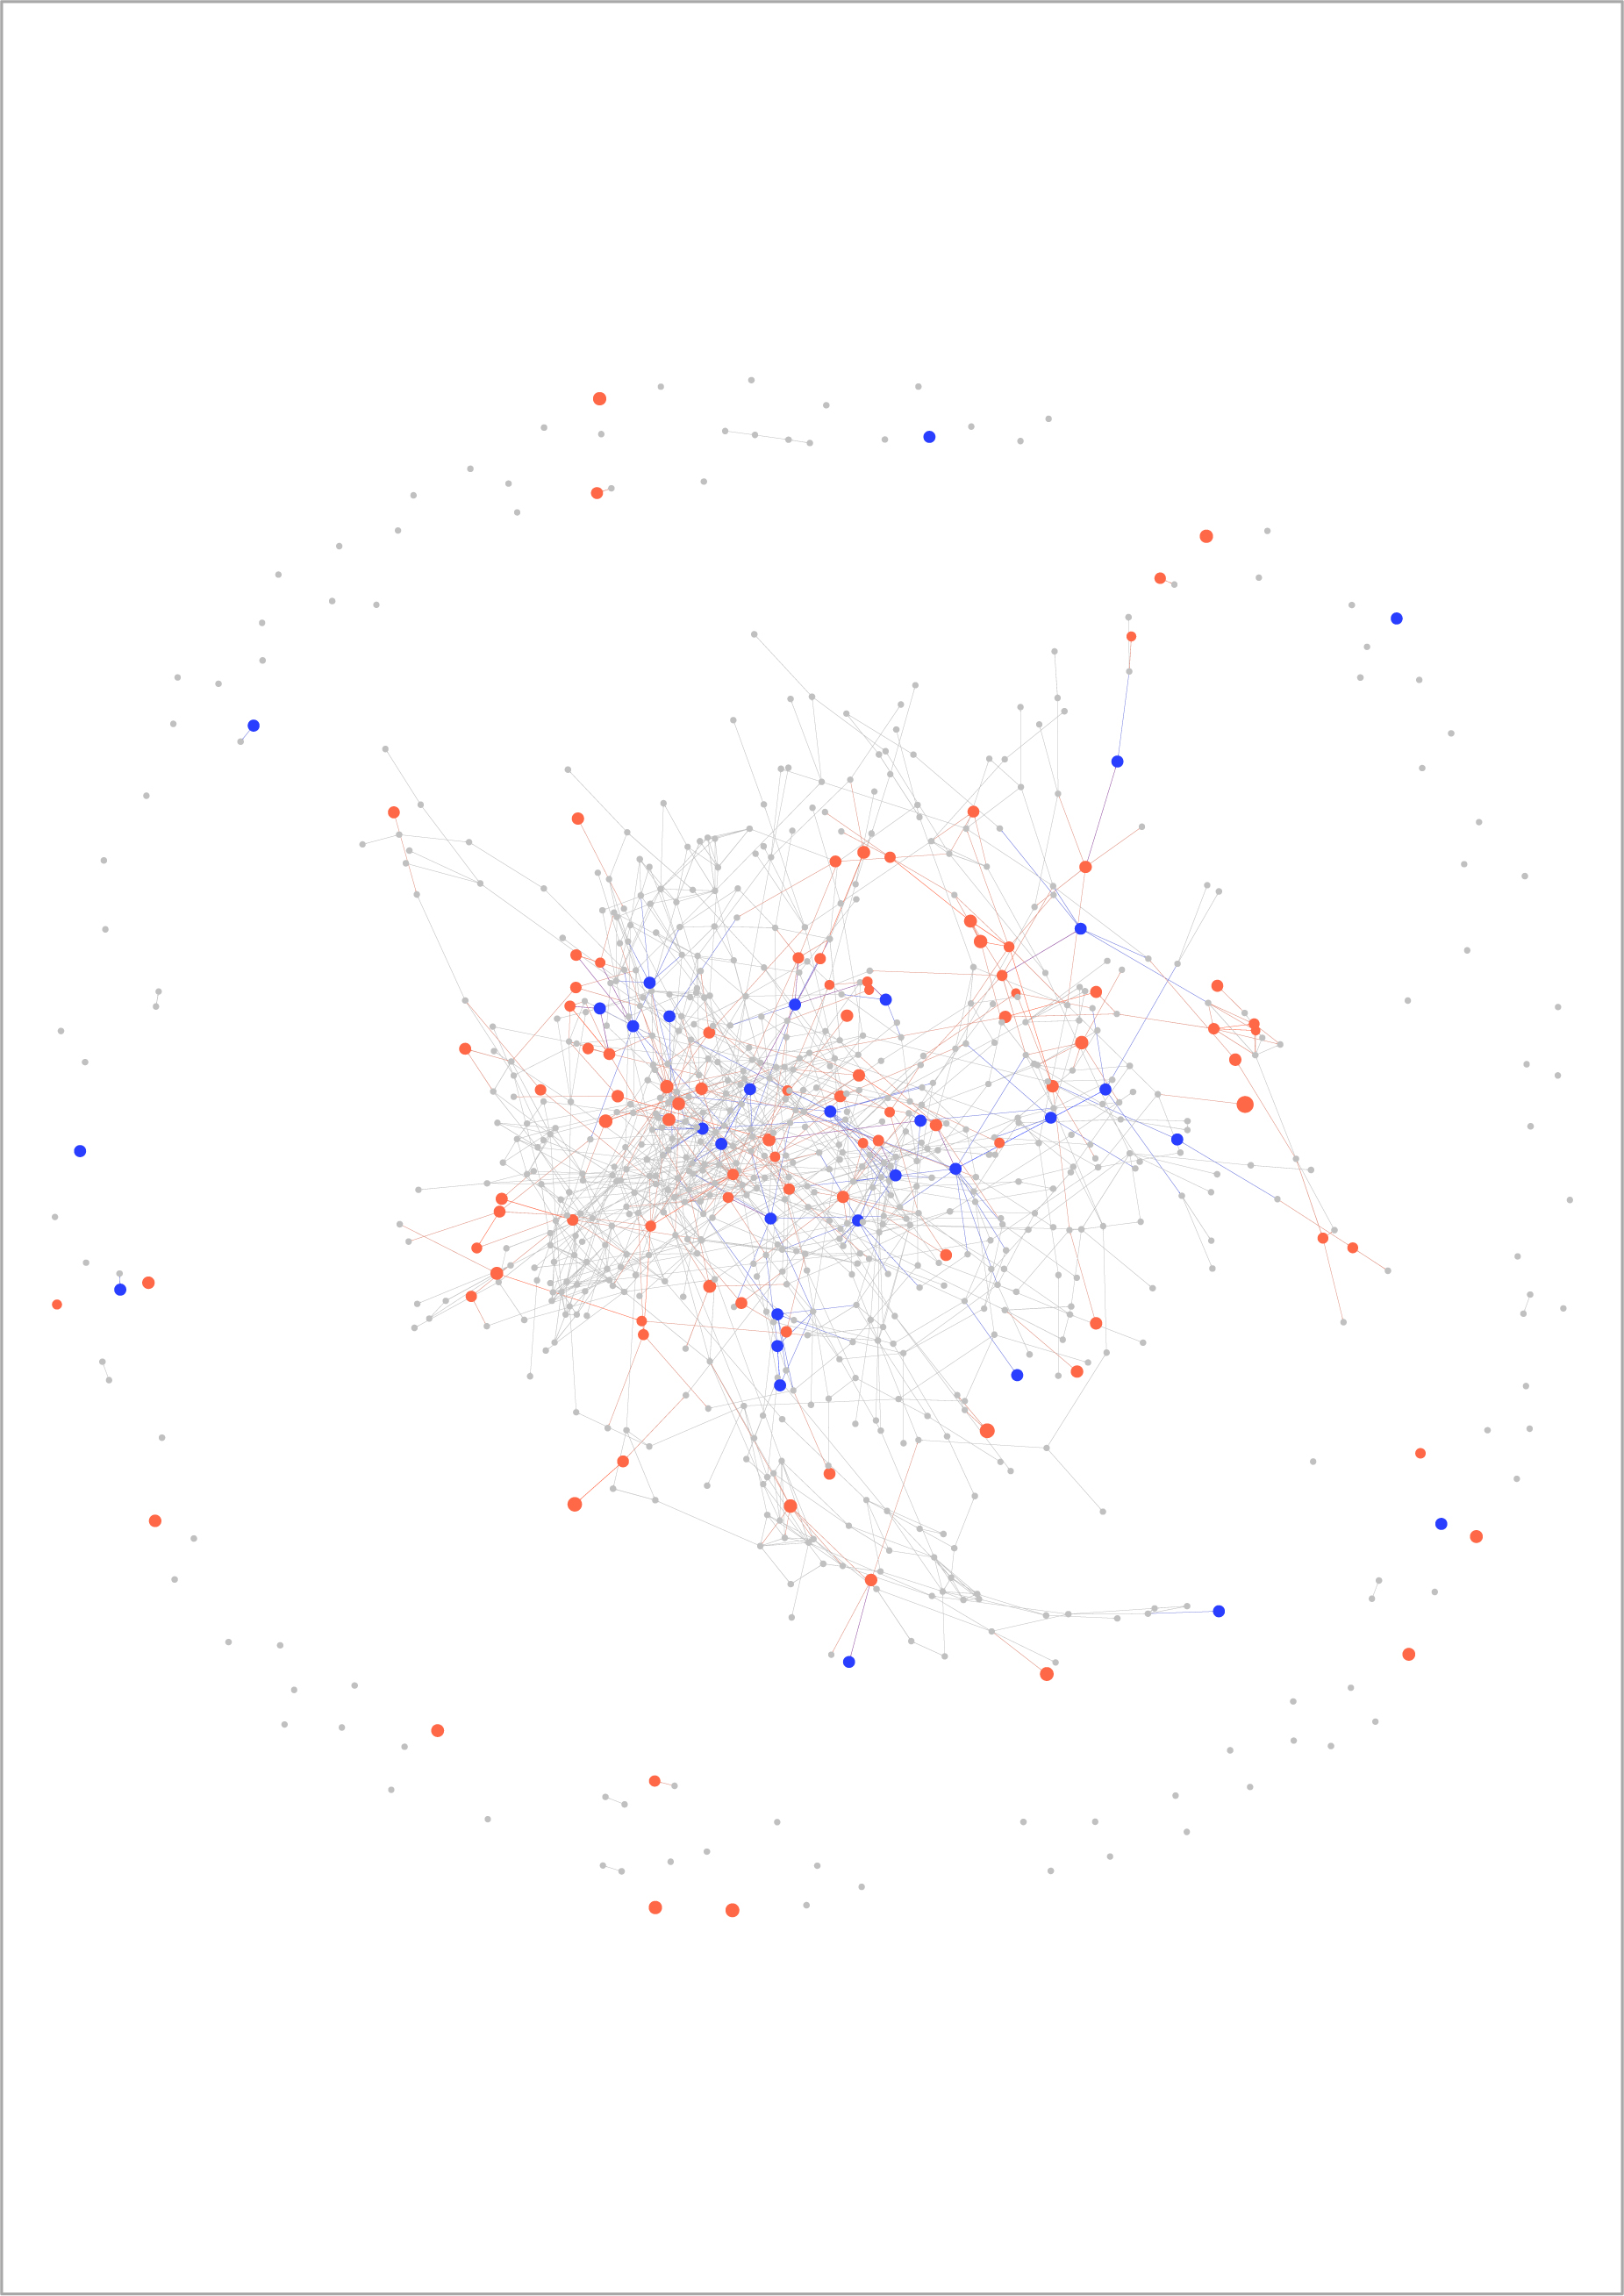
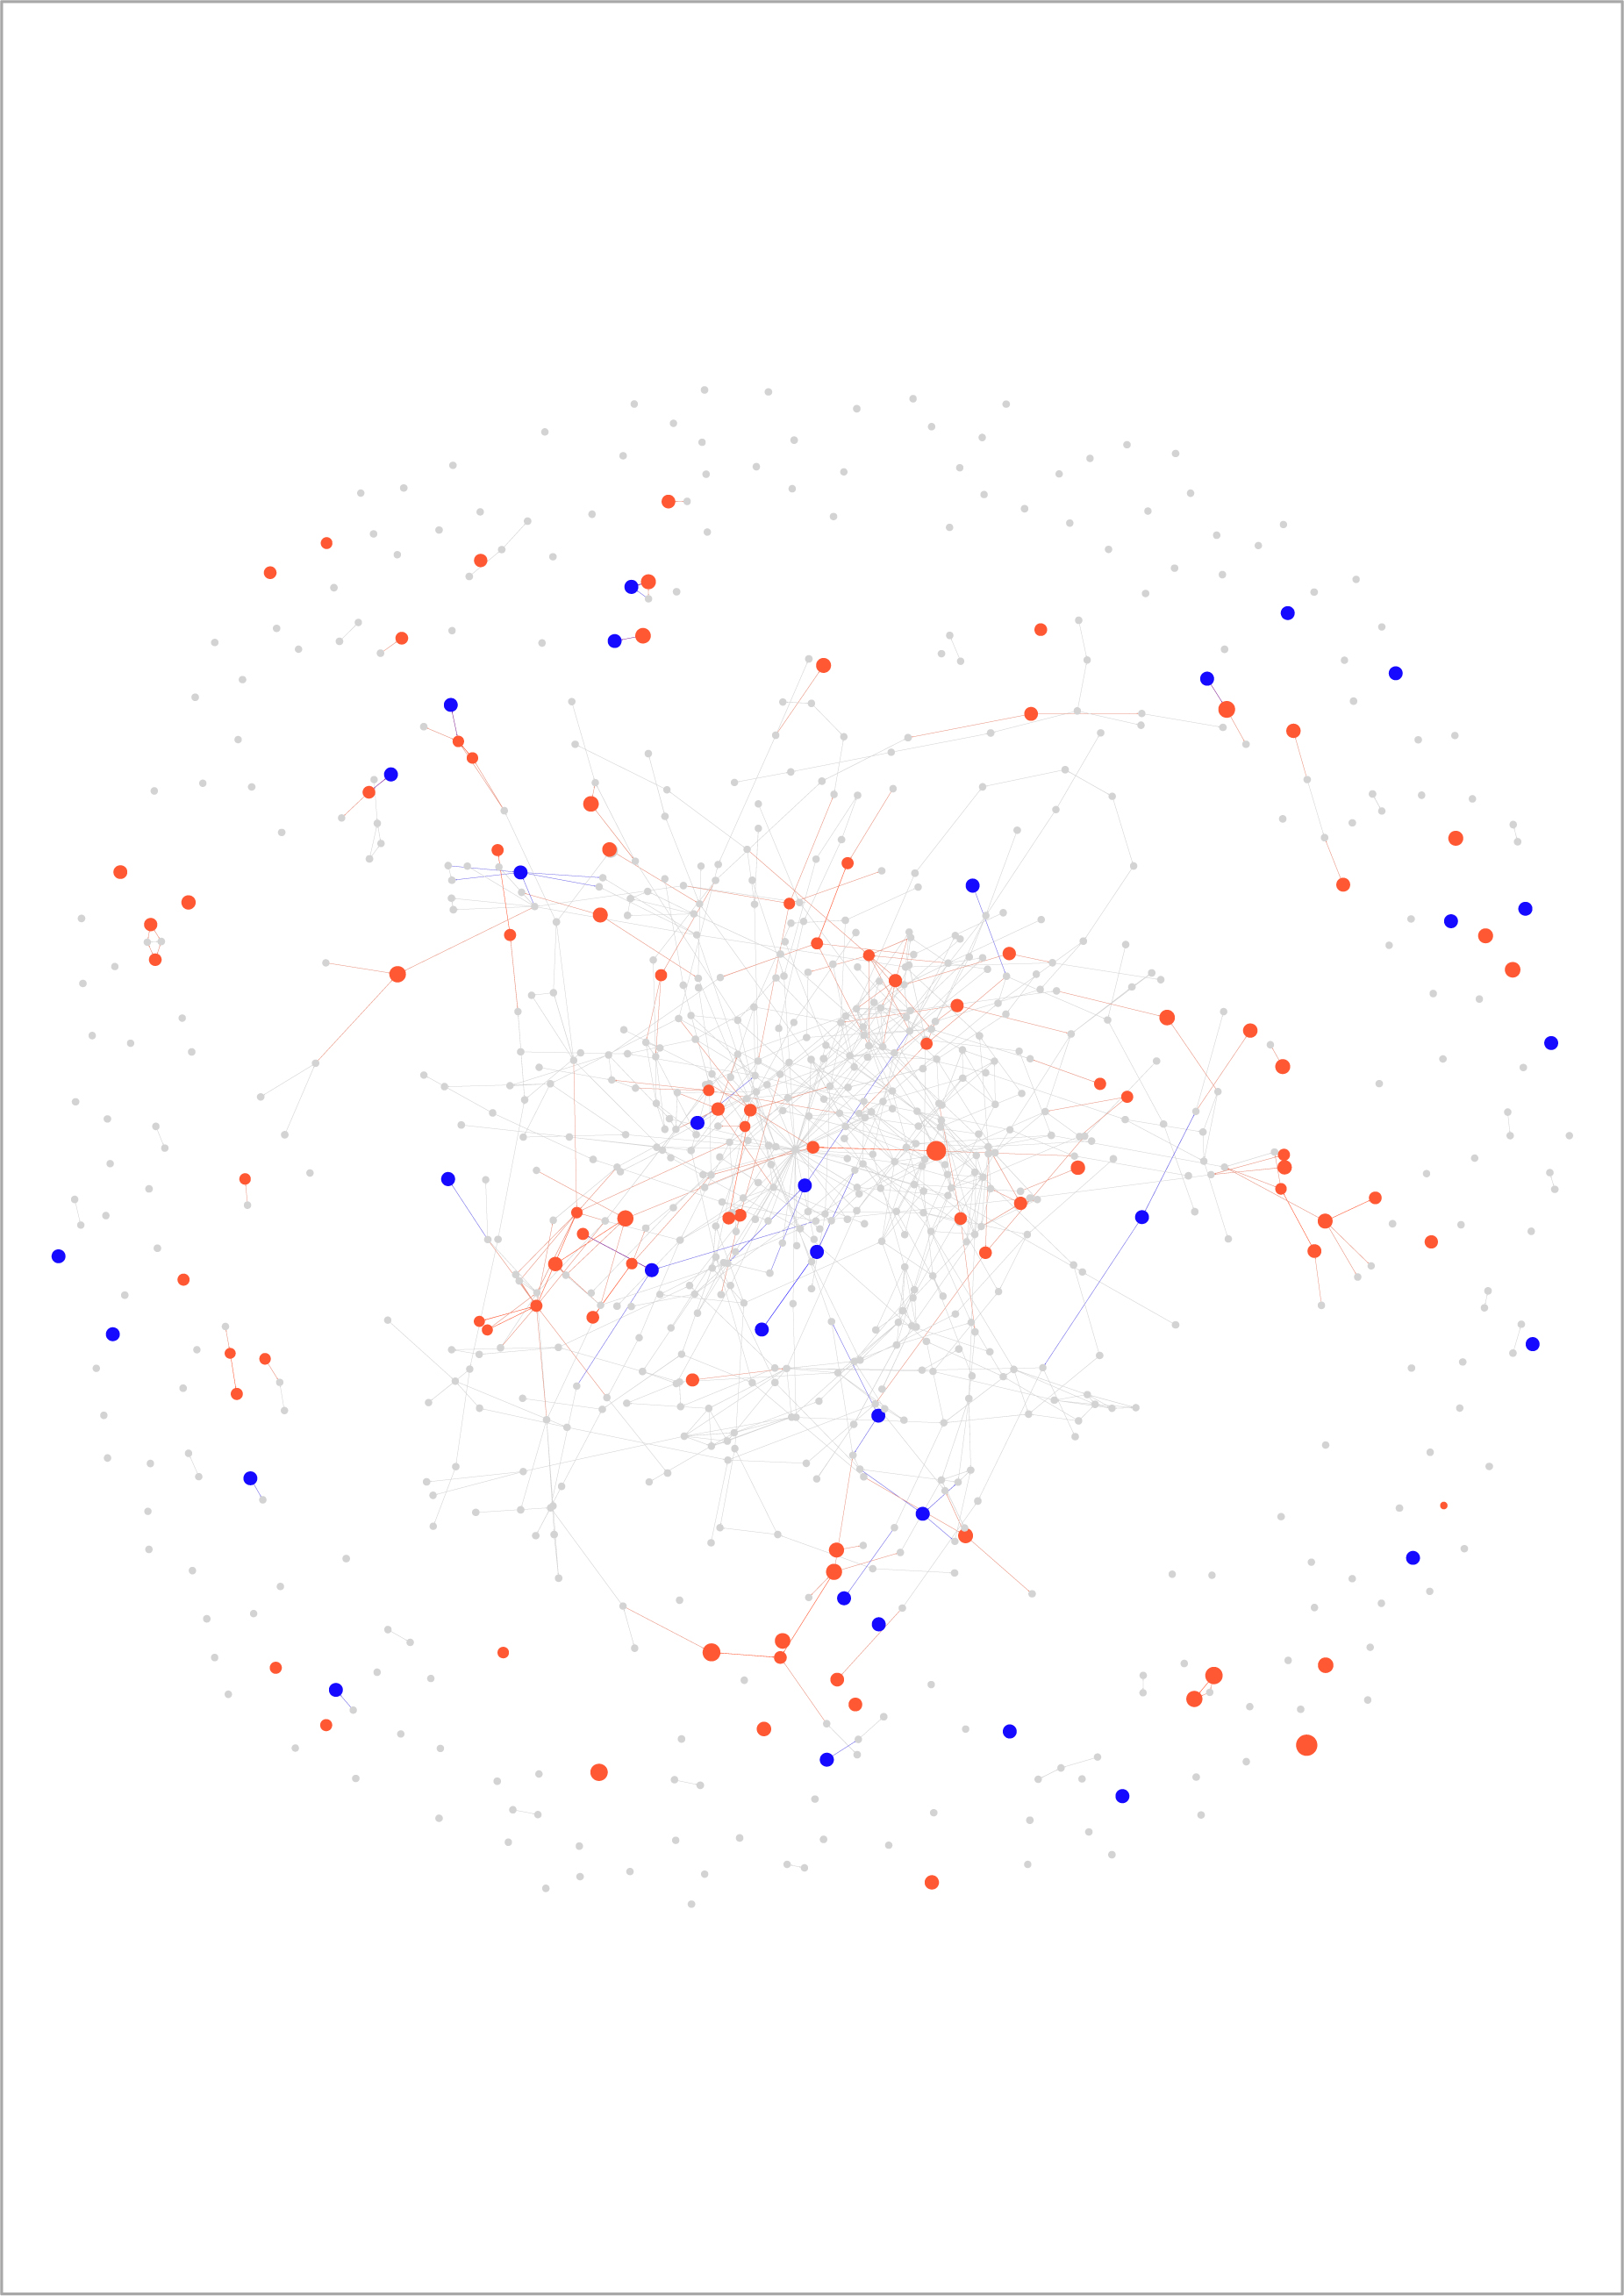
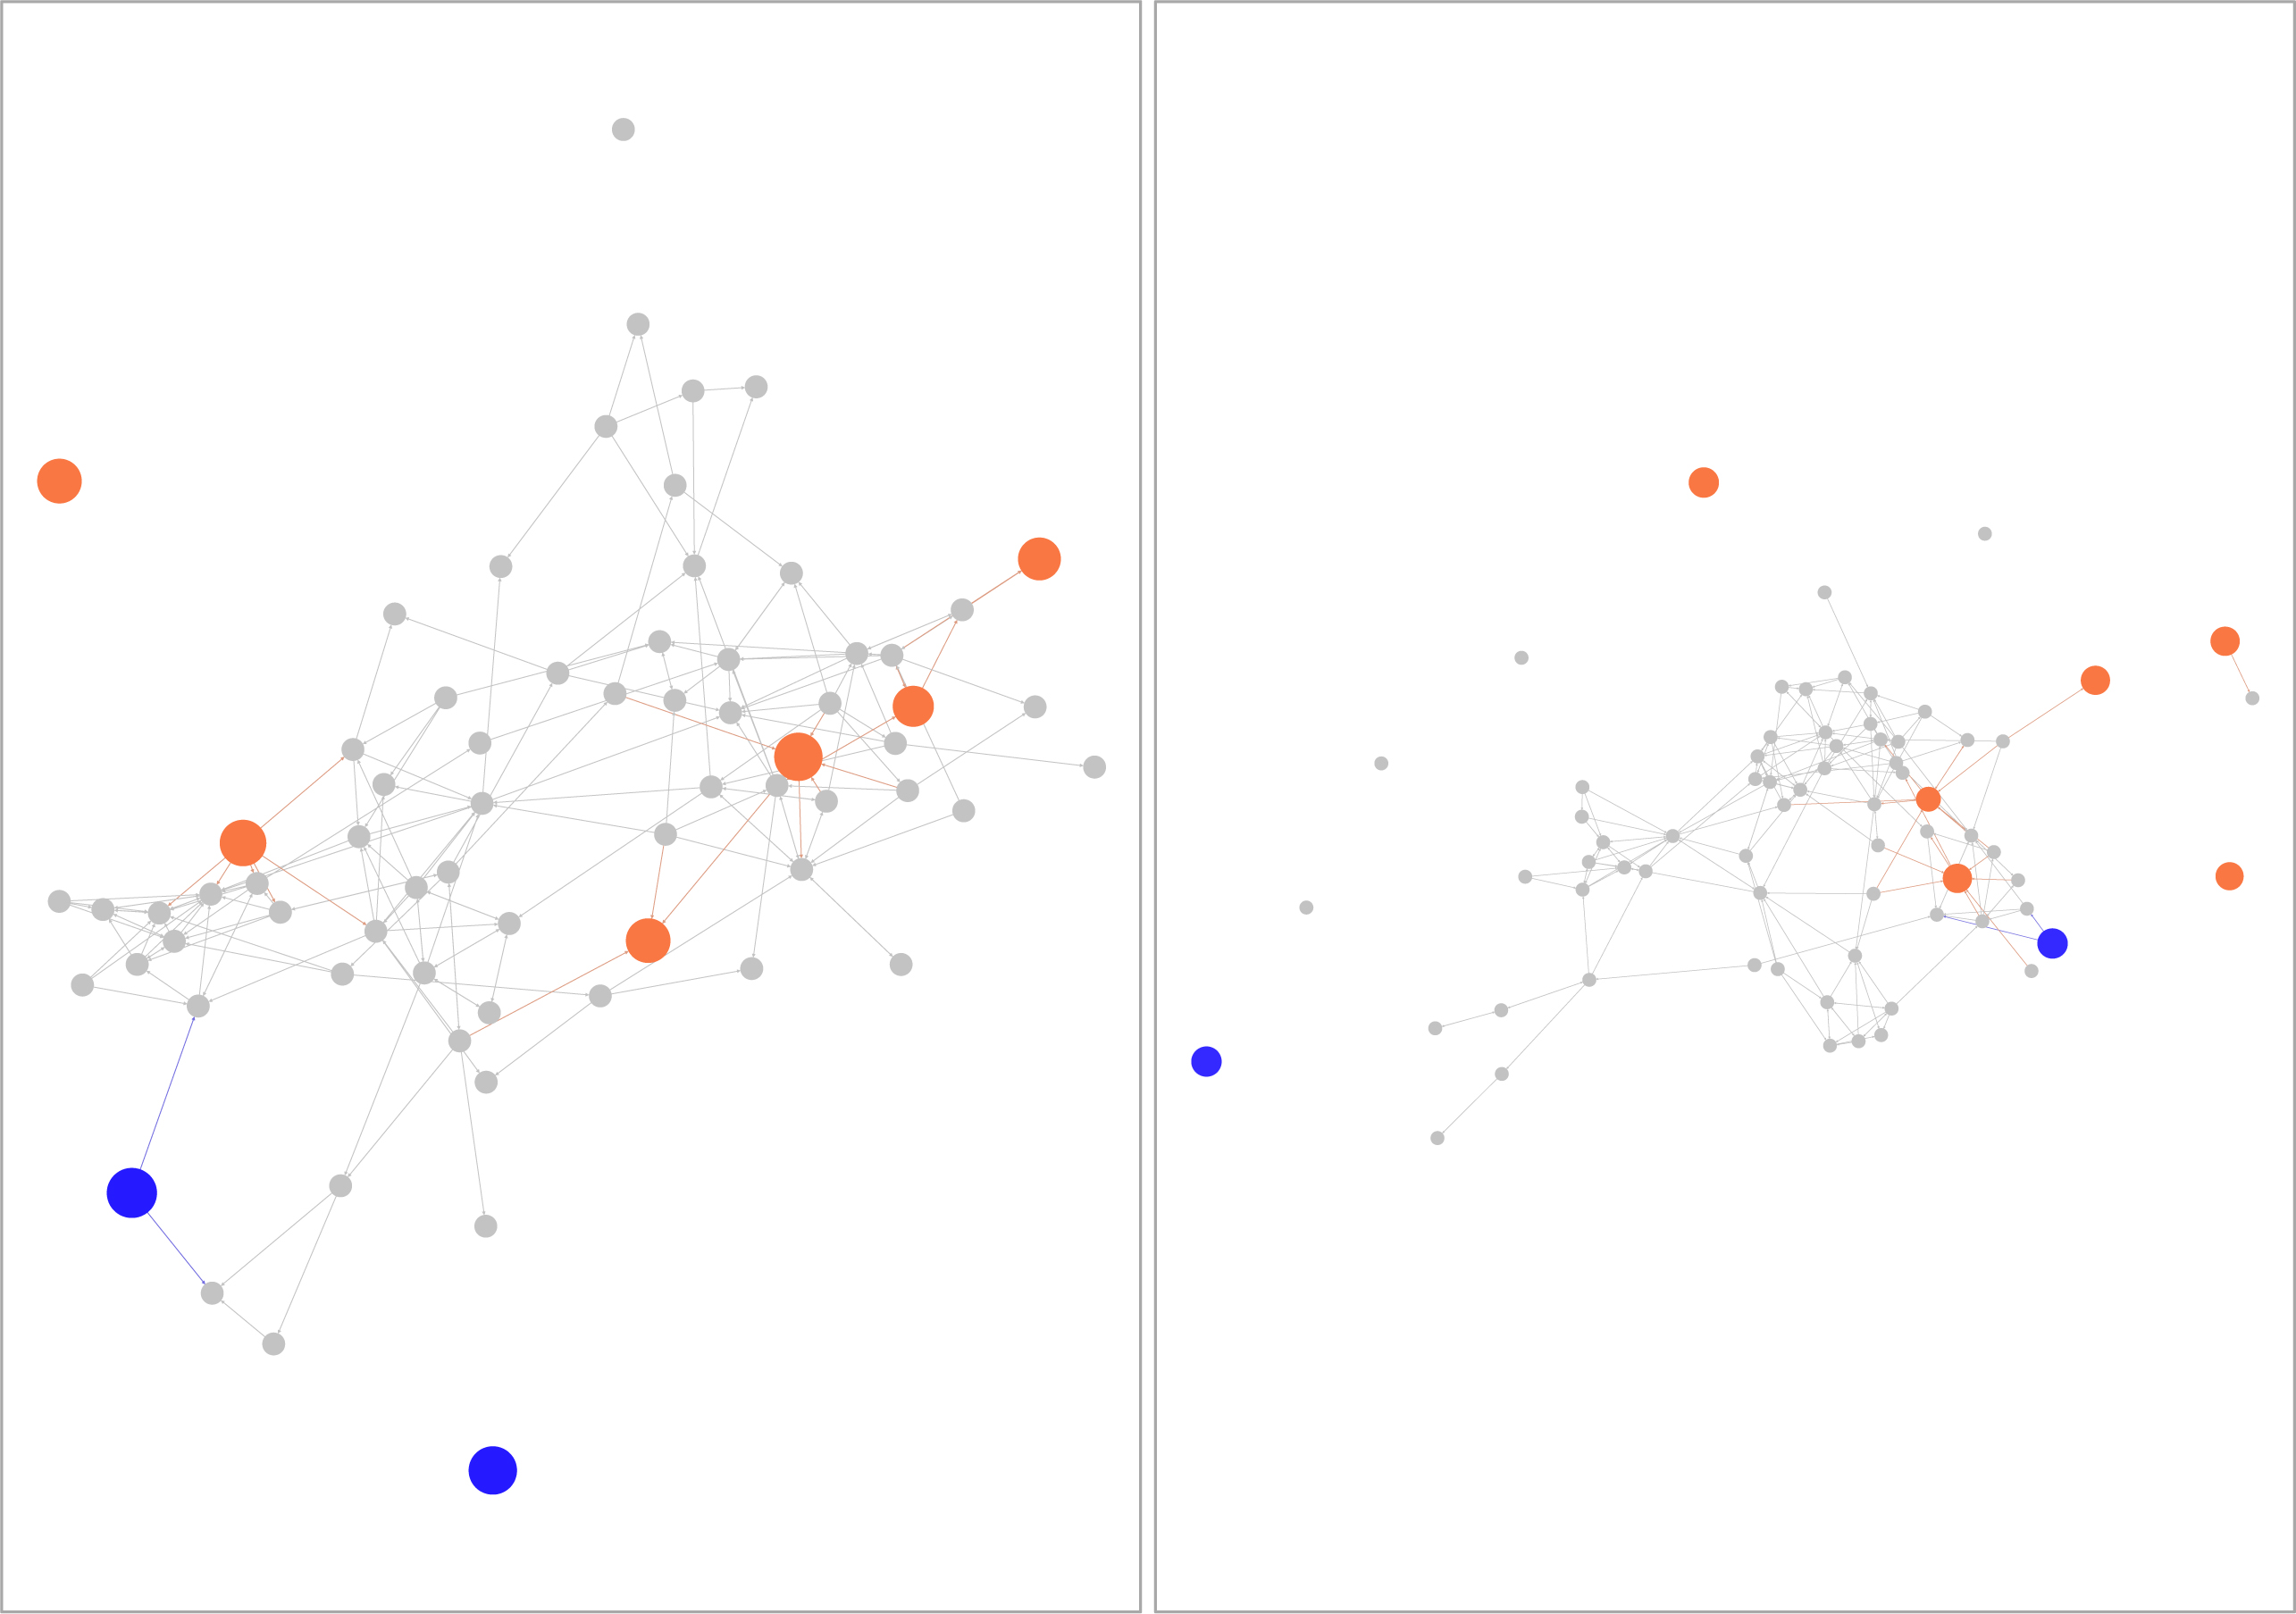
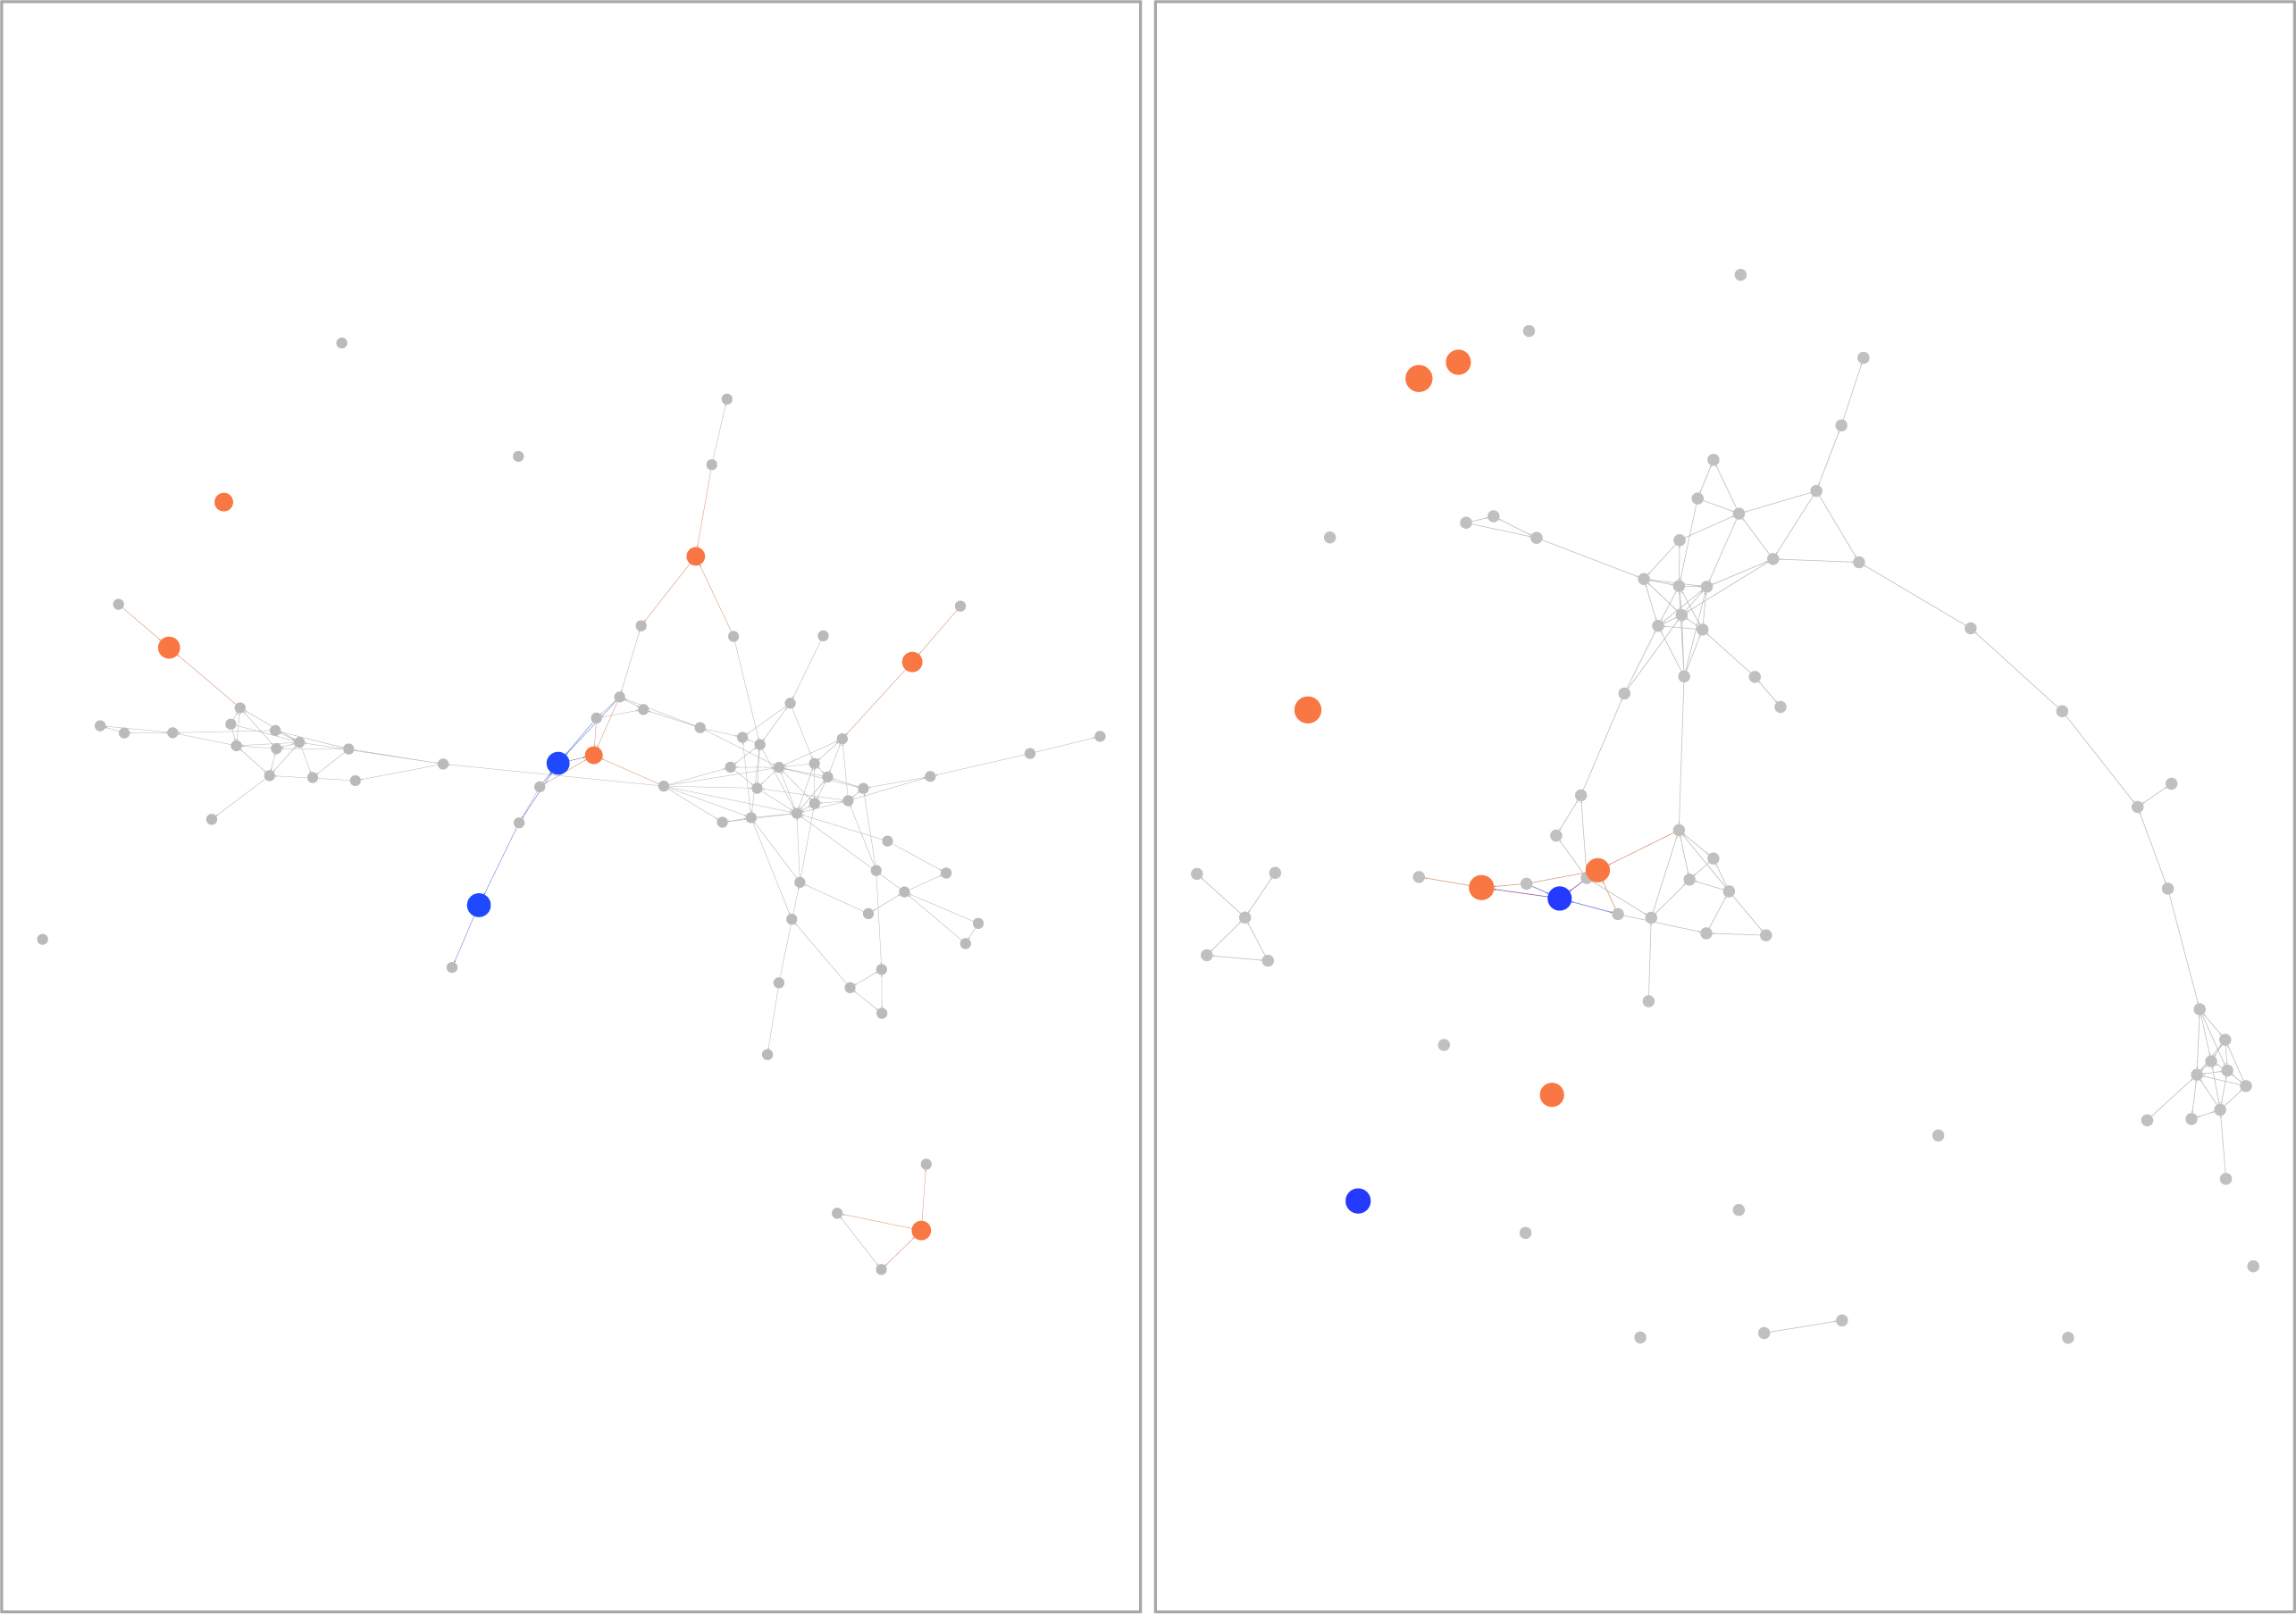
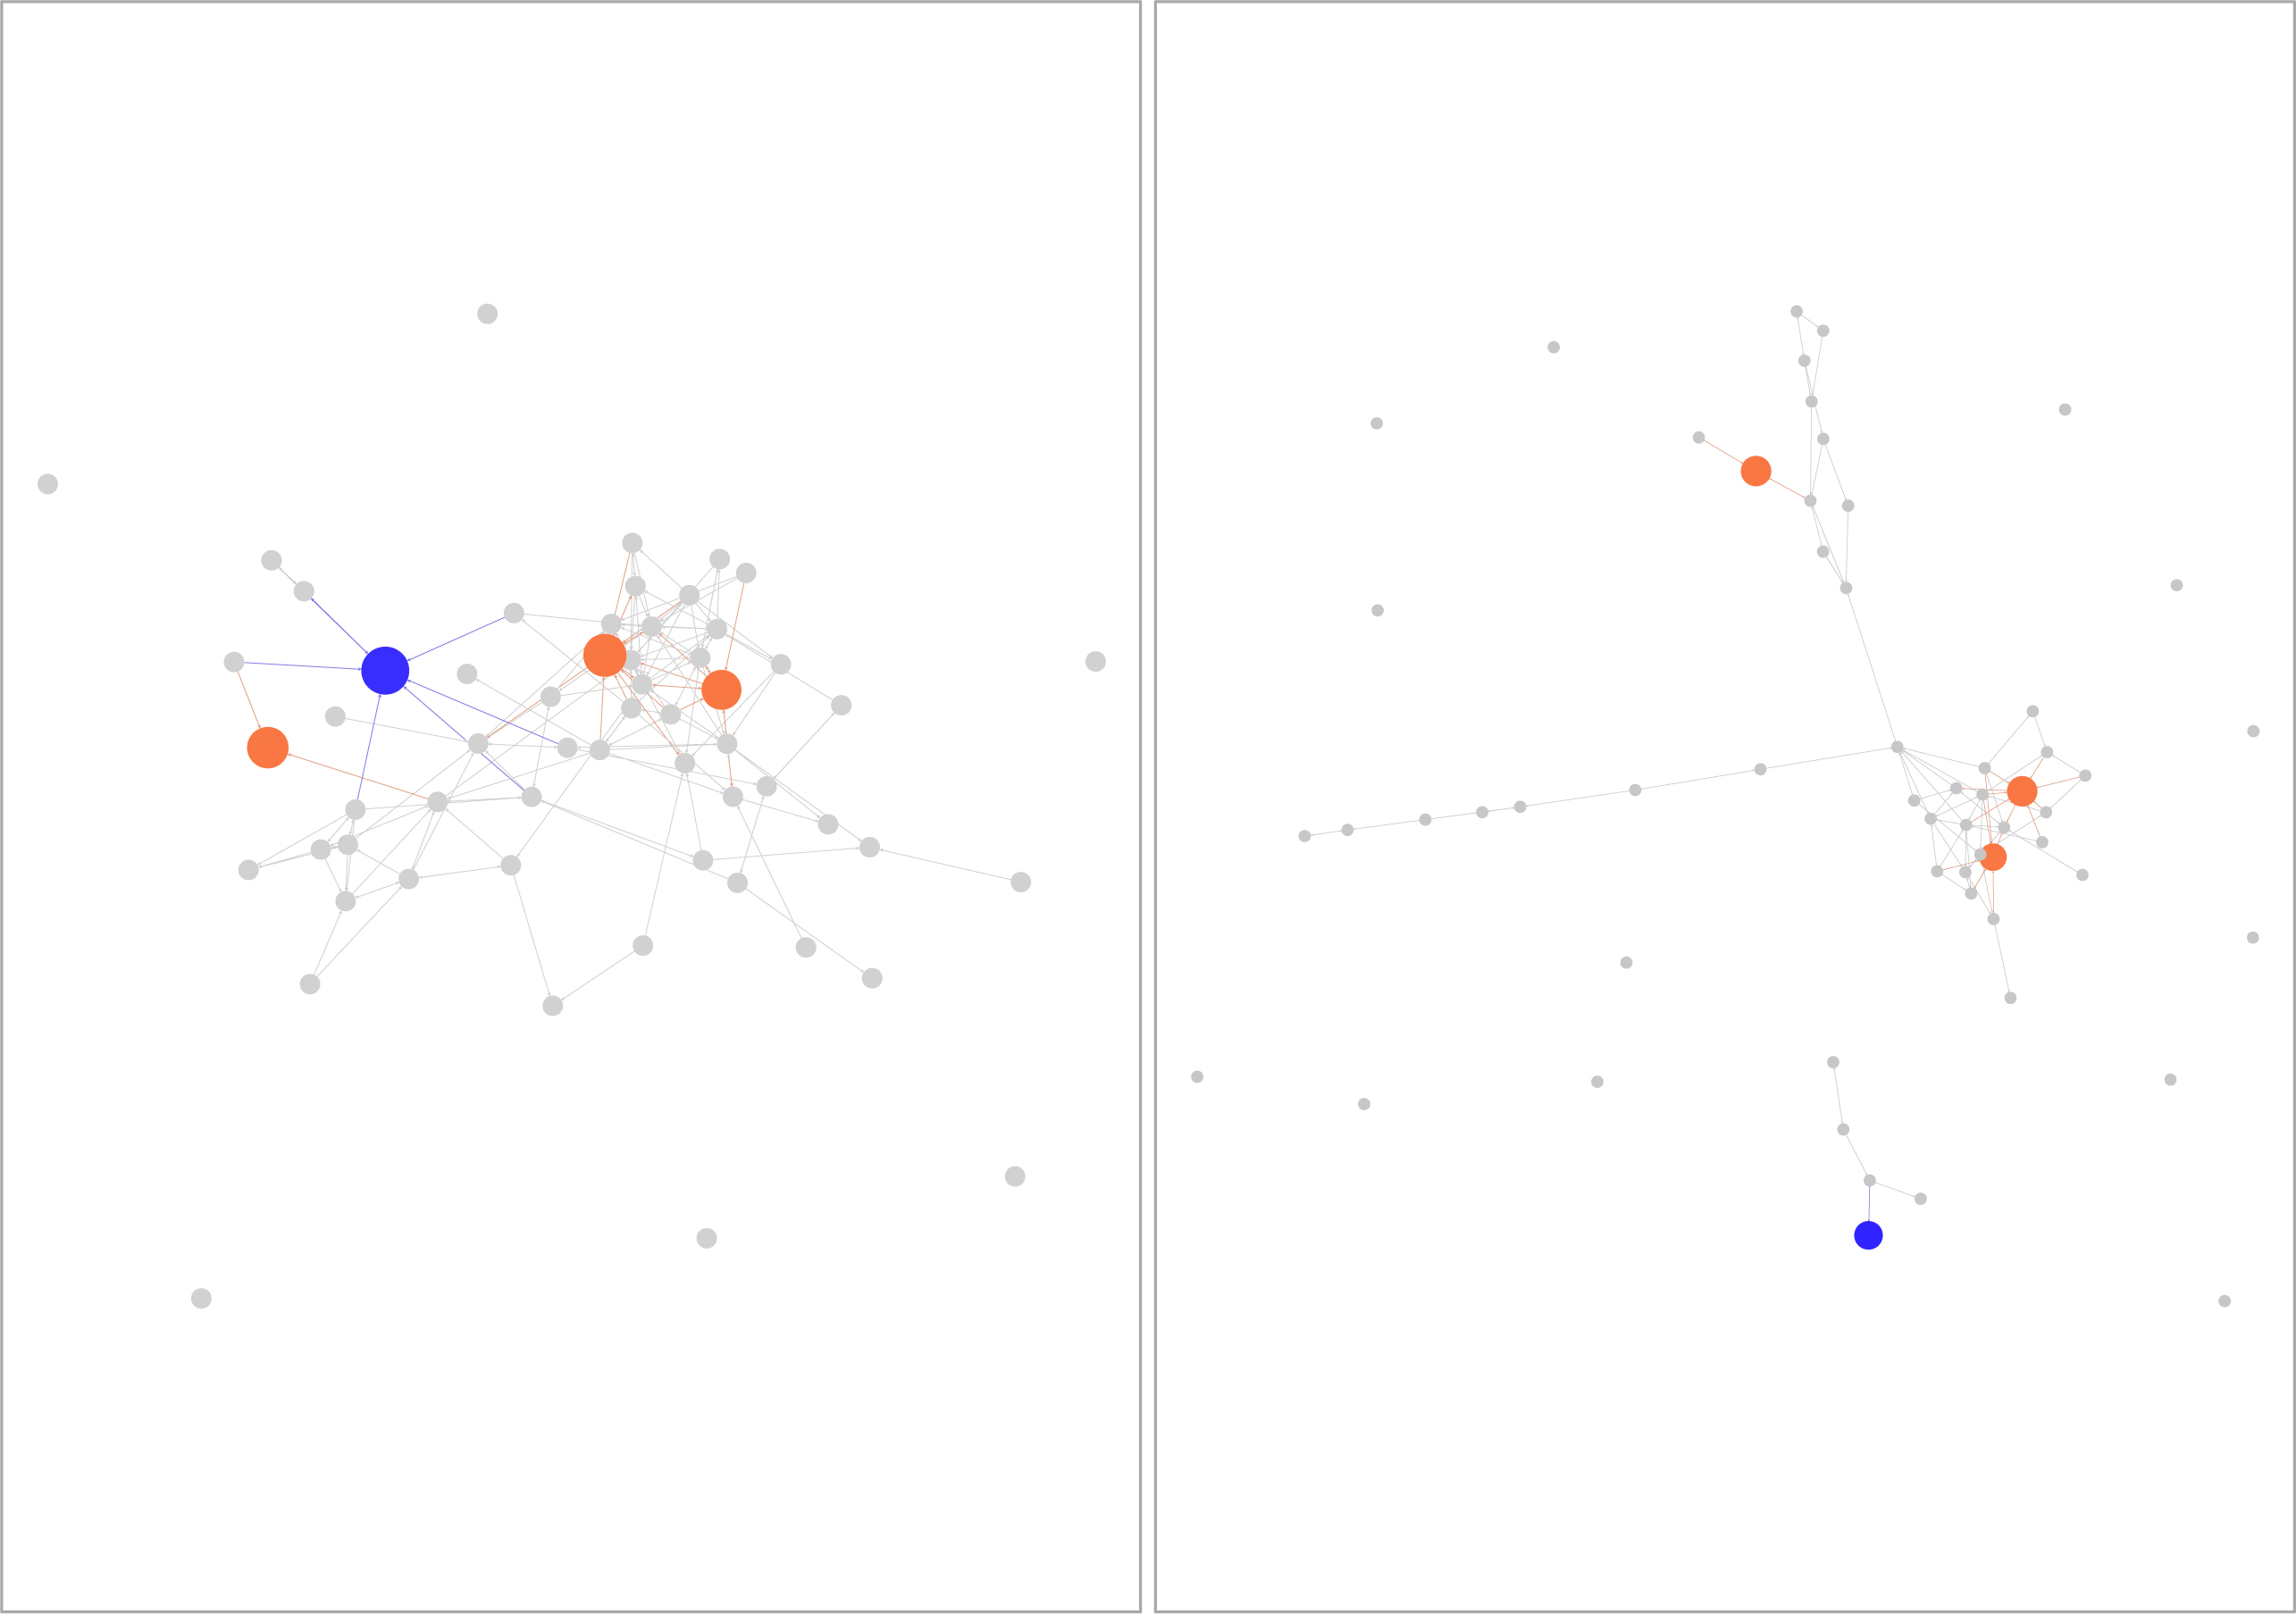
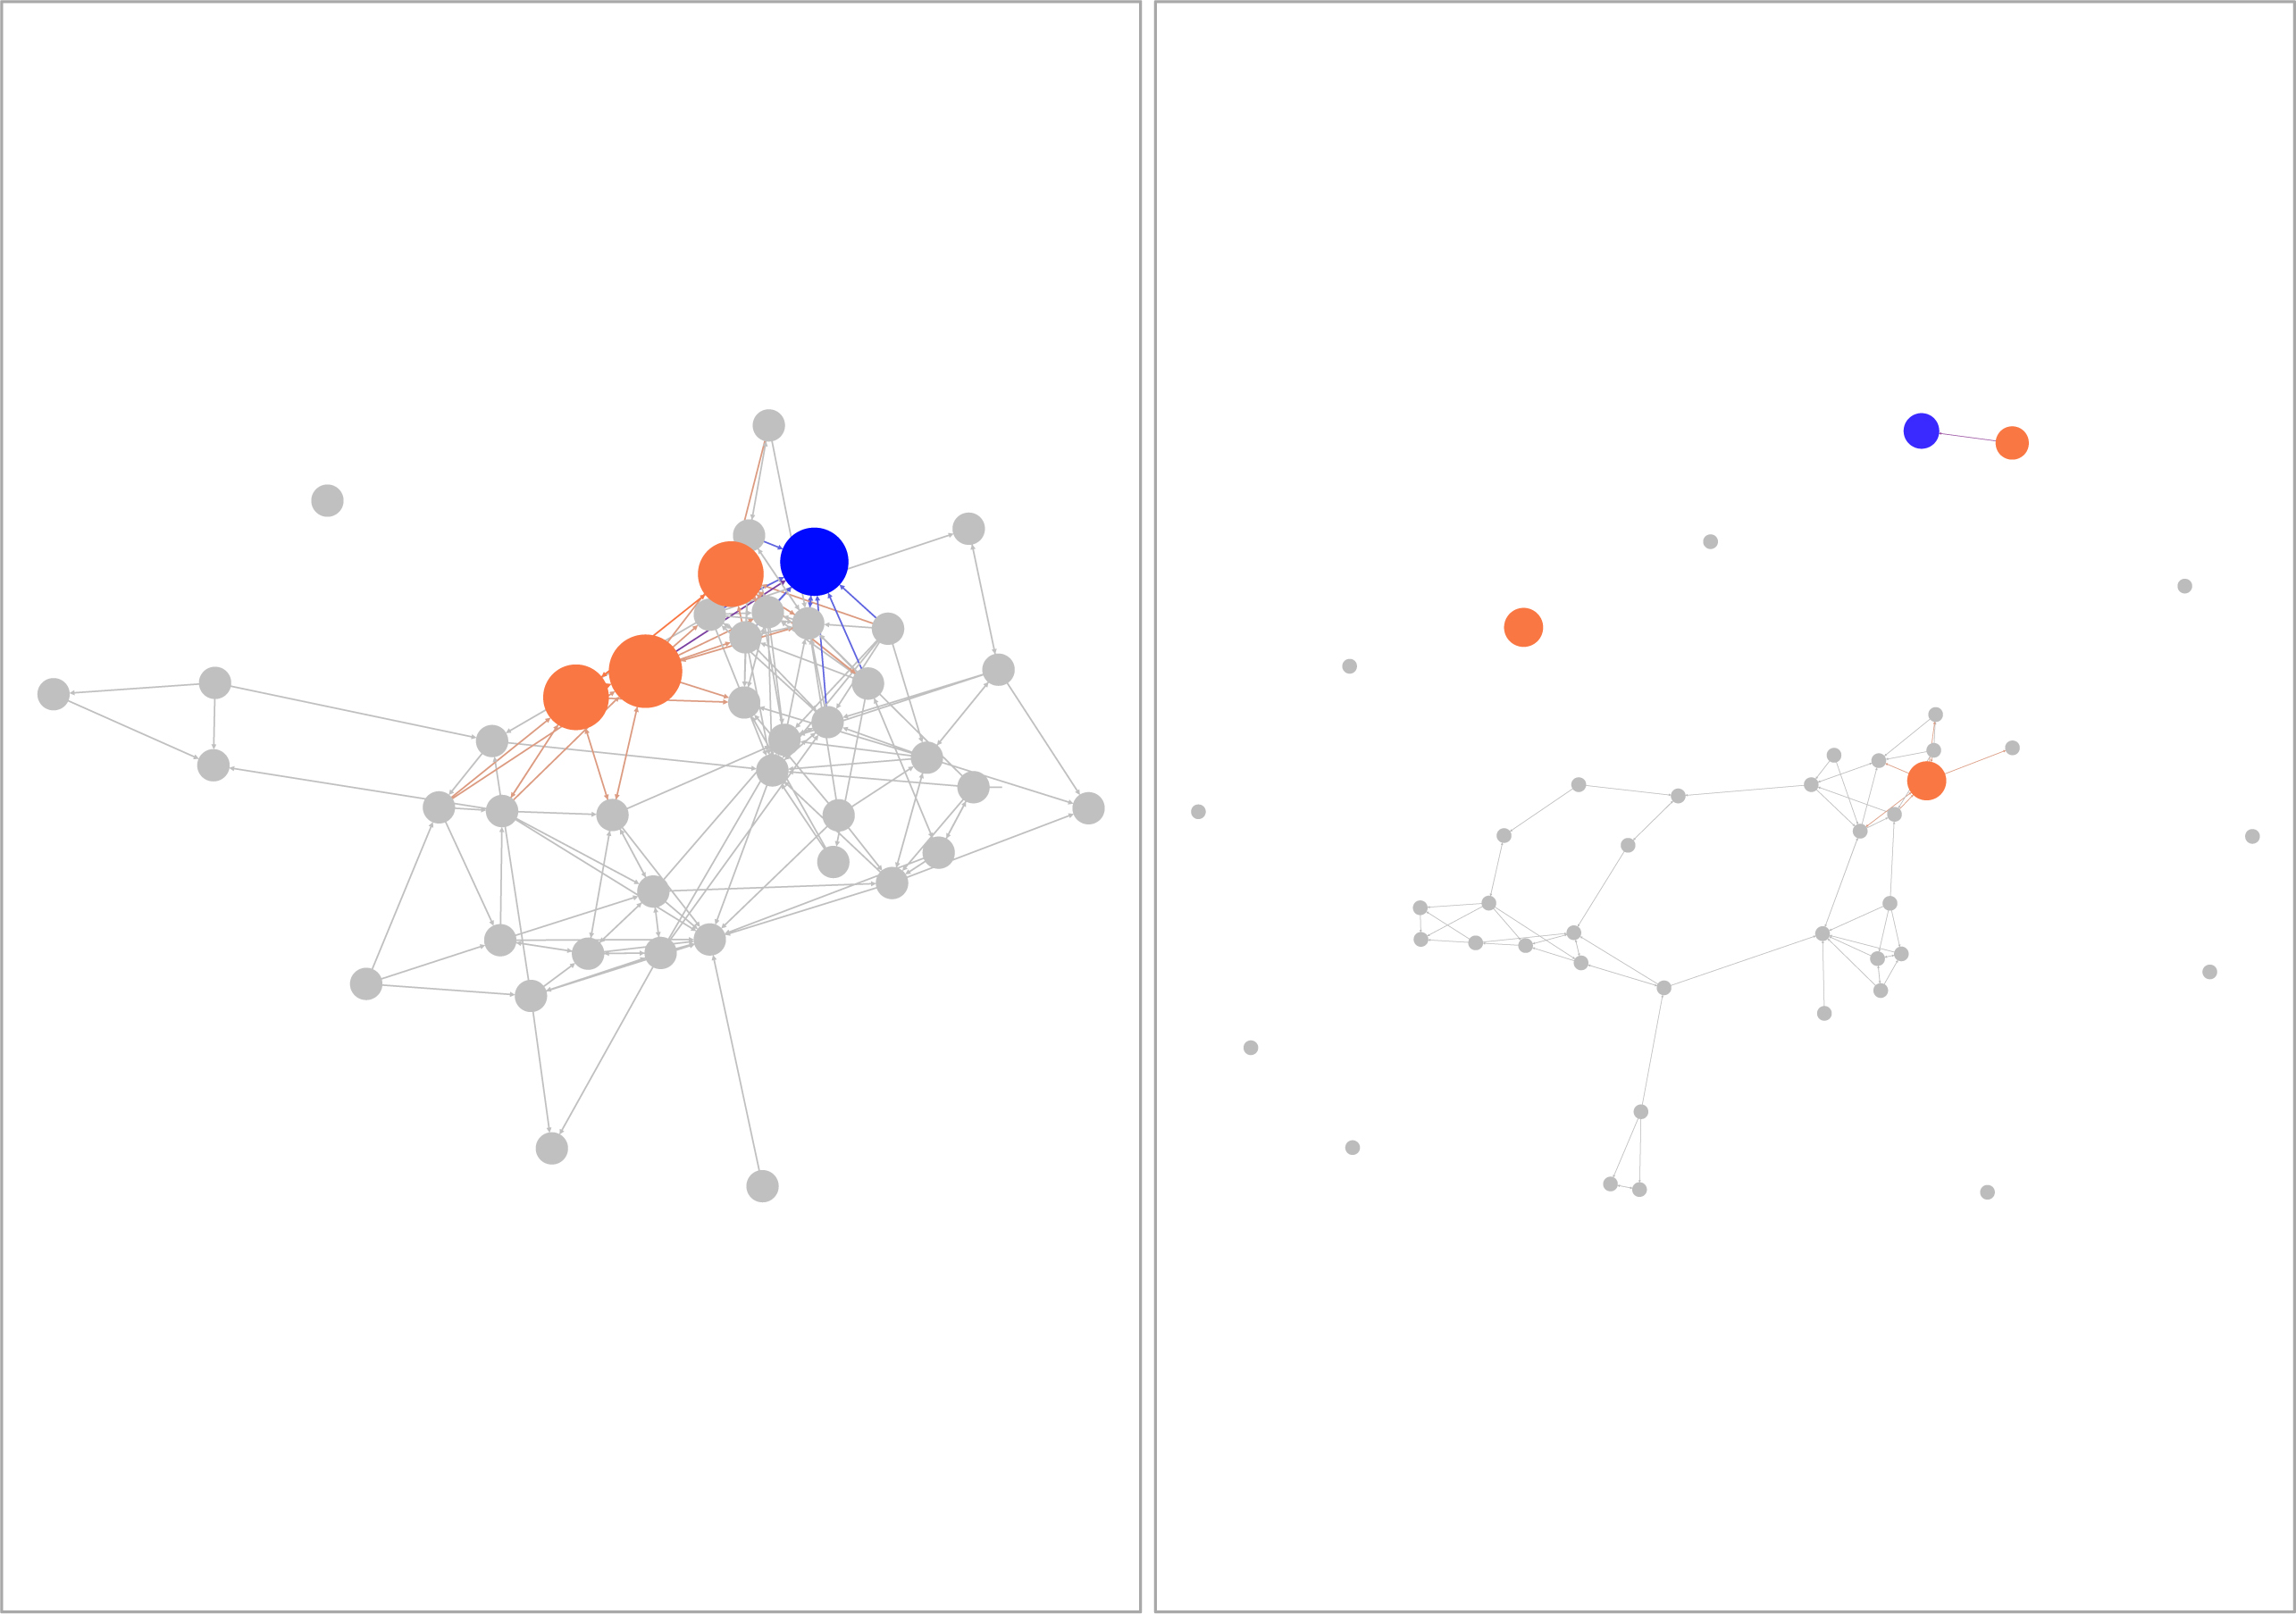
Using data from the National Longitudinal Study of Adolescent to Adult Health (Add Health), this study follows the social networks of a group of girls who experience their first pregnancy between data collection time points using a number of strategies. While the sample used in this study is not representative and has a small pregnant population, it is unique in its longitudinal whole school social network data. I take advantage of three analytic strategies in an effort to identify possible relationships between pregnancy, social change and school environments within the limited available data. I map and describe sociometric (i.e. whole) school networks at different time points to visualize how pregnant teens’ positions within their schools’ social networks change. While graphing networks provides descriptive information on overall networks across time, it cannot account for possible drivers of any observed network change. To better take into account the influence of the whole network structure on friendship and behavioral decisions, I explore network evolution of select schools using stochastic actor oriented models (SAOM), which simultaneously model changes in actors’ network positions and attributes (e.g. pregnancy) across time (Snijders, van de Bunt, & Steglich, 2010). Although this strategy is able to control for network influences, which are not accounted for in other modeling techniques, the models presented here are likely underpowered given the small number of girls experiencing a pregnancy. Multilevel models were used as an alternative as they adjust for differences across schools and possible background characteristics in a way that network graphs cannot, but do not control for network tendencies. Here multilevel models were used to evaluate whether the magnitude of change in network characteristics, such as change in number of friends reported before and after pregnancy, is larger for pregnant girls than comparable peers. Comparing these groups serves as a robustness check to assess if any downward trends in network variables are artifacts of overall network change instead of pregnancy. I find that pregnancy is associated with greater decreases in being considered a friend by peers, and fewer maintained friendships across time points. The network maps further suggest that in some schools, pregnant teens move to more peripheral positions in their school networks following pregnancy. While each method has limitations given the available data, they generally suggest a possible relationship between school context, pregnancy, and social disturbance that warrants further investigation.
Background
Friendships and Social Change
Friends are an important part of adolescence, and have been found to provide many benefits to teens, including: social development (Hartup, 1996), sense of value and belonging (Baumeister & Leary, 1995), social connections outside the family (Larson, 1983; Larson & Verma, 1999), support through transitions and stresses (Hartup, 1996), self confidence, social competencies (Buhrmester, 1990), and social capital (i.e. resources, information, support) (Bourdieu, 1999; Burt, 2000; Coleman, 1988; Lin, 1999). Teens’ access to friends and the value they derive from them likely varies depending on their environment (Small, 2009). For adolescents, schools are often their primary social organization, where they meet and interact with similarly aged peers. Schools help shape teens’ social worlds by orchestrating interactions through classroom placements, course scheduling and extracurricular activities. Indeed, sharing a classroom has been associated with friendship formation and stability (Frank, Muller, & Mueller, 2013; Neckerman, 1996). Friends within one’s school can provide a teen with additional benefits that may help them navigate both the academic demands and social ecosystem of their school. These include: sharing of academic resources, fun and enjoyment, motivation to attend or persist in school, models of school behaviors and expectations, and information on future educational decisions. A student in a class with many advantaged classmates may find she gains greater benefits or resources from her school friends. The extent to which a student relies on friends’ support may also depend on the characteristics of her school. Friends may be more valuable in under-resourced schools with less student supports.
Simply having social connections does not tell the complete story of the social world of teens. One’s positioning within her greater school social network is also likely to impact outcomes, as social positions are thought to facilitate or constrain individuals. Individuals that are more central in their networks – that is they are well connected to friends who are also well connected – are thought to have more access to resources and other people in their network than individuals who are more peripheral (Brass, 1984). Within a school, a student who is in her school’s social periphery is often more dependent on her limited friendships for connection to her greater school network, and are generally regarded as less influential or independent (Brass, 1984). Students in peripheral network positions are also more likely to get cut off from the greater school social network if they lose their limited connections and are thus at greater risk for becoming social isolated within their schools.
Adolescents’ friendships and positions within greater social networks are not static; approximately a third to a half of friendships change over the course of an academic year (Bowker, 2004; Chan & Poulin, 2007; Degirmencioglu, Urberg, Tolson, & Richard, 1998). Friendships are more likely to form when individuals share preferences (e.g. partaking in the same hobbies), environments (e.g. going to the same school) or context (e.g. being of the same culture) (Branje, Frijns, Finkenauer, Engels, & Meeus, 2007; Poulin & Chan, 2010). Instability often results when one or both members of the friendship: undergoes a significant personal change, is physically separated from her friend, decreases time in shared activities, develops new relationships or loses feelings of affection (Johnson et al., 2004). Even when friendships do not dissolve, the strength of the connection may ebb and flow (Cairns, Leung, Buchanan, & Cairns, 1995). Because of this, teens’ social position and access to social support may fluctuate over the course of their adolescence. Given the tendency for friendships to change, stability in a friendship is often considered an indicator of deeper or higher quality friendships. Teens with stable friendships are thought to have: more dependable and greater sources of social support (Poulin & Chan, 2010), higher self esteem (Hartup, 1993), more positive relationships with school, higher academic performance and more positive views of their own academic behaviors (Berndt, 1999). Having any best friendship consistently across time has also been thought to relate to adolescents’ development and behavioral adjustment (Bowker, 2004).
There are many reasons to suspect that pregnancy heightens friendship volatility and loss during adolescence. Many of the factors associated with increased friendship instability occur following conception. Friends may not appreciate the new changes a pregnant teen faces (Sherman & Greenfield, 2013), or her difficulty in continuing normal socialization and leisure activities (Clark, 2011). Pregnant teens also report facing stigma (Bermea, Toews, & Wood, 2016; Cherry, Chumbler, Bute, & Huff, 2015; Herrman, 2008; Wiemann, Rickert, Berenson, & Volk, 2005), which can be defined as loss of social standing or discrimination as a result of a distinguishing characteristic (Link & Phelan, 2001). Peers may avoid forming or continuing relationships with stigmatized individuals and, in turn, stigmatized teens may avoid settings where they face stigmatization. Pregnant teens may also change classrooms or schools – leaving behind old peers and encountering new ones – in order to better juggle school and pregnancy demands (Kleiner, Porch, & Farris, 2002; SmithBattle, 2007). These factors are also likely to vary depending on a pregnant teen’s school environment. For example, pregnant teens may face less social disruption if they attend schools without alternate educational placement options. In a school with a high prevalence of teen pregnancies, pregnancy may be less stigmatizing or better supported through school resources than in schools where pregnancy is an anomaly.
Pregnant teens themselves may elect to alter their friend groups following a pregnancy. Girls qualitatively report pregnancy to be a wake-up call, which prompts them to reprioritize their friendships and behaviors (Herrman, 2008; SmithBattle, 1995). A voluntary reduction in friendships may be beneficial for a pregnant teen if it allows her to focus on her higher quality friendships in the face of increased stress and limited time. On the other hand, as socially supported pregnant teens report higher levels of well-being (Letourneau et al., 2004), a non-voluntary loss of friends following pregnancy could be detrimental. Staying socially connected at school may also encourage educational persistence for this at-risk population (Marcus & Sanders-Reio, 2001; Parker & Asher, 1987; Rumberger, 2011), as having more friends prior to pregnancy has been associated with lessening the relationship between pregnancy and high school attrition (Humberstone, 2018b).
Longitudinal Network Analysis
While past cross-sectional work found girls to have reduced social networks after experiencing a pregnancy (Humberstone, 2018a), longitudinal work is needed to understand how a girl’s nulligravid social network evolves with pregnancy. Cross-sectional network analysis is limited for a number of reasons. Firstly, it is unable to account for social network tendencies (i.e. tendency towards reciprocation or friending a friend of a friend) that may partially explain observed network differences. Social networks are intrinsically interdependent so modeling strategies that assume independence of actors may misattribute the influences of network tendencies to non-network factors. Longitudinal networks are also needed to understand if and how individuals’ positions within their social networks change over time. Conceivably, occupying a peripheral social position would be more jolting for a girl who had previously been very central in her network than for a girl who was less centrally connected.
Additionally, both friendship and pregnancy challenges are likely not immediate or constant over time. As explained above, friendships regularly ebb and flow with changing life circumstances. A cross-sectional snapshot fails to capture this inherent friendship dynamic or provide any information on friendship stability. The impact of pregnancy on the lives of teenagers also evolves with time. Initially, pregnancies may go undetected and have little impact on a girl’s daily life. As a pregnancy continues, physical challenges may increase and eventually, the pregnancy often becomes visible. Stigmatization also likely builds with time, as word of a pregnancy spreads and others begin to gauge peers’ reception to the news. For the pregnant teen, it may also take time to recognize if friends are distancing themselves and to adjust her social expectations accordingly. Thus, cross-sectional work is likely to underestimate pregnancy’s impact on social networks depending on the timing of data collection.
There are a number of methodological strategies for evaluating networks across time. Descriptive analysis can be done by graphing overall networks at each available time point. Mapping networks allows for visual identification of network trends, and gives a quick understanding for how networks generally differ between schools. Visual representations of networks are often more impactful and easier to understand for audiences than more complicated statistical models. Network graphs, however, do not provide any information about how network differences develop or control for factors known to relate to network trends (i.e. gender homophily). Dynamic network models, such as SAOM, were developed to better account for both network tendencies and the co-evolution of behavior and social changes over time. These models are also able to adjust for the association of covariates with network change, and further break down that association into estimates for: the likelihood an individual extends a friendship tie based on her own covariates, the likelihood a peer extends a friendship tie based on an individual’s covariates, and the likelihood that an individual extends a friendship tie when they share the same covariate with a peer. Finally, these models account for overall network structures. This is important because friendships do not happen in isolation – social connections are enmeshed with and influenced by the social connections of others around them. For example, friends of friends are more likely to interact than those without any shared social connections.
While theoretically justified, the use of dynamic network models in this study is limited by the available data for the analysis. The Add Health data set has seven schools with whole network data and girls who become pregnant between time points. Each school only has a small pool of pregnant teens, which leaves the models likely underpowered for detecting possible pregnancy associations. Of the seven schools, five were small schools with very few pregnant girls for dynamic network modeling. Therefore, multilevel models will also be used in this study. Multilevel models account for variation across schools but do not control for network features. This allows more freedom in the models with limited data, provides the opportunity to account for background characteristics through matching, and uses all available pregnant teen data. Through these techniques, this study seeks to understand the relationship between social network change and pregnancy, and how this relationship may be associated with school environments.
Data and Methods
Data for this study comes from the National Longitudinal Study of Adolescent to Adult Health. Add Health is a nationally representative survey that follows a group of adolescents who were in grades 7 to 12 when the survey began. Schools were the primary sampling unit; 132 middle schools and high schools were selected based on region, urbanicity, and school size and characteristics. Data collection took place during multiple time points. At the first time point (1994-1995), called the In-School survey in the Add Health survey and referred to here as Time 1, every student attending a sampled school was invited to participate (n =90,118). From those students, a subsample was selected for further study based on sex and grade. This subsample of 20,745 participants was surveyed again approximately six months to a year after Time 1 (1995) in what was called the Wave 1 survey and here will be called Time 2. They were again survey approximately a year later (1996) for the Wave 2 survey (n = 14,738), which I call Time 3.
Of the 132 sampled schools, sixteen had all their students followed during each time point of the study. This saturated sample was done to capture complete social network data of schools across time. The saturated sample is not nationally representative; schools within the saturated sample also differ from the sample of schools generally. Table 1 provides details on the distribution of saturated and non-saturated schools across school characteristics. The saturated sample has a higher representation of small, rural, and private schools, and schools that include primary school grades than the rest of the sample. Saturated schools also have a higher percentage of their student population experiencing a pregnancy, as reported by school administrators (saturated schools = 1.39%, non-saturated = 0.69%, p < .05). While these sixteen schools are not nationally representative, this data is the focus of this study because it provides both longitudinal data of whole school social networks and participant-level background information.
Table 1
Comparison of School Characteristics in Saturated Sample, Saturated Sample with Girls Experiencing a Pregnancy and Non-Saturated Sample Schools
| Saturated (w/girls) | Saturated (w/preg.) | Non-Saturated | ||||||
|---|---|---|---|---|---|---|---|---|
| Urbanicity | ||||||||
| Urban | 4 (26.7%) | 2 (28.6%) | 33 (30.0%) | |||||
| Suburban | 6 (40.0%) | 2 (28.6%) | 63 (57.3%) | |||||
| Rural | 5 (33.3%) | 3 (42.9%) | 14 (12.7%) | |||||
| Region | ||||||||
| West | 3 (20.0%) | 1 (14.3%) | 22 (20.0%) | |||||
| Midwest | 5 (33.3%) | 2 (28.6%) | 22 (20.0%) | |||||
| South | 4 (26.7%) | 3 (42.9%) | 49 (44.5%) | |||||
| Northeast | 3 (20.0%) | 1 (14.3%) | 17 (15.5%) | |||||
| School Size* | ||||||||
| Small (1-400) | 13 (86.7%) | 5 (71.4%) | 16 (14.5%) | |||||
| Medium (401-1000) | 0 (0.0%) | 0 (0.0%) | 59 (53.6%) | |||||
| Large (1001-4000) | 2 (13.3%) | 2 (28.6%) | 35 (31.8%) | |||||
| School Type* | ||||||||
| Public | 10 (66.7%) | 5 (71.4%) | 104 (94.5%) | |||||
| Private | 4 (26.7%) | 1 (14.3%) | 2 (1.8%) | |||||
| Catholic | 1 (6.7%) | 1 (14.3%) | 4 (3.6%) | |||||
| Grades* | ||||||||
| Includes primary grades | 11 (73.3%) | 4 (57.1%) | 4 (3.6%) | |||||
| No primary grades | 4 (26.7%) | 3 (42.9%) | 106 (96.4%) | |||||
| n | 15 | 7 | 110 | |||||
| School | n | Avg. Degree | Network Density | |||||
|---|---|---|---|---|---|---|---|---|
| Time 1 | Time 3 | Time 1 | Time 3 | |||||
| 1 | 121 | 3.78 | 2.31 | 0.031 | 0.019 | |||
| 2 | 479 | 3.88 | 2.73 | 0.008 | 0.006 | |||
| 3 | 850 | 2.08 | 1.26 | 0.002 | 0.001 | |||
| 4 | 70 | 2.61 | 2.73 | 0.038 | 0.04 | |||
| 5 | 76 | 2.26 | 1.84 | 0.03 | 0.25 | |||
| 6 | 92 | 2.88 | 1.55 | 0.051 | 0.027 | |||
| 7 | 46 | 4.02 | 1.57 | 0.098 | 0.038 | |||
| Pregnant | Matched Non-Preg | Not Matched Non-Preg | ||||||
|---|---|---|---|---|---|---|---|---|
| M | SD | M | SD | Std bias | M | SD | Std bias | |
| Out-Nominations | ||||||||
| Num. at first survey | 5.12 | 3.44 | 5.18 | 3.21 | -0.02 | 5.49 | 3.22 | -0.11 |
| Avg. diff. bt surveys | -3.15 | 3.29 | -2.38 | 3.16 | -0.23 | -2.01* | 3.47 | -0.35 |
| Num. maintained bt surveys | 0.65 | 0.90 | 1.03* | 1.32 | -0.42 | 1.41* | 1.47 | -0.85 |
| In-Nominations | ||||||||
| Num. at first survey | 4.48 | 3.39 | 4.29 | 3.62 | 0.06 | 4.78 | 3.66 | -0.09 |
| Avg. diff. bt surveys | -3.12 | 3.02 | -2.11* | 2.86 | -0.33 | -2.28* | 3.18 | -0.28 |
| Num. maintained bt surveys | 0.30 | 0.59 | 0.58* | 0.92 | -0.47 | 0.87* | 1.12 | -0.97 |
| Reciprocated Friends | ||||||||
| Num. at first survey | 1.60 | 1.53 | 1.74 | 1.70 | -0.09 | 1.98 | 1.74 | -0.25 |
| Avg. diff. bt surveys | -1.12 | 1.56 | -0.83 | 1.64 | -0.18 | -0.88 | 1.72 | -0.15 |
| Centrality | ||||||||
| Num. at first survey | 0.57 | 0.47 | 0.58 | 0.47 | -0.01 | 0.55 | 0.46 | 0.05 |
| Avg. diff. bt surveys | -0.27 | 0.87 | -0.24 | 0.86 | -0.04 | -0.23 | 0.83 | -0.05 |
| Covariates | ||||||||
| Age | 15.57 | 1.09 | 15.49 | 1.11 | 0.07 | 15.02* | 1.36 | 0.50 |
| White | 0.47 | 0.50 | 0.44 | 0.50 | 0.06 | 0.44 | 0.50 | 0.05 |
| Black | 0.22 | 0.42 | 0.23 | 0.42 | -0.03 | 0.16 | 0.37 | 0.13 |
| Hispanic | 0.52 | 1.47 | 0.66 | 1.65 | -0.09 | 0.91 | 2.19 | -0.27 |
| U.S. Born | 0.95 | 0.22 | 0.92 | 0.28 | 0.15 | 0.84* | 0.37 | 0.50 |
| Prior GPA | 2.31 | 0.73 | 2.39 | 0.68 | -0.10 | 3.07* | 0.69 | -1.04 |
| HIV/AIDS Expectations | 1.00 | 1.35 | 1.21 | 2.03 | -0.15 | 0.85 | 1.57 | 0.11 |
| Number in Household | 4.55 | 1.33 | 4.56 | 1.13 | 0.00 | 4.74 | 1.12 | -0.14 |
| Extracurricular | 0.33 | 0.48 | 0.32 | 0.47 | 0.04 | 0.14* | 0.34 | 0.41 |
| Get Along w. Teacher | 1.22 | 1.30 | 1.11 | 1.30 | 0.09 | 1.06 | 1.34 | 0.12 |
| Get Along w. Peers | 1.58 | 1.45 | 1.56 | 1.49 | 0.02 | 1.43 | 1.54 | 0.10 |
| Try in School | 1.78 | 0.61 | 1.76 | 0.66 | 0.05 | 1.58* | 0.59 | 0.34 |
| Tried Alcohol | 0.78 | 0.42 | 0.79 | 0.41 | -0.03 | 0.44* | 0.50 | 0.82 |
| Overall Health | 2.73 | 0.88 | 2.81 | 0.90 | -0.08 | 2.14* | 0.94 | 0.67 |
| Cigarette Consumption | 2.53 | 2.80 | 2.27 | 2.53 | 0.09 | 0.65* | 1.43 | 0.67 |
| Lie to Parents | 2.83 | 1.86 | 2.86 | 1.84 | -0.01 | 2.00* | 1.68 | 0.45 |
| Skip School | 1.57 | 1.69 | 1.44 | 1.68 | 0.08 | 0.35* | 0.77 | 0.72 |
| n | 60 | 180 | 572 | |||||
| School | Type | Urbanicity | Size | Grade | Region | |||
|---|---|---|---|---|---|---|---|---|
| 1 | Public | Rural | Small | K-12 | South | |||
| 2 | Public | Rural | Large | 9-12 | Midwest | |||
| 3 | Public | Suburban | Large | 10-12 | West | |||
| 4 | Public | Rural | Small | K-12 | Midwest | |||
| 5 | Private | Urban | Small | K-12 | South | |||
| 6 | Public | Suburban | Small | 6-8 | South | |||
| 7 | Catholic | Urban | Small | K-8 | Northeast | |||
| School 2 | School 3 | |||||||
|---|---|---|---|---|---|---|---|---|
| Rate (Period 1) | 11.37 | 9.30 | ||||||
| (0.55) | (0.87) | |||||||
| Rate (Period 2) | 10.31 | 5.00 | ||||||
| (0.47) | (0.31) | |||||||
| Out degree | -3.32 | -4.16 | ||||||
| (0.03) | (0.04) | |||||||
| Reciprocity | 2.16 | 2.60 | ||||||
| (0.05) | (0.08) | |||||||
| Transitive Triplets | 0.44 | 0.61 | ||||||
| (0.02) | (0.03) | |||||||
| Female Similarity | 0.18 | 0.35 | ||||||
| (0.03) | (0.04) | |||||||
| Grade Similarity | 2.01 | 2.11 | ||||||
| (0.11) | (0.13) | |||||||
| Pregnant alter | -0.34 | 0.09 | ||||||
| (1.42) | (0.24) | |||||||
| Pregnant ego | -0.77 | -0.35 | ||||||
| (1.37) | (0.30) | |||||||
| Pregnant similarity | -0.36 | 0.33 | ||||||
| (1.41) | (0.24) | |||||||
| n nodes (preg. nodes) | 479 (21) | 850 (60) | ||||||
| School 2 | School 3 | |||||||
|---|---|---|---|---|---|---|---|---|
| Formation | Dissolution | Formation | Dissolution | |||||
| Base | Covars. | Base | Covars. | Base | Covars. | Base | Covars. | |
| Edges | -6.40* | -6.52* | -6.56 | -1.47* | -6.92* | -7.52* | -0.76* | -1.65* |
| (0.03) | (0.04) | (0.03) | (0.06) | (0.03) | (0.05) | (0.04) | (0.08) | |
| Preg - Out | -0.70* | -0.37 | -0.85 | -0.77 | -0.61* | -0.51* | -0.51 | -0.31 |
| (0.03) | (0.31) | (0.45) | (0.52) | (0.18) | (0.19) | (0.28) | (0.30) | |
| Preg - In | -0.26 | 0.15 | -0.66 | -0.30 | -0.27 | -0.12 | -0.79* | 0.47 |
| (0.24) | (0.21) | (0.38) | -(0.45) | (0.16) | (0.16) | (0.30) | (0.05) | |
| Triad (gwesp) | 1.16* | 0.37* | 1.38* | 0.47* | ||||
| (0.03) | (0.04) | (0.05) | (0.05) | |||||
| Reciprocity | 3.18* | 1.75* | 3.68* | 1.38* | ||||
| (0.90) | (0.11) | (0.11) | (0.14) | |||||
| Gender Homophily | 0.11* | 0.64* | 0.34* | 0.68* | ||||
| (0.05) | (0.07) | (0.06) | (0.09) | |||||
| Out-nom. | In-nom | Recip. Friends | Centrality | |
|---|---|---|---|---|
| Intercept | -2.54* | -2.55* | -0.93* | -0.14 |
| (0.34) | (0.63) | (0.26) | (0.23) | |
| Pregnant | -0.77 | -1.01* | -0.28 | -0.01 |
| (0.47) | (0.42) | (0.24) | (0.02) | |
| Random Intercept | 0.20 | 1.93 | 0.24 | 0.35 |
| Student-level residual | 10.06 | 7.8 | 2.50 | 0.01 |
| n | 240 | 240 | 240 | 240 |
| School n | 7 | 7 | 7 | 7 |
| Out-nom. | In-nom | |
|---|---|---|
| Intercept | 1.08* | 0.7* |
| (0.19) | (0.13) | |
| Pregnant | -0.37* | -0.28* |
| (0.18) | (0.13) | |
| Random Intercept | 0.12 | 0.06 |
| Student-level residual | 1.41 | 0.68 |
| n | 240 | 240 |
| School n | 7 | 7 |