
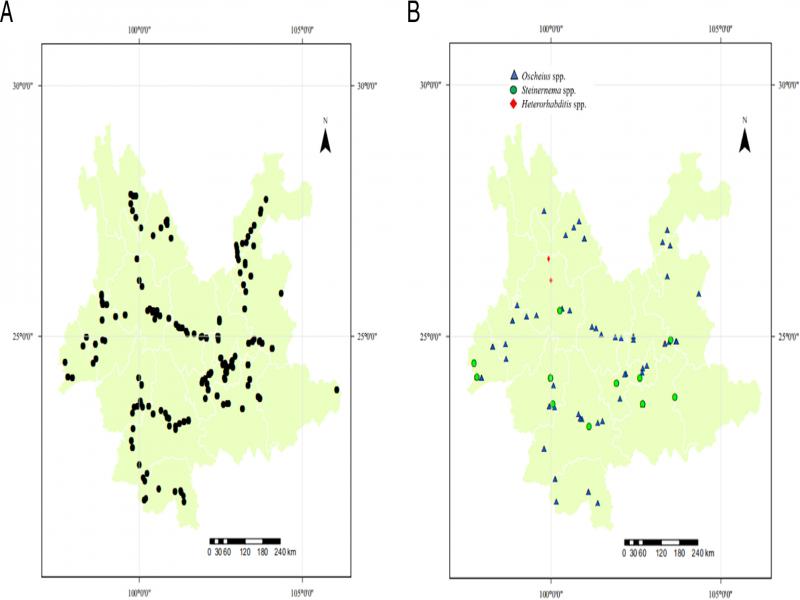
Figure 1:
The distribution map of collected soil samples and entomopthogenic nematodes in Yunnan province, China. A: collected soil samples. B: entomopathogenic nematodes.
Table 1.
Distribution of entomopathogenic nematodes in different habitats in Yunnan Province, China.
| Forest | Farmland | Grassland | Waterside | The edge of cropland | Total | |
|---|---|---|---|---|---|---|
| Soil sample No. | 287 | 249 | 99 | 34 | 120 | 789 |
| Heterorhabditis No. | 0 | 3 | 0 | 0 | 0 | 3 |
| Steinernema No. | 7 | 3 | 1 | 1 | 1 | 13 |
| Oscheius No. | 35 | 10 | 5 | 4 | 4 | 58 |
| Prevalence of Heterorhabditis and Steinernema (%) | 2.44 | 2.41 | 1.01 | 2.94 | 0.83 | 2.03 |
| Prevalence of Oscheius (%) | 12.20 | 4.02 | 5.05 | 11.76 | 3.33 | 7.35 |
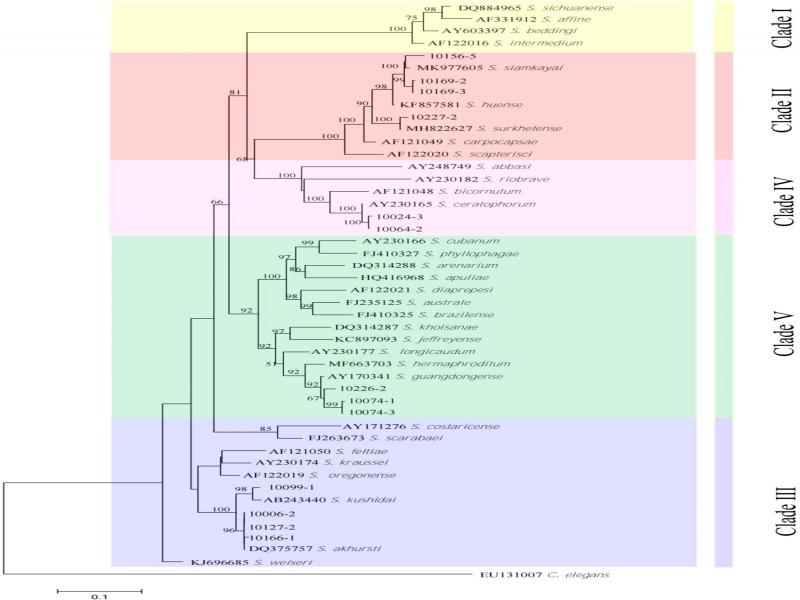
Figure 2:
Neighbor-Joining tree of the Steinernema populations. The tree was based on ITS rDNA data and Kimura 2-parameter model. Numbers on branches represent bootstrap support (>50%) based on 1,000 replicates. Scale represents K2P genetic distance.
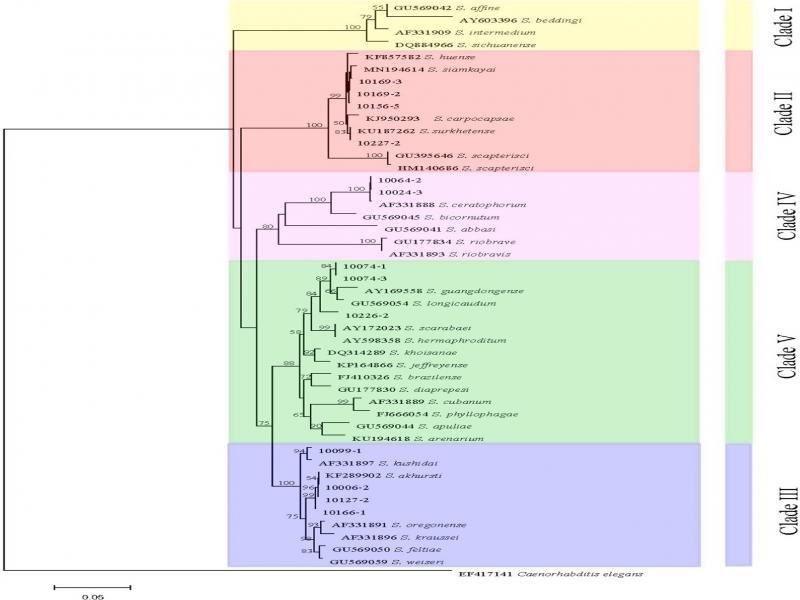
Figure 3:
Neighbor-Joining tree of the Steinernema populations. The tree was based on 28S rDNA data and Kimura 2-parameter model. Numbers on branches represent bootstrap support (>50%) based on 1,000 replicates. Scale represents K2P genetic distance.
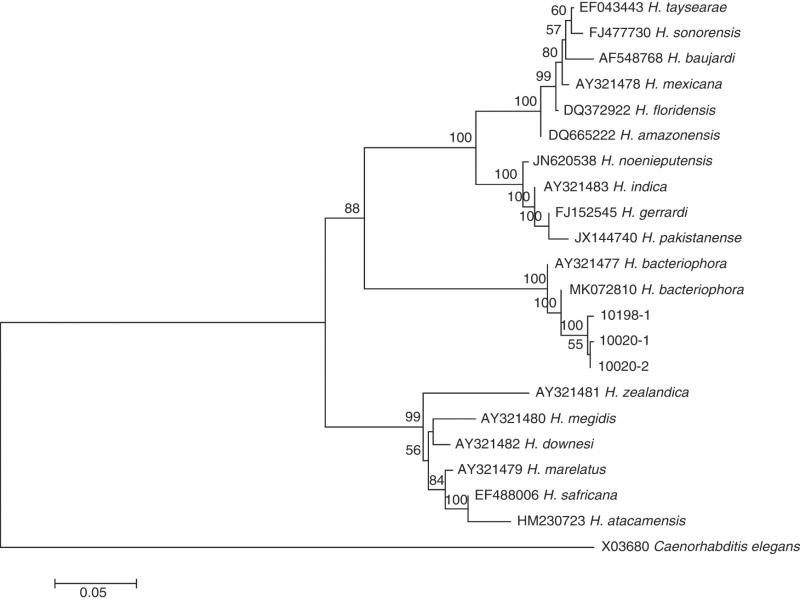
Figure 4:
Neighbor-Joining tree of the Heterorhabditis populations. The tree was based on ITS rDNA data and Kimura 2-parameter model. Numbers on branches represent bootstrap support (>50%) based on 1,000 replicates. Scale represents K2P genetic distance.
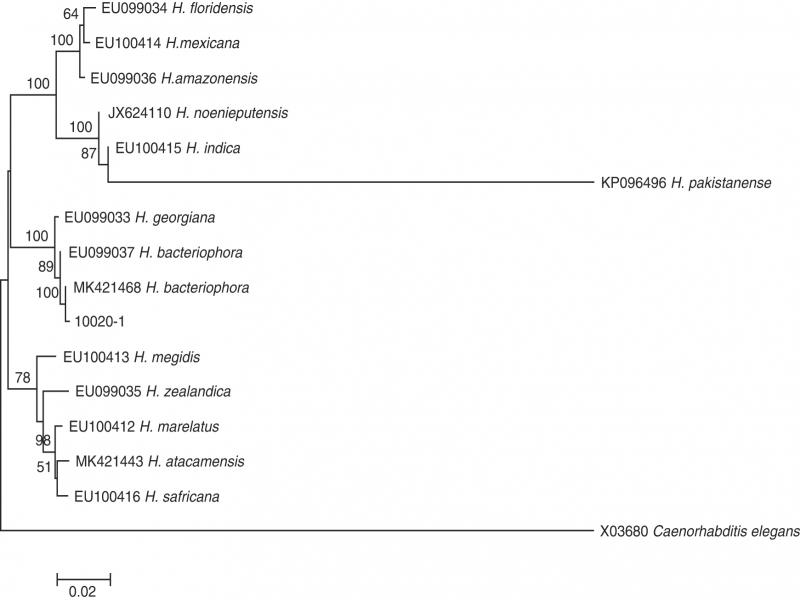
Figure 5:
Neighbor-Joining tree of the Heterorhabditis populations. The tree was based on 28S rDNA data and Kimura 2-parameter model. Numbers on branches represent bootstrap support (>50%) based on 1,000 replicates. Scale represents K2P genetic distance.
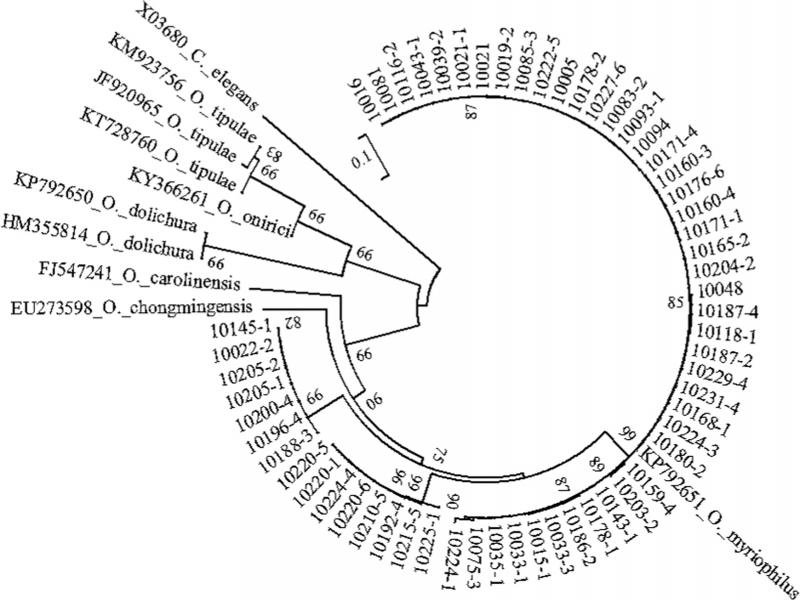
Figure 6:
Neighbor-Joining tree of the Oscheius populations. The tree was based on ITS rDNA data and Kimura 2-parameter model. Numbers on branches represent bootstrap support (>50%) based on 1,000 replicates. Scale represents K2P genetic distance.
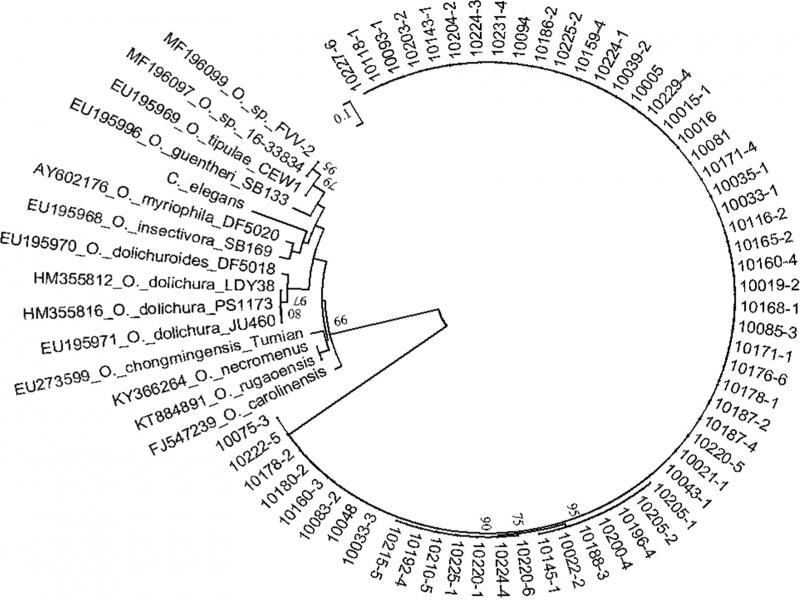
Figure 7:
Neighbor-Joining tree of the Oscheius populations. The tree was based on 28S rDNA data and Kimura 2-parameter model. Numbers on branches represent bootstrap support (>50%) based on 1,000 replicates. Scale represents K2P genetic distance.
Table 2.
The list of indigenous species in the genus of Heterorhabditis and Steinernema detected from Yunnan province, China Species and soil physicochemical parameters of the corresponding habitats.
| Soil No. | Habitat | Longitude | Latitude | Altitude (m) | pH | SOC (g/kg) | TN (g/kg) | CEC (cmol/kg) | Clay | Sand | Silt | |
|---|---|---|---|---|---|---|---|---|---|---|---|---|
| H. bacteriophora | 10020-1 | cropland | 24.856385 | 103.366102 | 1850 | 6.55 | 28.5 | 1.55 | 12.23 | 47 | 25 | 28 |
| 10020-2 | cropland | 24.856385 | 103.366102 | 1850 | 6.92 | 15.8 | 0.91 | 8.34 | 47 | 25 | 28 | |
| 10198-1 | cropland | 26.1089 | 99.9999 | 2055 | 7.65 | 64.4 | 3.26 | 21.54 | 36 | 39 | 25 | |
| S. akhursti | 10006-2 | forest | 25.51231 | 100.2601 | 2482 | 4.51 | 56 | 1.86 | 13.94 | 22 | 51 | 27 |
| S. akhursti | 10127-2 | forest | 24.16796 | 102.6275 | 1818 | 4.55 | 29.6 | 17.17 | 1.56 | 26 | 36 | 38 |
| S. ceratophorum | 10024-3 | forest | 24.93598 | 103.5364 | 1837 | 5.17 | 24.2 | 1.35 | 13.96 | 47 | 25 | 28 |
| S. ceratophorum | 10064-2 | cropland | 23.80083 | 103.6483 | 1456 | 7.84 | 19.5 | 1.19 | 23.91 | 36 | 39 | 25 |
| Steinernema sp. Sun 1 | 10074-1 | forest | 23.65063 | 102.7021 | 1391 | 6.84 | 21.6 | 1.17 | 7.77 | 36 | 39 | 25 |
| Steinernema sp. Sun 1 | 10074-3 | forest | 23.65063 | 102.7021 | 1391 | 6.57 | 74.9 | 3.58 | 18.52 | 36 | 39 | 25 |
| Steinernema sp. Sun 2 | 10099-1 | forest | 24.07291 | 101.9257 | 1861 | 6.06 | 40.6 | 23.57 | 1.52 | 36 | 39 | 25 |
| S. siamkayai | 10156-5 | waterside | 23.21695 | 101.1314 | 1117 | 6.94 | 24.7 | 14.35 | 1.39 | 22 | 51 | 27 |
| S. everestense | 10166-1 | cropland | 23.65539 | 100.0582 | 1820 | 5.06 | 69.4 | 40.27 | 3.34 | 31 | 36 | 33 |
| Steinernema sp. Sun 3 | 10169-2 | grassland | 24.17514 | 99.98811 | 1124 | 4.83 | 18 | 10.45 | 1.06 | 43 | 28 | 29 |
| Steinernema sp. Sun 3 | 10169-3 | grassland | 24.17514 | 99.98811 | 1124 | 4.93 | 42 | 24.34 | 2.11 | 43 | 28 | 29 |
| Steinernema sp. Sun 4 | 10226-2 | forest | 24.4748 | 97.7456 | 1096 | 6.24 | 5.64 | 3.27 | 0.23 | 39 | 34 | 27 |
| S. surkhetense | 10227-2 | cropland | 24.1877 | 97.8166 | 949 | 7.99 | 6.25 | 3.62 | 0.39 | 43 | 28 | 29 |
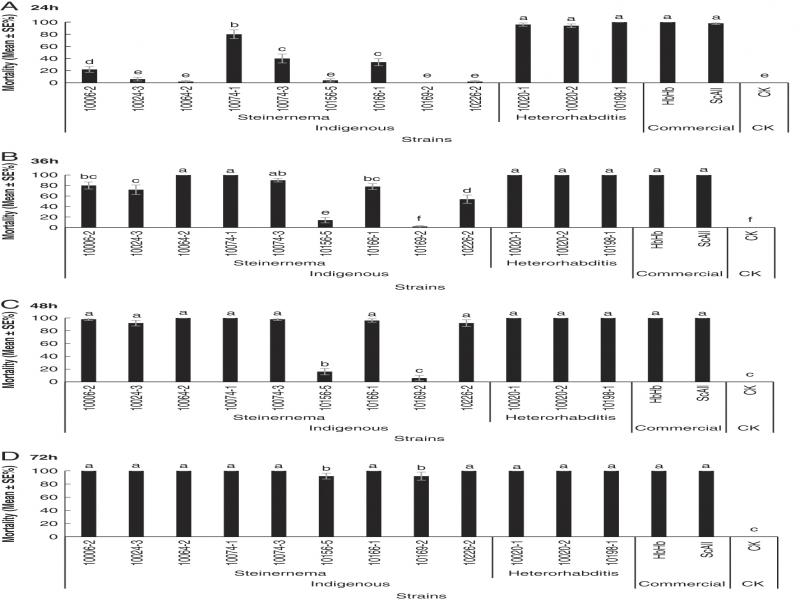
Figure 8:
Mortality rates (mean ± SE%) of Spodoptera litura larvae treated 24, 36, 48, and 72 hr by different populations of entomopathogenic nematodes at 100 infective juveniles per larva. HbHb: Heterorhabditis bacteriophora; Sc All: Steinernema carpocapsae; CK: Control. Bars with different letters represent significantly different means (SE) at p ≤ 0.05 among all treatments via the post hoc Duncan’s test.
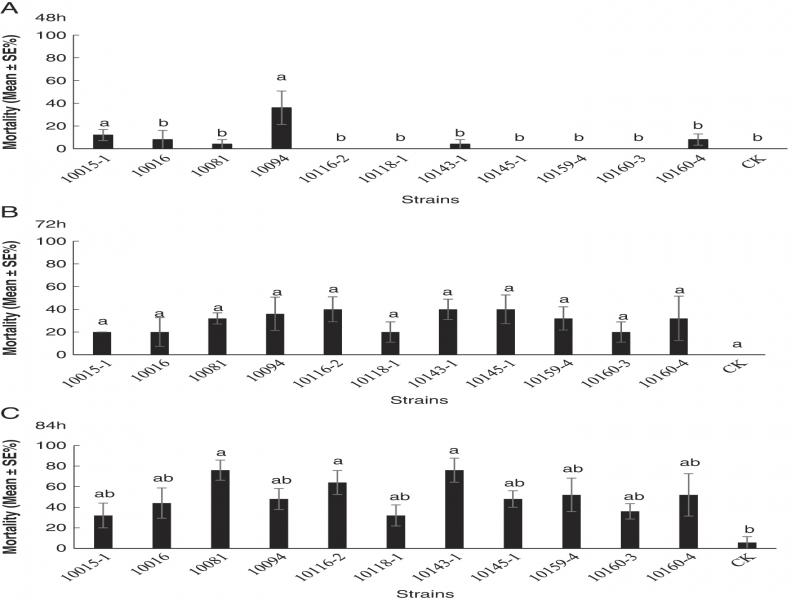
Figure 9:
Mortality rates (mean ± SE%) of Spodoptera litura larvae treated 48, 72, 84 hr by different populations of Oscheius at 100 infective juveniles per larva. CK: Control. Bars with different letters represent significantly different means (SE) at p ≤ 0.05 among all treatments via the post hoc Duncan’s test.