
Table 1.
Chemical properties of non-autoclaved and autoclaved soils used in the studya.
| Non-autoclaved | Autoclaved | ||||||
|---|---|---|---|---|---|---|---|
| Unit | DSL | BFSL | KLS | DSL | BFSL | KLS | |
| ppm | Ca | 22351 | 695 | 409 | 2085 | 376 | 230 |
| K | 283 | 72 | 58 | 271 | 49 | 68 | |
| Mg | 258 | 62 | 174 | 228 | 147 | 72 | |
| P | 281 | 36 | 28 | 262 | 32 | 20 | |
| Al | 393 | 274 | 107 | 312 | 86 | 184 | |
| B | 1.2 | 0.4 | 0.4 | 1.2 | 0.4 | 0.4 | |
| Cu | 1.4 | 1 | 2.7 | 1.2 | 1.5 | 0.8 | |
| Fe | 7 | 22 | 26 | 12 | 19 | 21 | |
| Mn | 91 | 36 | 20 | 590 | 86 | 246 | |
| Na | 46 | 39 | 38 | 48 | 40 | 36 | |
| Zn | 20 | 4 | 2.9 | 15 | 2.4 | 2.9 | |
| NO3-N | 11 | 27 | 12 | 7 | 8 | 21 | |
| CaCO3 | 3.8 | <1.0 | <1.0 | 2.5 | <1.0 | <1.0 | |
| Soluble salts | 238 | 238 | 1,428 | 381 | 159 | 254 | |
| mmhos/cm | Electrical conductivity | 0.19 | 0.19 | 1.12 | 0.3 | 0.12 | 0.2 |
| % | N | 0.25 | 0.07 | 0.035 | 0.24 | 0.029 | 0.07 |
| % | C | 2.99 | 1.38 | 0.54 | 3.12 | 0.5 | 1.41 |
| % | Organic Material | 5.1 | 2.4 | 0.9 | 5.4 | 0.9 | 2.4 |
| % | S | 0.031 | 0.009 | 0.0073 | 0.027 | 0.0066 | 0.013 |
| % | Moisture | 0.57 | 0.93 | 0.026 | 0.89 | 0.26 | 0.68 |
| cm3/cm3 | H2O availability | 0.16 | 0.09 | 0.08 | 0.16 | 0.07 | 0.09 |
| pH | 6.00 | 4.59 | 6.94 | 7.00 | 6.85 | 5.29 | |
1 Note: aSoil types include Kalmia loamy sand (KLS) collected from AU Plant Breeding Unit in Tallassee, AL, Benndale fine sandy loam (BFSL) collected from AU Brewton Agricultural Research Unit in Brewton, AL, and Decatur silt loam (DSL) and was analyzed at the Auburn University Soil Testing Laboratory.
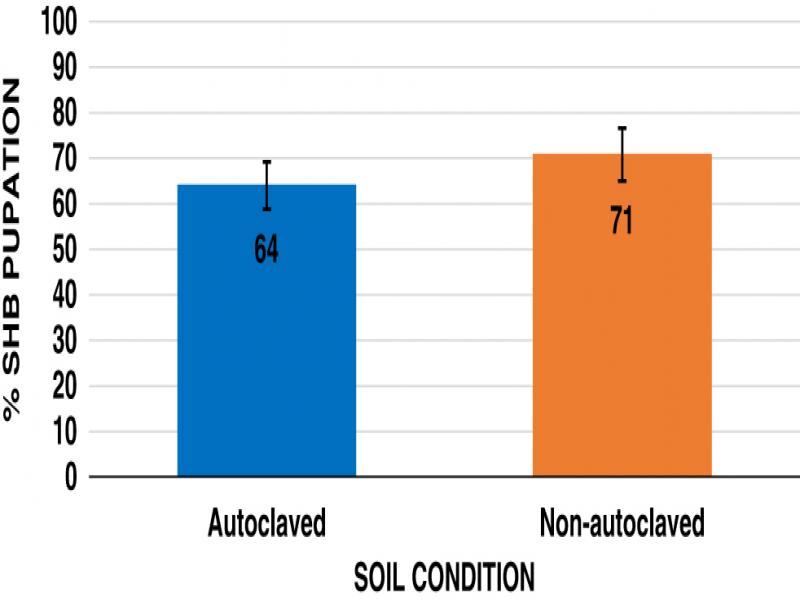
Figure 1:
Pupation survival rates of Aethina tumida, small hive beetle, wandering larvae in sterile autoclaved or natural non-autoclaved Kalmia loamy sand soil after 20 days. Means of bars with the same letter are not significantly different (Tukey–Kramer, p ≤ 0.05).
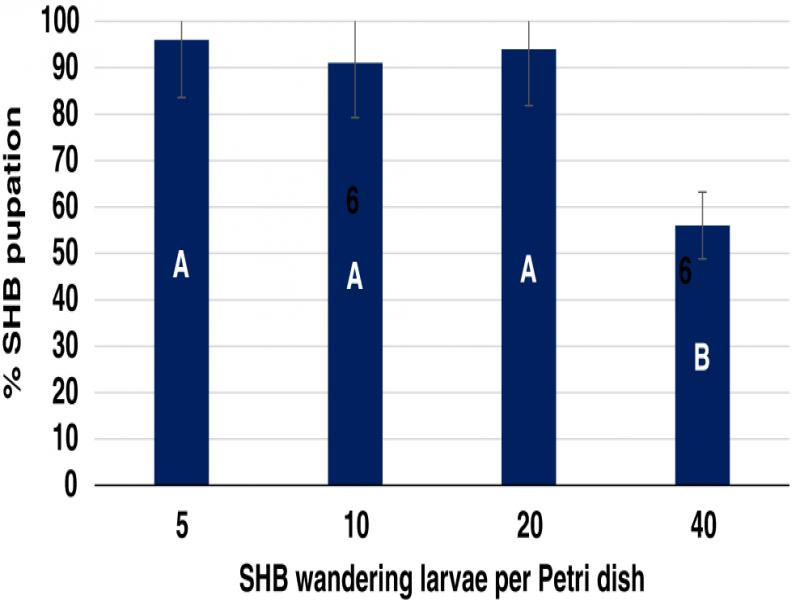
Figure 2:
Pupation survival rates of Aethina tumida, small hive beetle, wandering larvae at four population densities in sterile autoclaved and natural non-autoclaved Kalmia loamy sand after 20 days. Means of bars with the same letter are not significantly different (Tukey–Kramer, p≤0.05).
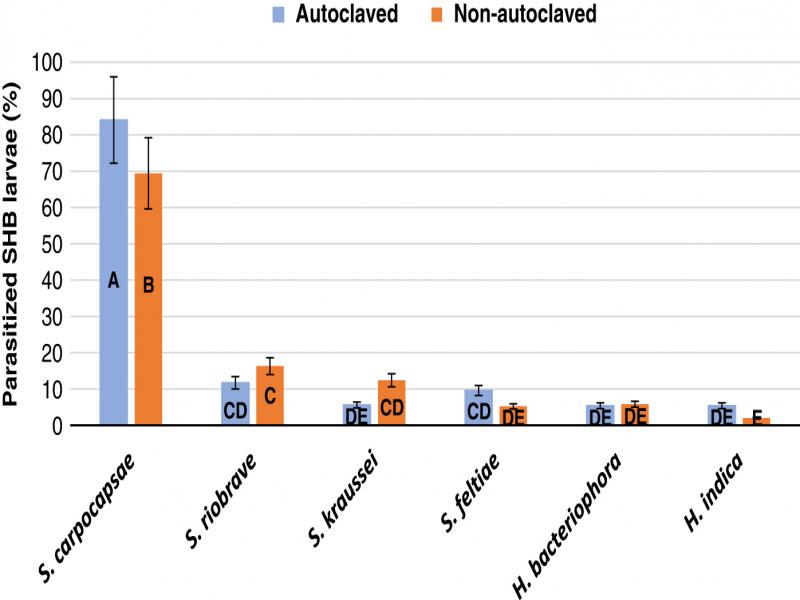
Figure 3:
Percent parasitization of Athina tumida, small hive beetle, wandering larvae after treatments of six purchased entomopathogenic nematode species in sterile autoclaved or natural non-autoclaved Kalmia loamy sand after 10 days. Means of bars with the same letter are not significantly different (Tukey–Kramer, p≤0.05).
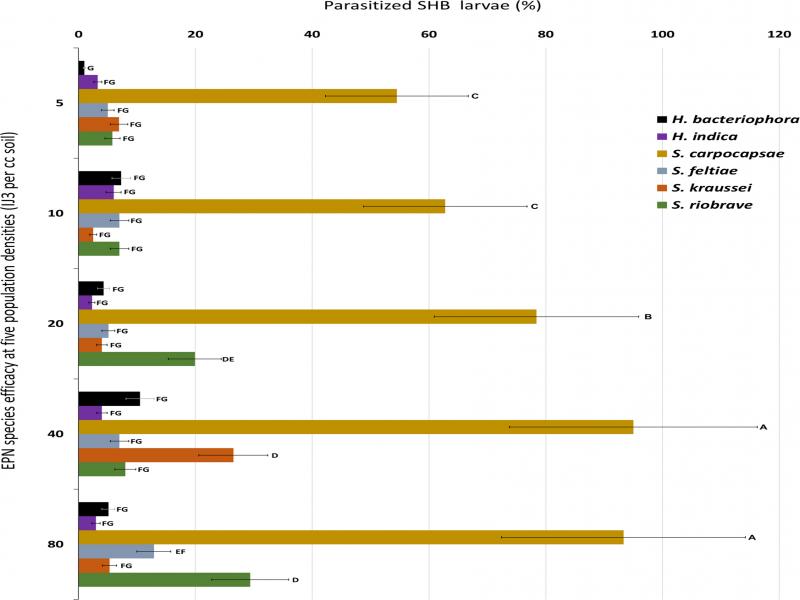
Figure 4:
Percent parasitization of Athina tumida, small hive beetle, wandering larvae after treatments of six purchased entomopathogenic nematode species at five EPN population densities in sterile autoclaved and natural non-autoclaved Kalmia loamy sand after 10 days. Means of bars with the same letter are not significantly different (Tukey–Kramer, p≤0.05).
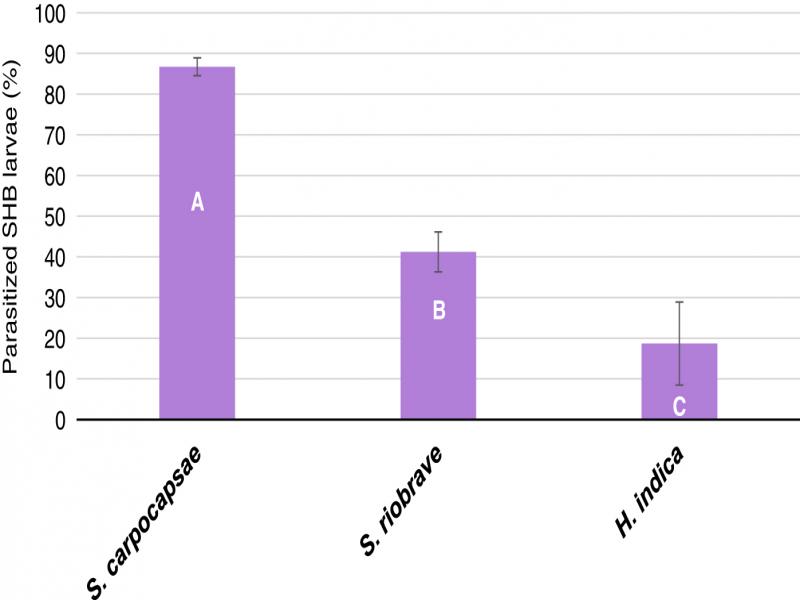
Figure 5:
Percent parasitization of Aethina tumida, small hive beetle (SHB), wandering larvae after treatments of three USDA reared entomopathogenic nematode (EPN) species in non-autoclaved Kalmia loamy sand at 50% field capacity after 10 days. Means of bars with the same letter are not significantly different (Tukey–Kramer, p ≤ 0.05).
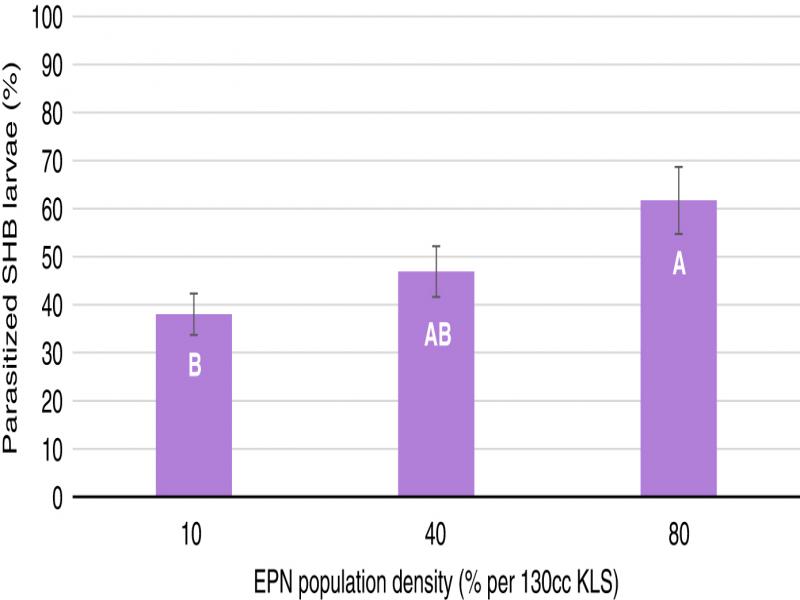
Figure 6:
Percent parasitization of Aethina tumida, small hive beetle (SHB), wandering larvae after treatments of three USDA reared entomopathogenic nematode (EPN) species at three population densities in non-autoclaved Kalmia loamy sand at 50% field capacity after 10 days. Means of bars with the same letter are not significantly different (Tukey–Kramer, p ≤ 0.05).
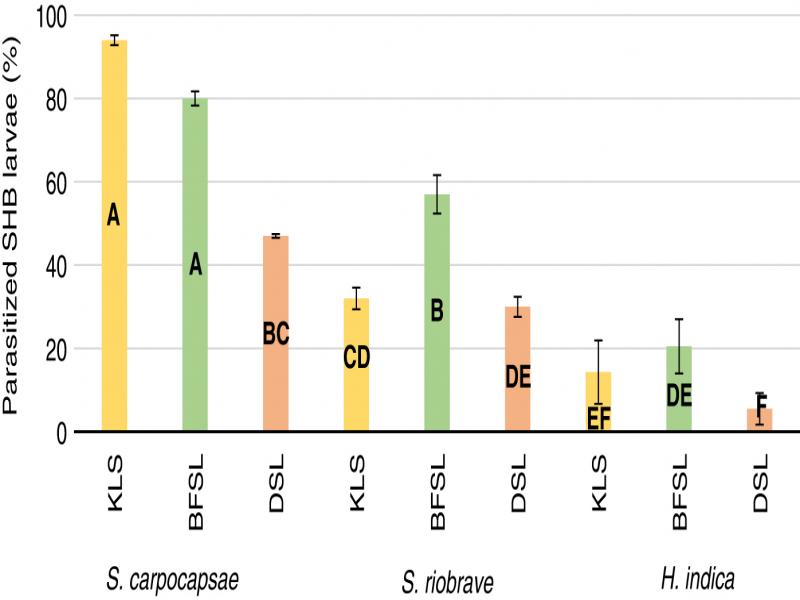
Figure 7:
Percent parasitization of Aethina tumida, small hive beetle, wandering larvae after treatments of three USDA reared entomopathogenic nematode species in a Kalmia loamy sand, Benndale fine sandy loam, and a Decatur silt loam soils types at 50% field capacity after 10 days. Means of bars with the same letter are not significantly different (Tukey–Kramer, p ≤ 0.05).
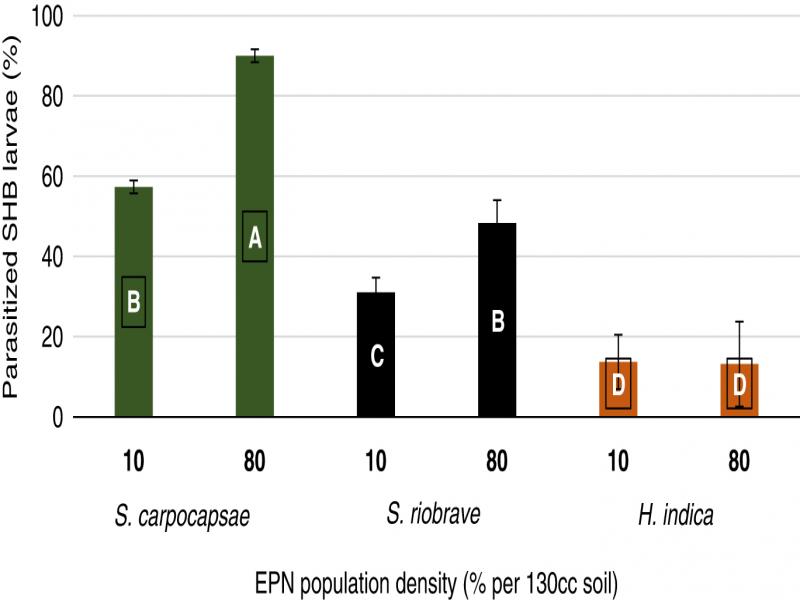
Figure 8:
Percent parasitization of Aethina tumida, small hive beetle, wandering larvae after treatments of three USDA reared entomopathogenic nematode species at two EPN population densities after 10 days. Means of bars with the same letter are not significantly different (Tukey–Kramer, p ≤ 0.05).