
Table 1.
Entomopathogenic nematodes and their symbiotic bacterial species previously detected in Egypt.
| Nematode species/genus | Authority | References |
|---|---|---|
| Heterorhabdits spp. | Poinar, 1976 | Shamseldean and Abd-Elgawad, 1994; Salama and Abd-Elgawad, 2001; Abd-Elbary et al., 2012 |
| Steinernema spp. | Travassos, 1927 | |
| H. bacteriophora | Poinar, 1976 | Abd-Elgawad and Nguyen, 2007 |
| H. egyptii | Abd-Elgawad and Ameen, 2005 | Abd-Elgawad and Ameen, 2005 |
| H. indica | Poinar, Karunakar & David, 1992 | Abu-Shady et al., 2011; Abd-Elbary et al., 2012; Shehata et al., 2019 |
| H. taysearae | Shamseldean, Abou El-Sooud, Abd-Elgawad & Saleh, 1996 | Shamseldean et al., 1996 |
| H. baujardi | Phan Subbotin, Nguyen & Moens, 2003 | Abd El-Rahman, 2006 |
| S. glaseri | (Steiner, 1929) Wouts, Mracek, Gerdin and Bedding, 1982 | Abd-Elbary et al., 2012; Abd-Elgawad et al., 2013 |
| S. abbasi | Elawad, Ahmad and Reid, 1997 | Abu-Shady et al., 2011; Abd-Elbary et al., 2012 |
| S. carpocasae | (Weiser, 1955) Wouts, Mracek, Gerdin and Bedding, 1982 | Abu-Shady et al., 2011; Abd-Elbary et al., 2012 |
| S. kushidai | Mamiya, 1988 | Shamseldean and Atwa, 2004 |
| S. arenarium | (Artyukhovsky, 1967) Wouts, Mracek, Gerdin and Bedding, 1982 | Abu-Shady et al., 2011; Abd-Elbary et al., 2012 |
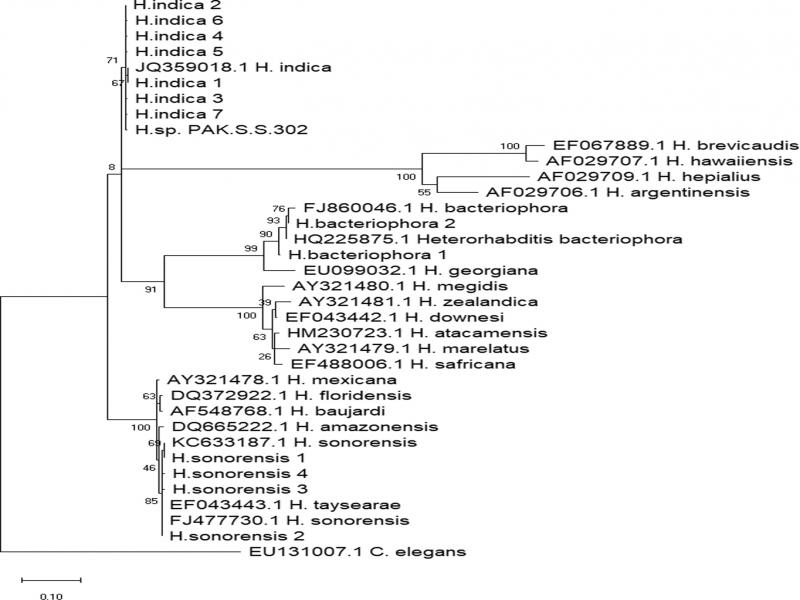
Figure 1:
Phylogenetic relationships of ASVs identified in the genus Steinernema based on sequencing reads of the ITS-2 region as inferred by the Maximum Likelihood method and Tamura-Nei model. The percentage of replicate trees in which the associated taxa clustered together in the bootstrap test (1,000 replicates) are shown next to the branches. All reference sequences are indicated by the NCBI accession numbers. The reference sequences were employed to confirm the right identification of each ASV in the phylogram. C. elegans was used as a global outgroup.
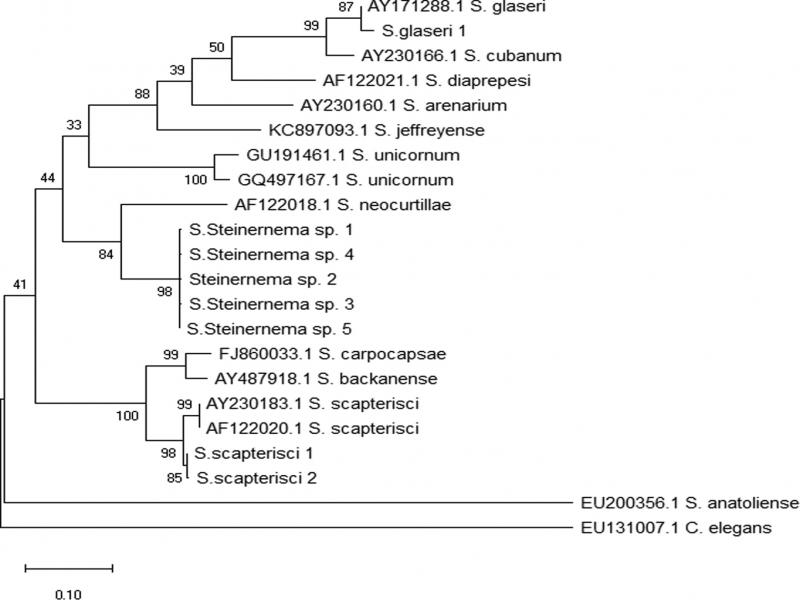
Figure 2:
Phylogenetic relationships of ASVs identified in the genus Heterorhabditis based on sequencing reads of the ITS_2 region as inferred by the Maximum Likelihood method and Tamura-Nei model. The percentage of replicate trees in which the associated taxa clustered together in the bootstrap test (1,000 replicates) are shown next to the branches. All reference sequences are indicated by the NCBI accession numbers. The reference sequences were employed to confirm the right identification of each ASV in the phylogram. C. elegans was used as a global outgroup.
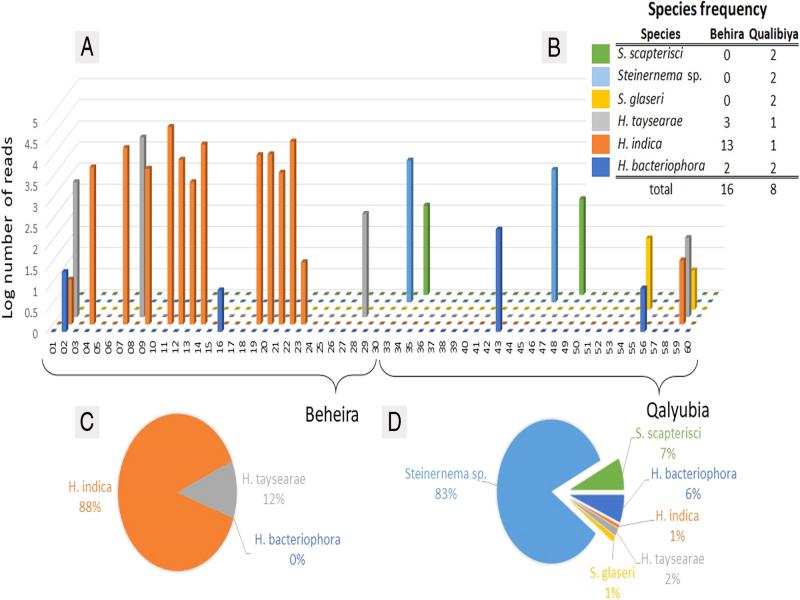
Figure 3:
Upper view, (A) sequencing reads abundance of the 6 entomopathogenic nematode species identified in El-Beheira (samples E01:E30) and Al-Qualibiya (samples E33:E60) and (B) number of sites where EPN species detected. Relative abundances of the entomopathogenic nematode species ASVs detected by metabarcoding in El-Beheira (C), and Al-Qualibaya (D).
Table 2.
Soil characteristics in the two regions of the citrus orchards in Egypt.
| Variable | Governorate | Mean ± SE | Min–Max | Regional differences | Hi | ||
|---|---|---|---|---|---|---|---|
| Sand % | El Beheira | 63.28 ± 5.21 | 20.8–88.8 | < 0.0001*** | 0.0046** | ||
| Al Qalyubia | 23.39 ± 0.92 | 12.8–36.8 | |||||
| Silt % | El Beheira | 16.67 ± 2.7 | 2–44 | 0.0001*** | 0.0028** | ||
| Al Qalyubia | 35.07 ± 0.44 | 28–38 | |||||
| Clay % | El Beheira | 20.09 ± 2.58 | 9–45.2 | < 0.0001*** | 0.0044** | ||
| Al Qalyubia | 41.61 ± 0.63 | 35.2–53.2 | |||||
| OM% | El Beheira | 1.81 ± 0.23 | 0.11–3.94 | 0.0038** | n.s. | ||
| Al Qalyubia | 2.904 ± 0.12 | 1.93–4.75 | |||||
| EC(1:5) | El Beheira | 0.307 ± 0.04 | 0.12–1.3 | 0.0013** | 0.0326* | ||
| Al Qalyubia | 0.3518 ± 0.02 | 0.2–0.6 | |||||
| pH | El Beheira | 7.44 ± 0.07 | 6.6–8 | 0.0068** | 0.0013** | ||
| Al Qalyubia | 7.04 ± 0.23 | 1–7.6 | |||||
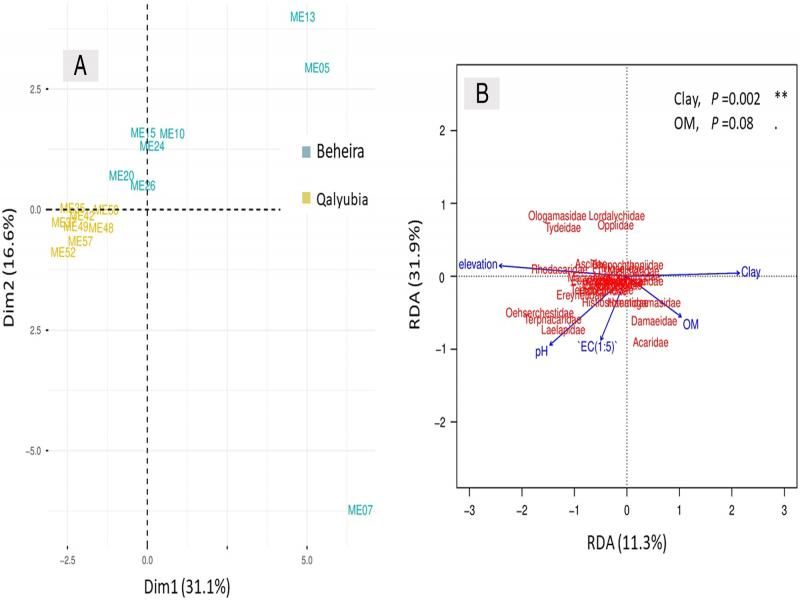
Figure 4:
Principal component analysis microarthropods family sequencing reads from samples collected in Beheira (n = 8) and Qualibiya (n = 8) (A) and Redundancy analyses depicting biplot of relationships between abiotic factors and soil microarthropods from both citrus ecoregions (B).
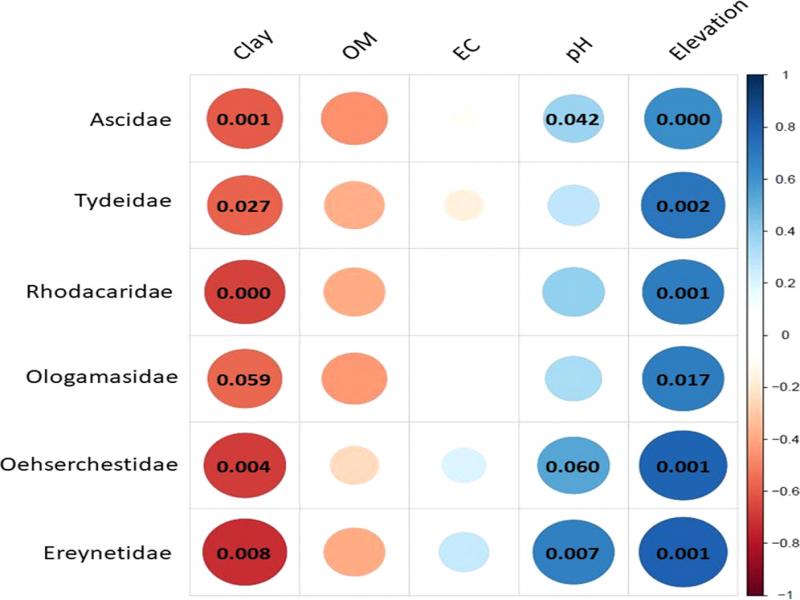
Figure 5:
Non-parametric Spearman’s correlations ( N = 16) between abiotic factors and those acari families with most prominent differences between the two regions (Table 3). Positive correlations are displayed in blue and negative correlations in red. Color intensity and the size of the circle are proportional to the correlation coefficients. Significant P-values are shown.
Table 3.
Microarthropod families whose occurrence differ significantly in two regions ecoregions evaluated by non-parametric test Kruskal-Wallis.
| Taxa | Kruskal–Wallis test |
|---|---|
| Ascidae | 0.0008*** |
| Tydeidae | 0.0031** |
| Rhodacaridae | 0.0031** |
| Ologamasidae | 0.0082** |
| Oehserchestidae | 0.0107* |
| Ereynetidae | 0.0273* |
| Eupodidae | 0.0273* |
| Damaeidae | 0.0645. |
| Oppiidae | 0.0645. |
| Terpnacaridae | 0.0645. |
| Laelapidae | 0.0738. |