
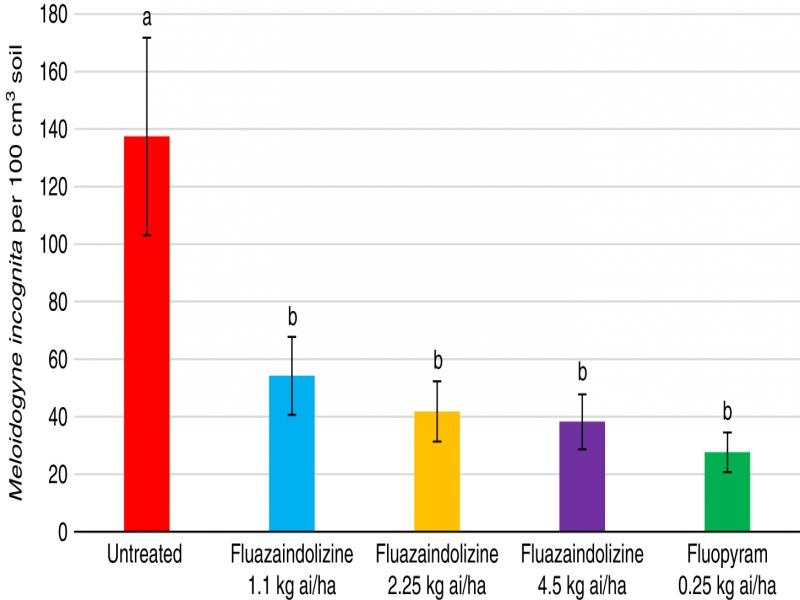
Figure 1:
2018 Meloidogyne incognita population density in greenhouse evaluations 84 days after treatment (DAT). Rates were applied as follows: Fluazaindolizine 1.1 kg ai/ha at weeks 0, 4, 8, 12; 2.25 kg ai/ha at weeks 0, 8; 4.5 kg ai/ha at week 0; fluopyram 0.25 kg ai/ha at weeks 0, 8. Means of bars with the same letter above them are not significantly different (Tukey–Kramer, P ≤ 0.05).
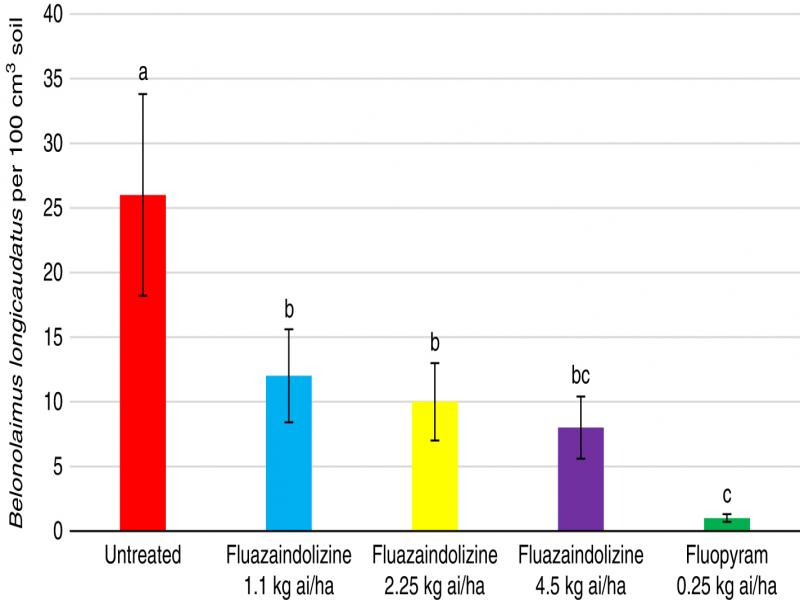
Figure 2:
2018 Belonolaimus longicaudatus population density in greenhouse evaluations 84 days after treatment (DAT). Rates were applied as follows: Fluazaindolizine 1.1 kg ai/ha at weeks 0, 4, 8, 12; 2.25 kg ai/ha at weeks 0, 8; 4.5 kg ai/ha at week 0; fluopyram 0.25 kg ai/ha at weeks 0, 8. Means of bars with the same letter above them are not significantly different (Tukey–Kramer, P ≤ 0.05).
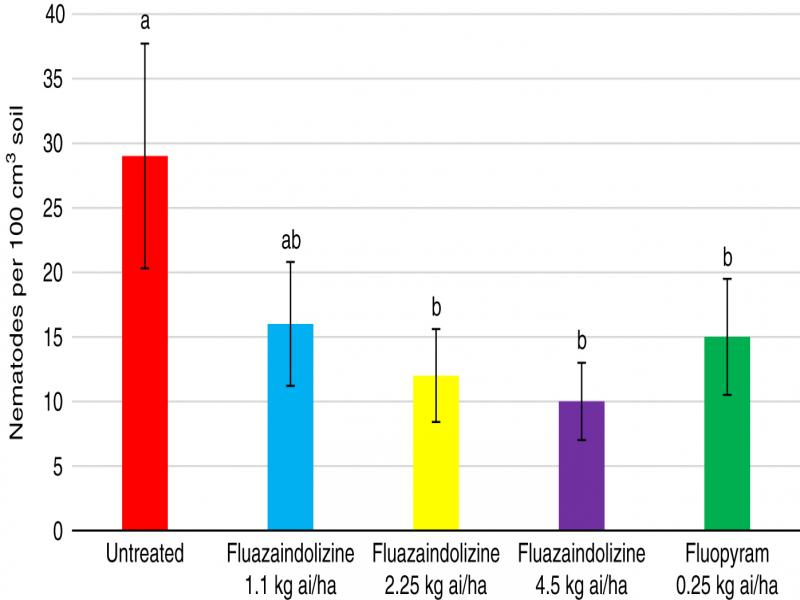
Figure 3:
2019 Belonolaimus longicaudatus population density in Auburn, AL greenhouse evaluations 84 days after treatment (DAT). Nematicide rates were applied as follows: Fluazaindolizine 1.1 kg ai/ha at weeks 0, 4, 8, 12; 2.25 kg ai/ha at weeks 0, 8; 4.5 kg ai/ha at week 0; fluopyram 0.25 kg ai/ha at weeks 0, 8. Means of bars with the same letter above them are not significantly different (Tukey–Kramer, P ≤ 0.05).
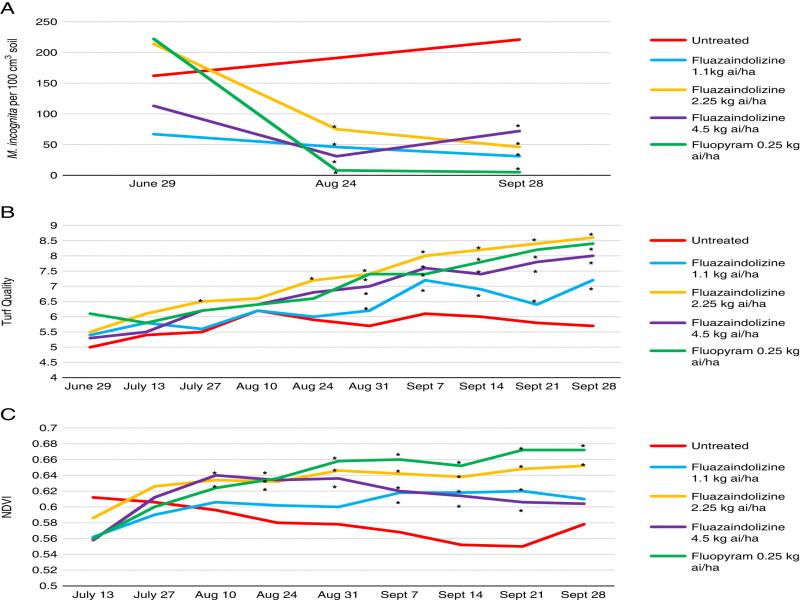
Figure 4:
Meloidogyne incognita population density (A), visual turfgrass quality (B), and NDVI values (C) as affected by nematicide applications through 2018 bermudagrass microplot evaluations in Auburn, AL, 2018. Nematicide rates were applied as follows: Fluazaindolizine 1.1 kg ai/ha at weeks 0, 4, 8, 12; 2.25 kg ai/ha at weeks 0, 8; 4.5 kg ai/ha at week 0; fluopyram 0.25 kg ai/ha at weeks 0, 8. *Different from the untreated according to the pairwise comparison of each treatment to the untreated control (Tukey–Kramer; P ≤ 0.05).
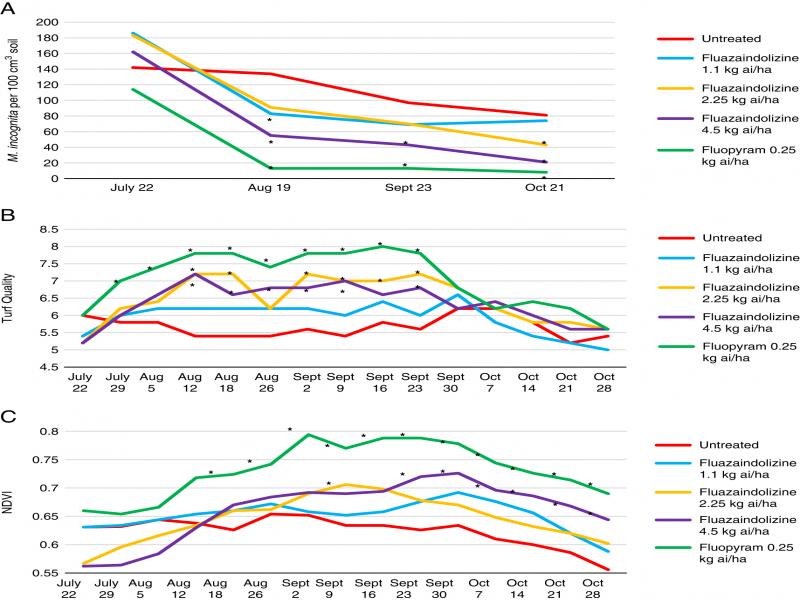
Figure 5:
Meloidogyne incognita population density (A), visual turfgrass quality (B), and NDVI values (C) as affected by nematicide treatments in 2019 bermudagrass microplot evaluations, Auburn, AL. Nematicide rates were applied as follows: Fluazaindolizine 1.1 kg ai/ha at weeks 0, 4, 8, 12; 2.25 kg ai/ha at weeks 0, 8; 4.5 kg ai/ha at week 0; fluopyram 0.25 kg ai/ha at weeks 0, 8. *Different from the untreated according to the pairwise comparison of each treatment to the untreated control (Tukey–Kramer; P ≤ 0.05).
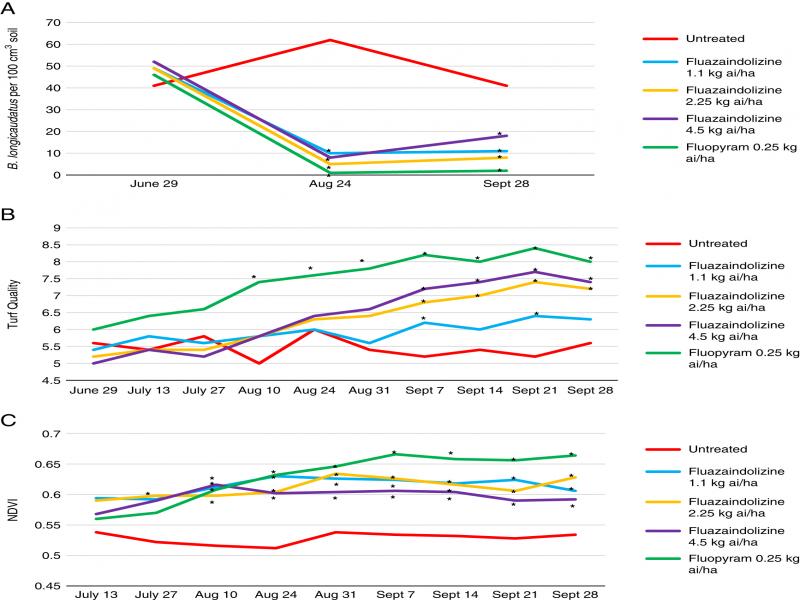
Figure 6:
Belonolaimus longicaudatus population density (A), visual turfgrass quality (B), and NDVI values (C) as affected by nematicide treatments in 2018 bermudagrass microplot evaluations, Auburn, AL. Nematicide rates were applied as follows: Fluazaindolizine 1.1 kg ai/ha at weeks 0, 4, 8, 12; 2.25 kg ai/ha at weeks 0, 8; 4.5 kg ai/ha at week 0; fluopyram 0.25 kg ai/ha at weeks 0, 8. *Different from the untreated according to the pairwise comparison of each treatment to the untreated control (Tukey–Kramer; P ≤ 0.05).
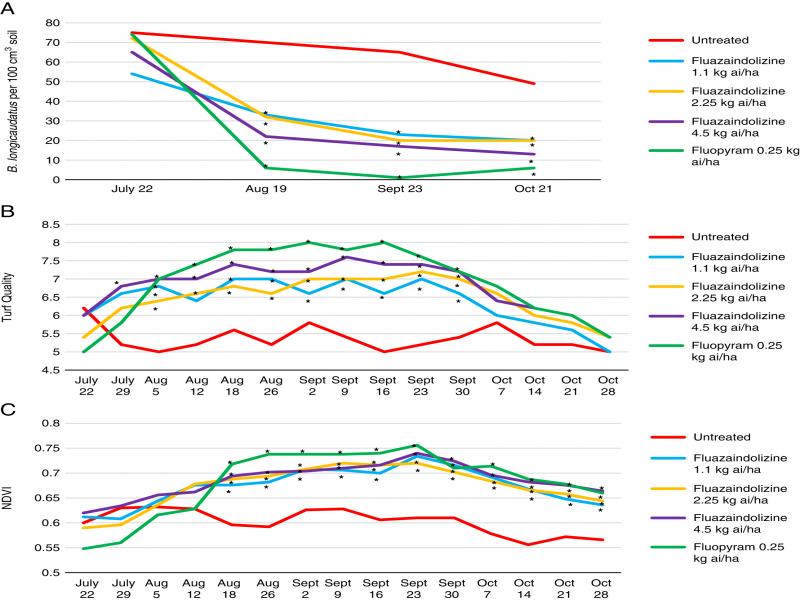
Figure 7:
Belonolaimus longicaudatus population density (A), visual turfgrass quality (B), and NDVI values (C) as affected by nematicide treatments in 2019 bermudagrass microplot evaluations, Auburn, AL. Nematicide rates were applied as follows: Fluazaindolizine 1.1 kg ai/ha at weeks 0, 4, 8, 12; 2.25 kg ai/ha at weeks 0, 8; 4.5 kg ai/ha at week 0; fluopyram 0.25 kg ai/ha at weeks 0, 8. *Different from the untreated according to the pairwise comparison of each treatment to the untreated control (Tukey–Kramer; P ≤ 0.05).
Table 1.
Pearson correlation coefficients † resulting from linear correlation of Meloidogyne incognita and Belonolaimus longicaudatus population density in microplot bermudagrass with visual turfgrass quality and NDVI values in Auburn, AL for 2018 and 2019.
| 2018 | ||||
| June 29 | August 24 | September 28 | ||
| Meloidogyne incognita population density | ||||
| Visual quality ‡ | 0.05 | 0.05 | −0.77*** | |
| NDVI § | N/A | −0.24 | −0.52** | |
| Belonolaimus longicaudatus population density | ||||
| Visual quality | −0.08 | −0.64*** | −0.60** | |
| NDVI | N/A | −0.62*** | −0.54** | |
| 2019 | ||||
| July 22 | August 19 | September 23 | October 21 | |
| Meloidogyne incognita population density | ||||
| Visual quality | −0.78*** | −0.60** | −0.38* | −0.38* |
| NDVI | −0.77*** | −0.49* | −0.51** | −0.47* |
| Belonolaimus longicaudatus population density | ||||
| Visual quality | −0.73*** | −0.78*** | −0.75*** | −0.75*** |
| NDVI | −0.63*** | −0.79*** | −0.81*** | −0.73*** |
1 Notes: †*,**,***Tests of linear correlation between variables were not significant or were significant at P ≤ 0.05, P ≤ 0.01, or P ≤ 0.001, respectively. ‡Visual quality ratings were assigned on a 1 to 9 scale, where 1 = poorest turf quality, 6 = minimally acceptable turf quality, and 9 = exceptional turf quality. §NDVI = (840 nm reflectance – 668 nm reflectance) ÷ (840 nm reflectance – 668 nm reflectance) collected using a MicaSense RedEdge-M (MicaSense, Inc., Seattle, WA) sensor.
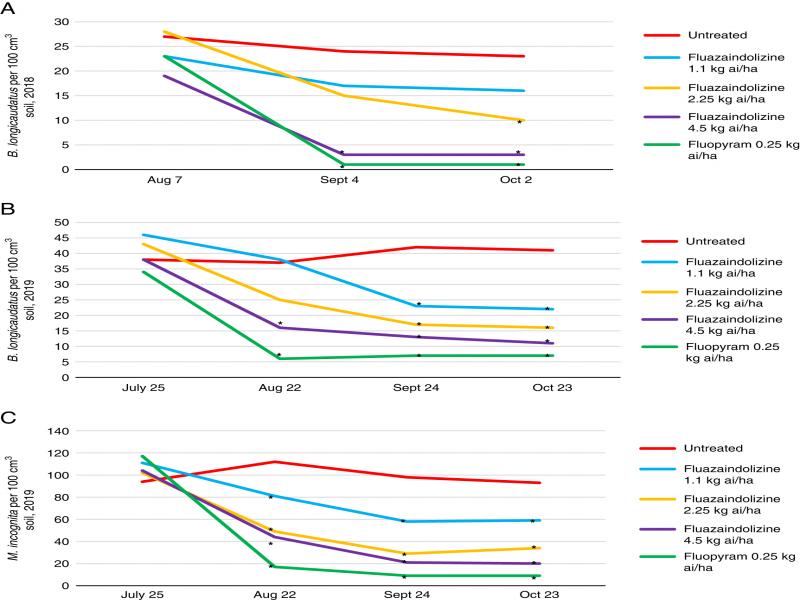
Figure 8:
Belonolaimus longicaudatus population density in 2018 (A) and 2019 (B), and Meloidogyne incognita population density in 2019 (C) as affected by nematicide treatments in nematicide trials at Fairhope, AL. Nematicide rates were applied as follows: Fluazaindolizine 1.1 kg ai/ha at weeks 0, 4, 8, 12; 2.25 kg ai/ha at weeks 0, 8; 4.5 kg ai/ha at week 0; fluopyram 0.25 kg ai/ha at weeks 0, 8. *Different from the untreated according to the pairwise comparison of each treatment to the untreated control (Tukey–Kramer; P ≤ 0.05).