
Table 1.
Media components of NcMs and NGM.
| Source of cholesterola | |||||||||||||||||||||||||
|---|---|---|---|---|---|---|---|---|---|---|---|---|---|---|---|---|---|---|---|---|---|---|---|---|---|
| Plant cooking oil | Chicken egg | Pig fat | Mushroom | Soil | |||||||||||||||||||||
| Component (Amount/ L) | NcM | NcM | NcM | NcM | NcM | NcM | NcM | NcM | NcM | NcM | NcM | NcM | NcM | NcM | NcM | NcM | NcM | NcM | NcM | NcM | NcM | NcM | NcM | NcM | NcM |
| Plant cooking oil (100 µL) | Ѵ | Ѵ | Ѵ | Ѵ | Ѵ | Ѵ | |||||||||||||||||||
| Chicken egg (0.56 g) | Ѵ | Ѵ | Ѵ | Ѵ | Ѵ | Ѵ | |||||||||||||||||||
| Pig fat (0.4 g) | Ѵ | Ѵ | Ѵ | Ѵ | Ѵ | Ѵ | |||||||||||||||||||
| Autoclaved mushroom solution (20 mL) | Ѵ | Ѵ | Ѵ | Ѵ | Ѵ | Ѵ | Ѵ | Ѵ | Ѵ | Ѵ | Ѵ | Ѵ | |||||||||||||
| Non-autoclaved mushroom solution (20 mL) | Ѵ | Ѵ | Ѵ | ||||||||||||||||||||||
| Pure mineral mixture (1 mL of 1 M CaCl2, 1 mL of 1 M MgSO4, 25 mL of 1 M KPO4) | Ѵ | Ѵ | Ѵ | Ѵ | Ѵ | Ѵ | Ѵ | Ѵ | |||||||||||||||||
| Soil solution b (10 mL) | Ѵ | Ѵ | Ѵ | Ѵ | Ѵ | Ѵ | Ѵ | Ѵ | Ѵ | ||||||||||||||||
| Agar (17 g) | Ѵ | Ѵ | Ѵ | Ѵ | Ѵ | Ѵ | Ѵ | Ѵ | Ѵ | Ѵ | Ѵ | Ѵ | Ѵ | Ѵ | Ѵ | Ѵ | Ѵ | Ѵ | Ѵ | Ѵ | Ѵ | Ѵ | Ѵ | Ѵ | Ѵ |
| NaCl (4 mL of 0.75 g/ mL) | Ѵ | Ѵ | Ѵ | Ѵ | Ѵ | Ѵ | Ѵ | Ѵ | Ѵ | Ѵ | Ѵ | Ѵ | Ѵ | Ѵ | Ѵ | Ѵ | Ѵ | Ѵ | Ѵ | Ѵ | Ѵ | Ѵ | Ѵ | ||
| Media type | NcM | NcM | NcM | NcM | NcM | NcM | NcM | NcM | NcM | NcM | NcM | NcM | NcM | NcM | NcM | NcM | NcM | NcM | NcM | NcM | NcM | NcM | NcM | NcM | NcM |
| 1 | 2 | 3 | 4 | 5 | 6 | 7 | 8 | 9 | 10 | 11 | 12 | 13 | 14 | 15 | 16 | 17 | 18 | 19 | 20 | 21 | 22 | 23 | 24 | 25 | |
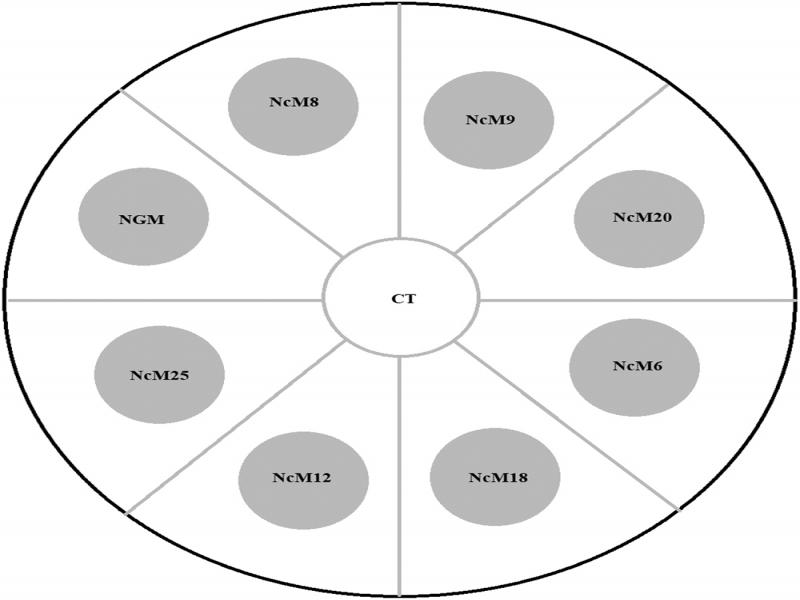
Figure 1:
Schematic of media preference assay. OP50-seeded plugs of the eight indicated NcMs (grey circles) are placed onto a 9 cm-diameter plain agar plate 1 h before the preference assay. At the start of the assay, 30 well-fed young adult F2 worms are placed within the center circle (CT) and then allowed to migrate. After 2 h, the locations of the worms were recorded.
Table S1.
Brood sizes of C. elegans on 25 test media and the NGM control.
| Media | Number of tested hermaphrodites | Total brood size (Mean ± SE) | Dunnett’s post-hoc P-value |
|---|---|---|---|
| NGM | 39 | 254.7 ± 12.8 | Control |
| NcM1 | 57 | 144.9 ± 8.8 | <0.001 |
| NcM2 | 50 | 123.8 ± 8.7 | <0.001 |
| NcM3 | 55 | 157.5 ± 10.6 | <0.001 |
| NcM4 | 55 | 123.8 ± 14.4 | <0.001 |
| NcM5 | 25 | 142.9 ± 14.8 | <0.001 |
| NcM6 | 42 | 240.5 ± 18.0 | 0.0228 |
| NcM7 | 17 | 171.1 ± 18.3 | <0.001 |
| NcM8 | 26 | 265.8 ± 8.7 | 0.5468 |
| NcM9 | 32 | 194.5 ± 9.1 | <0.001 |
| NcM10 | 29 | 152.3 ± 17.3 | <0.001 |
| NcM11 | 24 | 163.9 ± 12.5 | <0.001 |
| NcM12 | 21 | 234.0 ± 8.8 | 0.1817 |
| NcM13 | 50 | 128.9 ± 14.2 | <0.001 |
| NcM14 | 47 | 183.6 ± 7.5 | <0.001 |
| NcM15 | 43 | 203.6 ± 7.9 | <0.001 |
| NcM16 | 40 | 198.6 ± 9.3 | <0.001 |
| NcM17 | 38 | 177.2 ± 17.5 | <0.001 |
| NcM18 | 44 | 251.7 ± 16.2 | 1.0 |
| NcM19 | 38 | 163.2 ± 12.9 | <0.001 |
| NcM20 | 35 | 48.7 ± 12.9 | <0.001 |
| NcM21 | 26 | 178.9 ± 12.4 | <0.001 |
| NcM22 | 35 | 183.4 ± 11.6 | <0.001 |
| NcM23 | 16 | 138.4 ± 17.3 | <0.001 |
| NcM24 | 39 | 178.7 ± 9.5 | <0.001 |
| NcM25 | 45 | 167.0 ± 8.2 | <0.001 |
1 Note: Gray shading highlights the three media on which worms had brood sizes not different from NGM. Pink shading highlights NcM6 which was only slightly inferior to NGM. Worms on all the remaining NcM media yielded fewer worms than NGM control (yellow). The standard errors (SE) and error bars for each data set are the SE among P0 batches and not the SE across individual P0s.
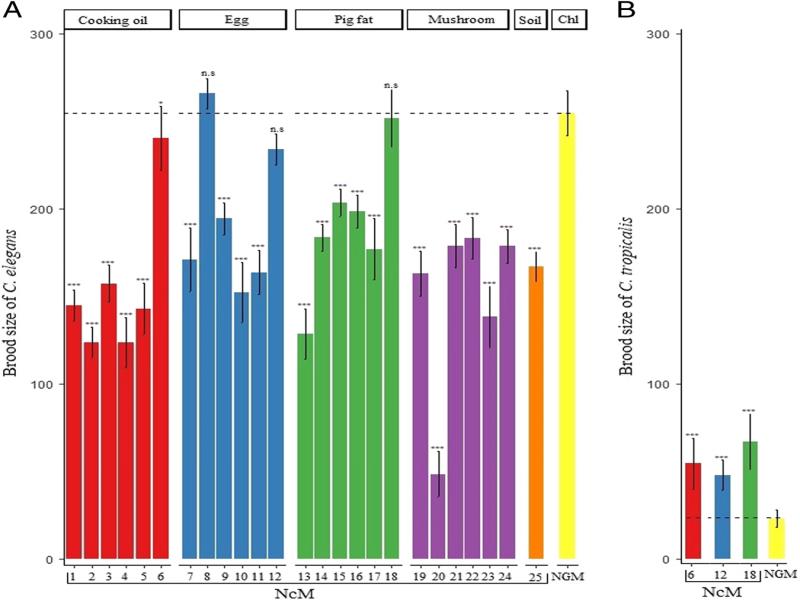
Figure 2:
Brood sizes of C. elegans and C. tropicalis on test media and the NGM control. (A) The total self-brood sizes of C. elegans are presented as means ± 1 SE. Brood sizes differed among the media (P < 2e−16, F = 97.0, one-way ANOVA test). The Dunnett’s post-hoc test was used for brood-size comparisons of the test media against the NGM control (*** P < 0.001; n.s, not significant, i.e., P > 0.05), see Table S1 for exact P-values. Chl, cholesterol. (B) The total self-brood sizes of C. tropicalis differed among the 3 NcMs and NGM (P = 6.3e−10, F = 17.9, one-way ANOVA test). The Dunnett’s post-hoc test is used for brood-size comparisons of the media against the NGM control (*** P < 0.001; *P < 0.5), see Table S2 for exact P-values. Note: The standard errors (SE) and error bars for each data set are the SE among P0 batches and not the SE across individual P0s.
Table S2.
Brood sizes of C. tropicalis on different media and the NGM control.
| Media | Number of tested hermaphrodites | Total brood size (Mean ± SE) | Dunnett’s post hoc P-values |
|---|---|---|---|
| NGM | 37 | 23.3 ± 5.0 | Control |
| NcM6 | 42 | 54.8 ± 14.6 | <0.001 |
| NcM12 | 37 | 48.2 ± 8.4 | <0.001 |
| NcM18 | 32 | 67.2 ± 15.7 | <0.001 |
Table S3.
Lifespan assays of C. elegans on 8 different media.
| Media | Number of tested hermaphrodites | Lifespan (days) Mean ± SE | Log-rank P-value |
|---|---|---|---|
| NGM | 73 | 15.2 ± 0.4 | Control |
| NcM6 | 70 | 14.8 ± 0.3 | 1.0 |
| NcM8 | 72 | 14.5 ± 0.4 | 1.0 |
| NcM9 | 34 | 21.9 ± 0.9 | 4e−09 |
| NcM12 | 66 | 15.6 ± 0.4 | 1.0 |
| NcM18 | 50 | 15.1 ± 0.5 | 1.0 |
| NcM20 | 63 | 16.9 ± 0.5 | 0.39 |
| NcM25 | 57 | 18.8 ± 0.6 | 2.4e−05 |
Table S4.
Number of surviving C. elegans worms on 8 different media at each day of the lifespan assays.
| Number of surviving worms | ||||||||
|---|---|---|---|---|---|---|---|---|
| Day | NGM | NcM6 | NcM8 | NcM9 | NcM12 | NcM18 | NcM20 | NcM25 |
| 1 | 73 | 70 | 72 | 34 | 66 | 50 | 63 | 57 |
| 2 | 73 | 70 | 72 | 34 | 66 | 50 | 63 | 57 |
| 3 | 73 | 70 | 72 | 34 | 66 | 50 | 63 | 57 |
| 4 | 73 | 70 | 72 | 34 | 66 | 50 | 63 | 57 |
| 5 | 72 | 69 | 72 | 34 | 66 | 49 | 63 | 57 |
| 6 | 72 | 69 | 72 | 34 | 65 | 49 | 63 | 57 |
| 7 | 70 | 69 | 70 | 34 | 64 | 48 | 62 | 55 |
| 8 | 70 | 69 | 70 | 34 | 64 | 48 | 61 | 54 |
| 9 | 70 | 68 | 70 | 34 | 62 | 46 | 59 | 52 |
| 10 | 67 | 68 | 63 | 32 | 61 | 46 | 59 | 52 |
| 11 | 63 | 68 | 55 | 31 | 60 | 45 | 58 | 51 |
| 12 | 58 | 62 | 48 | 30 | 57 | 42 | 56 | 51 |
| 13 | 52 | 55 | 41 | 30 | 54 | 39 | 52 | 51 |
| 14 | 46 | 42 | 36 | 30 | 49 | 33 | 51 | 50 |
| 15 | 33 | 23 | 32 | 30 | 37 | 17 | 47 | 49 |
| 16 | 21 | 12 | 18 | 30 | 26 | 13 | 36 | 39 |
| 17 | 12 | 5 | 14 | 28 | 15 | 9 | 28 | 38 |
| 18 | 11 | 4 | 8 | 28 | 11 | 6 | 21 | 33 |
| 19 | 10 | 3 | 7 | 28 | 7 | 5 | 14 | 30 |
| 20 | 6 | 2 | 3 | 27 | 3 | 4 | 10 | 28 |
| 21 | 5 | 1 | 3 | 21 | 0 | 2 | 7 | 17 |
| 22 | 2 | 0 | 1 | 16 | 1 | 2 | 9 | |
| 23 | 2 | 1 | 14 | 1 | 1 | 8 | ||
| 24 | 2 | 1 | 11 | 1 | 0 | 5 | ||
| 25 | 1 | 1 | 7 | 1 | 0 | |||
| 26 | 0 | 0 | 4 | 1 | ||||
| 27 | 3 | 1 | ||||||
| 28 | 2 | 1 | ||||||
| 29 | 2 | 0 | ||||||
| 30 | 1 | |||||||
| 31 | 0 | |||||||
| Censored | 7 | 10 | 8 | 6 | 14 | 5 | 17 | 23 |
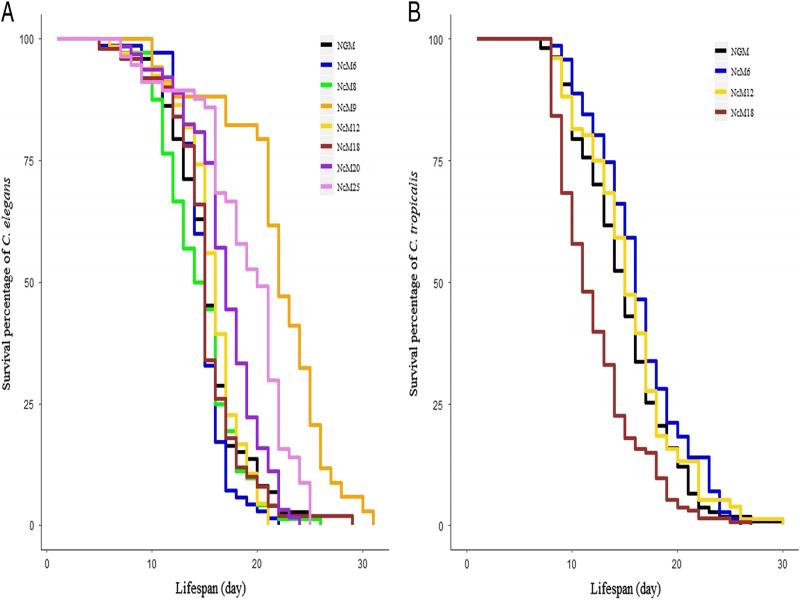
Figure 3:
Lifespan assays of C. elegans and C. tropicalis on different media and the NGM control. (A) C. elegans worms grown on NcM9, NcM20, and NcM25 survived longer than on the NGM control (all P ≤ 0.01, log-rank test), while worms grown on NcM6, NcM8, NcM12, and NcM18 had similar lifespans as the control (P ≥ 0.1, log-rank test). Detailed lifespan data are in Tables S3 and S4. (B) C. tropicalis worms grown on NcM6 and NcM12 have similar lifespans as the NGM control (both P > 0.05, log-rank test), while worms grown on NcM18 have shorter lifespans than the control (P < 2e−5, log-rank test), see Tables S5 and S6.
Table S5.
Lifespan of C. tropicalis on 4 different media.
| Media | Number of tested hermaphrodites | Lifespan (days) Mean ± SE | Log-rank P-value |
|---|---|---|---|
| NGM | 107 | 14.96 ± 0.42 | Control |
| NcM6 | 71 | 16.35 ± 0.51 | 0.4 |
| NcM12 | 76 | 15.49 ± 0.53 | 1.0 |
| NcM18 | 133 | 12.3 ± 0.35 | 1.3e−05 |
Table S6.
Number of surviving C. tropicalis worms on 4 different media at each day of the lifespan assays.
| Number of surviving worms | ||||
|---|---|---|---|---|
| Day | NGM | NcM6 | NcM12 | NcM18 |
| 1 | 107 | 71 | 76 | 133 |
| 2 | 107 | 71 | 76 | 133 |
| 3 | 107 | 71 | 76 | 133 |
| 4 | 107 | 71 | 76 | 133 |
| 5 | 107 | 71 | 76 | 133 |
| 6 | 107 | 71 | 76 | 133 |
| 7 | 105 | 71 | 76 | 133 |
| 8 | 103 | 70 | 73 | 112 |
| 9 | 97 | 68 | 67 | 91 |
| 10 | 85 | 63 | 62 | 77 |
| 11 | 81 | 60 | 61 | 64 |
| 12 | 75 | 57 | 57 | 53 |
| 13 | 66 | 53 | 52 | 44 |
| 14 | 56 | 47 | 45 | 30 |
| 15 | 46 | 42 | 36 | 24 |
| 16 | 36 | 33 | 30 | 21 |
| 17 | 27 | 24 | 21 | 20 |
| 17 | 22 | 20 | 14 | 13 |
| 19 | 17 | 15 | 12 | 7 |
| 20 | 13 | 13 | 10 | 5 |
| 21 | 7 | 10 | 10 | 4 |
| 22 | 4 | 10 | 4 | 2 |
| 23 | 3 | 5 | 4 | 2 |
| 24 | 2 | 2 | 4 | 2 |
| 25 | 2 | 1 | 3 | 1 |
| 26 | 2 | 0 | 1 | 1 |
| 27 | 1 | 1 | 0 | |
| 28 | 1 | 1 | ||
| 29 | 1 | 1 | ||
| 30 | 0 | 0 | ||
Table S7.
P-values of generalized linear model of each destination group and preference percentage.
| Source | All | NcM6 | NcM8 | NcM9 | NcM12 | NcM18 | NcM20 | NcM25 |
|---|---|---|---|---|---|---|---|---|
| P (percentage~ destination) | 0.342 | 0.879 | 0.67 | 0.0205 | 5.84e−05 | 0.571 | 0.2198 | 0.1003 |
Table S8.
P-values of the Dunnett’s test for media preference of C. elegans.
| Source | NcM6 | NcM8 | NcM9 | NcM12 | NcM18 | NcM20 | NcM25 | ||||||||||||||
|---|---|---|---|---|---|---|---|---|---|---|---|---|---|---|---|---|---|---|---|---|---|
| Comparison Destination | mean ± SE | NcM6a | NGMb | mean ± SE | NcM8a | NGMb | mean ± SE | NcM9a | NGMb | mean ± SE | NcM12a | NGMb | mean ± SE | NcM18a | NGMb | mean ± SE | NcM20a | NGMb | mean ± SE | NcM25a | NGMb |
| NcM6 | 5.8 ± 0.7 | Ref | <0.001 | 10.8 ± 0.7 | 1.0 | 0.6302 | 15.8 ± 1.4 | 0.02654 | 1.0 | 15.8 ± 1.8 | 0.84529 | 0.41764 | 14.1 ± 4.2 | 0.723 | 0.93 | 12.5 ± 3.0 | 0.9786 | <1e−05 | 6.7 ± 1.7 | 1.0 | 0.3859 |
| NcM8 | 10.8 ± 3.4 | 0.956 | 0.00641 | 11.7 ± 5.3 | Ref | 0.7559 | 10.0 ± 2.6 | 0.29024 | 0.9642 | 5.8 ± 1.4 | 0.03458 | 1.0 | 9.9 ± 2.1 | 1.0 | 1.0 | 9.2 ± 1.8 | 1.0 | <1e−05 | 22.5 ± 5.6 | 0.0711 | 0.9923 |
| NcM9 | 0.8 ± 0.7 | 0.0956 | <0.001 | 3.3 ± 1.2 | 0.39 | 0.324 | 0.0 ± 0.0 | Ref | 0.0571 | 6.7 ± 3.3 | 0.05005 | 1.0 | 13.3 ± 5.0 | 0.845 | 0.98 | 2.5 ± 1.4 | 0.174 | <1e−05 | 6.7 ± 2.4 | 1.0 | 0.3861 |
| NcM12 | 9.2 ± 3.0 | 0.997 | 0.00139 | 17.5 ± 3.2 | 0.756 | 1.0 | 22.5 ± 4.5 | <0.001 | 0.4818 | 21.7 ± 3.6 | Ref | 0.05008 | 10.7 ± 1.7 | 0.997 | 1.0 | 11.7 ± 1.9 | 0.9986 | <1e−05 | 15.0 ± 4.8 | 0.5534 | 0.9984 |
| NcM18 | 9.2 ± 4.5 | 0.997 | 0.00304 | 8.3 ± 3.4 | 0.984 | 0.2928 | 20.8 ± 4.8 | 0.00216 | 0.7125 | 29.2 ± 7.9 | 0.63337 | 0.00142 | 8.2 ± 1.8 | Ref | 1.0 | 4.2 ± 0.7 | 0.4101 | <1e−05 | 1.7 ± 0.8 | 0.9984 | 0.0938 |
| NcM20 | 7.5 ± 3.0 | 1.0 | 0.00300 | 8.3 ± 3.8 | 0.984 | 0.2929 | 8.3 ± 0.8 | 0.48166 | 0.821 | 2.5 ± 1.4 | 0.00731 | 0.97096 | 14.1 ± 2.7 | 0.731 | 0.935 | 10.0 ± 3.1 | Ref | <1e−05 | 13.3 ± 4.6 | 0.7350 | 0.9756 |
| NcM25 | 1.7 ± 0.8 | 0.985 | <0.001 | 4.2 ± 1.4 | 0.505 | 0.0491 | 2.5 ± 1.4 | 0.99881 | 0.1598 | 5.0 ± 0.8 | 0.0239 | 0.99996 | 3.3 ± 1.1 | 0.855 | 0.61 | 2.5 ± 1.4 | 0.1741 | <1e−05 | 5.0 ± 2.8 | Ref | 0.2531 |
| NGM | 32.5 ± 8.0 | <0.001 | Ref | 17.5 ± 2.5 | 0.756 | Ref | 14.2 ± 6.4 | 0.05703 | Ref | 6.7 ± 2.0 | 0.0499 | Ref | 9.9 ± 1.1 | 1.0 | Ref | 33.3 ± 3.1 | <0.001 | Ref | 18.3 ± 8.0 | 0.2531 | Ref |
| Center | 5.8 ± 3.0 | 1.0 | <0.001 | 1.7 ± 1.4 | 0.214 | 0.0137 | 0.8 ± 0.7 | 1.0 | 0.0818 | 1.7 ± 0.8 | 0.00482 | 0.92278 | 6.6 ± 3.5 | 1.0 | 0.982 | 0.8 ± 0.7 | 0.0619 | <1e−05 | 0.0 ± 0.0 | 0.9756 | 0.0536 |
1 Notes: aThe preference percentage of the media where destination equaled source was used as a reference for comparing the means of each test media. bThe mean preference percentage of the NGM destination was used as a reference for comparing the means of each test media. Ref indicates reference media for comparison.
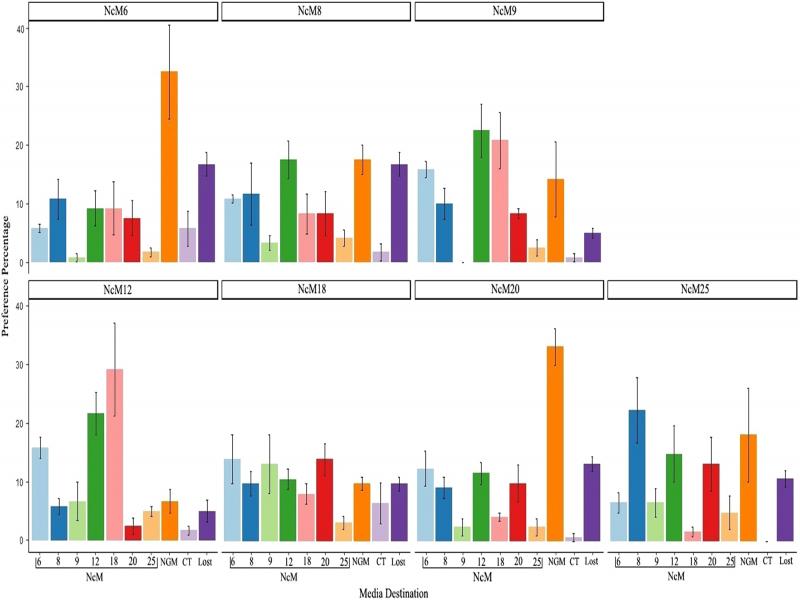
Figure 4:
Media preference assays. Plots are the percentage of the worms located on the media destinations 2 hours after placing worms in the center of the test assay plates. GLM was used to analyze the correlation between the destinations and percentages of worms migrating to the destinations for all the seven-media sources (P = 1.0) and 10 destination-groups (P = 0.342, see more in Table S7). Dunnett’s post-hoc test was used to analyze P-values for each media destination group (in this figure) or each media destination in comparison with the source and NGM (Table S8). Names of media sources are labeled at the top of each subplot. X-axis, names of media destinations; CT, center; in every assay, a small number of tested worms are not observed (“Lost”).
Table S9.
Brood size of C. elegans on Acinetobacter sp. CFBb9.
| Media | Number of tested hermaphrodites | Total brood size (Mean ± SE) | Dunnett’s post hoc P-values |
|---|---|---|---|
| NGM | 29 | 248.0 ± 9.7 | Control |
| NcM6 | 38 | 200.2 ± 2.9 | <1e−10 |
| NcM12 | 39 | 185.6 ± 7.7 | <1e−10 |
| NcM18 | 38 | 227.7 ± 7.8 | <1e−10 |
Table S10.
Lifespan of C. elegans on Acinetobacter sp. CFBb9.
| Media | Number of tested hermaphrodites | Lifespan (days) Mean ± SE | Log-rank P-value |
|---|---|---|---|
| NGM | 90 | 13.41 ± 0.26 | Control |
| NcM6 | 96 | 18.97 ± 0.35 | <2e−16 |
| NcM12 | 83 | 18.81 ± 0.63 | 9.4e−16 |
| NcM18 | 92 | 17.93 ± 0.41 | <2e−16 |
Table S11.
Number of surviving C. elegans worms on Acinetobacter sp. CFBb9 at each day of the lifespan assays.
| Number of surviving worms | ||||
|---|---|---|---|---|
| Day | NGM | NcM6 | NcM12 | NcM18 |
| 1 | 90 | 96 | 83 | 92 |
| 2 | 90 | 96 | 83 | 92 |
| 3 | 90 | 96 | 83 | 92 |
| 4 | 90 | 96 | 83 | 92 |
| 5 | 86 | 96 | 83 | 92 |
| 6 | 86 | 96 | 83 | 92 |
| 7 | 86 | 95 | 83 | 92 |
| 8 | 85 | 95 | 77 | 87 |
| 9 | 85 | 93 | 73 | 86 |
| 10 | 85 | 93 | 69 | 86 |
| 11 | 81 | 93 | 68 | 85 |
| 12 | 64 | 91 | 60 | 83 |
| 13 | 46 | 91 | 60 | 83 |
| 14 | 29 | 91 | 60 | 74 |
| 15 | 15 | 81 | 59 | 69 |
| 16 | 6 | 71 | 58 | 62 |
| 17 | 3 | 64 | 58 | 60 |
| 18 | 0 | 59 | 56 | 51 |
| 19 | 51 | 51 | 36 | |
| 20 | 41 | 50 | 25 | |
| 21 | 28 | 47 | 17 | |
| 22 | 8 | 36 | 9 | |
| 23 | 5 | 15 | 1 | |
| 24 | 0 | 1 | 0 | |
| 25 | 0 | |||
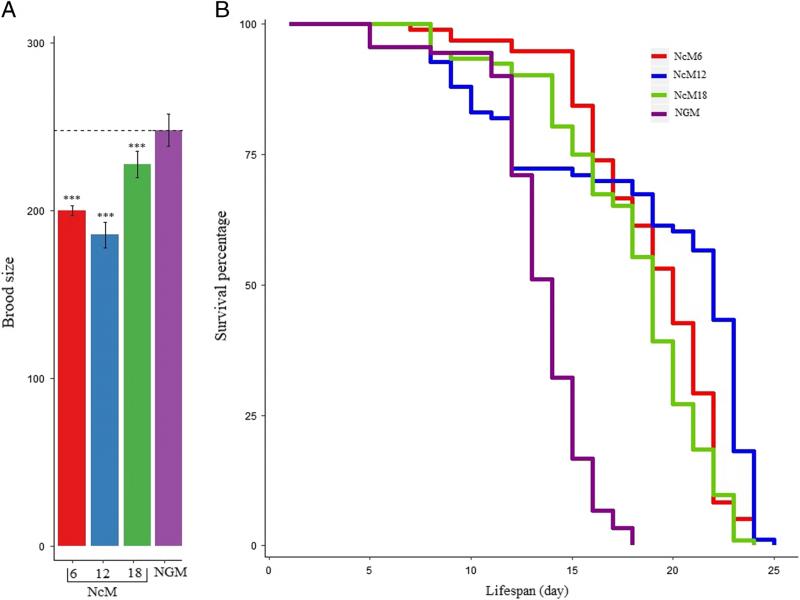
Figure 5:
Growth assays of C. elegans on a natural bacterial strain, Acinetobacter sp. CFBb9. (A) The total brood sizes of worms differed among the four different types of media (P < 2e−16, F = 175.8, one-way ANOVA test), with that of worms growing on NcM6, NcM12, or NcM18 being lower than on NGM (***P < 0.001, Dunnett’s post-hoc test), see Table S9 for exact P-values. The standard errors (SE) and error bars for each data set are the SE among P0 batches and not the SE across individual P0s. (B) Worms grown on NcM6, NcM12, and NcM18 have longer lifespans than on NGM (all P < 0.001, log-rank test), see Table S10 for exact P-values.
Table 2.
Approximate cost of reagents for making 1 L of media or approximately one hundred 6-cm plates.
| Costa (VND) | |||||
|---|---|---|---|---|---|
| Components (amount/L) | NcM6 | NcM8 | NcM12 | NcM18 | NGM |
| Cholesterol (1 mL of 5 mg/mL) | 200 | ||||
| Plant cooking oil (100 µL) | 2 | ||||
| Chicken egg (0.56 g) | 56 | 56 | |||
| Pig fat (0.4 g) | 28 | ||||
| Autoclaved mushroom (20 mL) | 115 | 115 | 115 | 115 | |
| Peptone (2.5 g) | 3000 | ||||
| Pure mineral mixture (1 mL of 1 M CaCl2, 1 mL of 1 M MgSO4, 25 mL of 1 M KPO4) | 3788 | 3788 | |||
| Soil solution (10 mL) | 0 | 0 | 0 | ||
| Agar (17 g) | 34,000 | 34,000 | 34,000 | 34,000 | 34,000 |
| NaCl (4 mL of 0.75 g/ mL) | 3,000 | 3,000 | 3,000 | 3,000 | 3,000 |
| Distilled water with reverse osmosis (1 L) | 2,000 | 2,000 | 2,000 | 2,000 | 2,000 |
| Total cost in VND | 39,117 | 42,959 | 39,171 | 39,143 | 45,988 |
| Total cost in US$b | 1.70 | 1.87 | 1.70 | 1.70 | 2.00 |