
Table 1.
Morphometrics of Oscheius myriophilus (Poinar, 1986) recovered from Gilan province, north Iran, and comparison with data of the type population, the population from Australia and the population from Turkey
| This study | Type population studied by Poinar (1986) | Sudhaus and Schulte (1989) | Erbaş et al. (2017) | ||||||
|---|---|---|---|---|---|---|---|---|---|
| Locality | Iran | California | Australia | Turkey | |||||
| Host insect | Galleria mellonella | Oxidis gracilis (Koch) | O. gracilis | Gryllotalpa gryllotalpa (L.) | |||||
| Character | Male | Hermaphrodite | Infective larvae | Male | Hermaphrodite | Infective larvae | Male | Hermaphrodite | Infective larvae |
| n | 20 | 20 | 20 | 10 | 10 | 6 | – | – | – |
| L | 1,002.1 ± 61.3 | 1,020 ± 129.6 | 672.3 ± 71.4 | 1,270 | 1,320 | 564 | – | – | 630.2 ± 31.5 |
| (867–1,053) | (862–1,247) | (583–791) | (830–1,470) | (1,200–1,500) | (504–611) | (841–1,175) | (792–1,530) | (571.3–693.9) | |
| a | 15.3 ± 2.1 | 19.6 ± 2.1 | 24.2 ± 1.8 | – | – | – | – | – | 25 ± 2.2 |
| (13.2–18.7) | (17.0–22.7) | (21.0–27.9) | (18.4–21.9) | (19.1–21.3) | – | – | – | (20.5–28.5) | |
| b | 5.1 ± 0.2 | 5.8 ± 0.5 | 4.9 ± 0.3 | – | – | – | 4.7 ± 0.2 | ||
| (4.8–5.5) | (5.0–6.9) | (4.6–5.7) | (5.16–7.36) | (6.8–7.7) | – | (4.0–6.1) | (4.2–8.5) | (4.3–5.2) | |
| c | 18.1 ± 0.9 | 9.4 ± 0.9 | 7.1 ± 0.4 | – | – | – | 9.3 ± 0.9 | ||
| (16.6–19.2) | (8.0–10.9) | (6.6–7.9) | (14.8–20.4) | (2.2–3.5) | – | (14.4–21.8) | (8.9–13.0) | (8.3–11.6) | |
| c' | 1.7 ± 0.07 | 5.0 ± 0.5 | 5.5 ± 0.3 | – | – | – | – | – | – |
| (1.5–1.8) | (4.1–5.7) | (5.1–6.6) | – | – | – | – | (3–4) | – | |
| V%= (distance from anterior end to vulva/L)×100 | – | 49.9 ± 2.0 | – | – | – | – | – | – | – |
| – | (45.5–53.1) | – | – | – | – | – | – | – | |
| Stoma length | 17.5 ± 0.5 | 17.6 ± 0.8 | 16.1 ± 1.4 | 17 | 20 | – | – | – | – |
| (17–18) | (17–20) | (14–20) | (16–19) | (18–21) | – | – | (18–21) | – | |
| Stoma width | 3.4 ± 0.5 | 4.2 ± 0.2 | 2.7 ± 0.3 | 3.2 | 3.2 | – | – | – | – |
| (3–4) | (4–4.5) | (2.5–4) | – | – | – | – | <4.5 | – | |
| Pharynx length | 196 ± 9.7 | 176.3 ± 17.1 | 134.5 ± 7.1 | 187 | 185 | 129 | – | – | 134.6 ± 3.2 |
| (180–208) | (144–200) | (125–145) | (161–200) | (174–193) | (120–136) | – | – | (128.8–139.8) | |
| Max. body diam. | 66.8 ± 11.5 | 52.3 ± 6.8 | 27.8 ± 3.4 | 63 | 62 | 23 | – | – | 25.4 ± 2.7 |
| (47–79) | (42–66) | (24–33) | (38–80) | (57–70) | (19–26) | (52–72) | (52–108) | (21.0–30.4) | |
| E pore from anterior end | 165.9 ± 11.1 | 149.3 ± 9.3 | 116.3 ± 4.6 | 198 | 179 | 107 | – | – | 108 ± 6.7 |
| (142–177) | (135–167) | (110–129) | (149–229) | (165–190) | (97–114) | – | – | (97.8–118.8) | |
| Nerve ring from anterior end | 126 ± 4.7 | 121.1 ± 9.7 | 94.5 ± 6.7 | 150 | 139 | 89 | – | – | 110.5 ± 4.9 |
| (118–130) | (105–135) | (83–105) | (117–165) | (126–146) | (83–96) | – | – | (100–116.8) | |
| Rectum length | – | 63.7 ± 4.8 | – | – | 79 | – | – | – | – |
| – | (55–80) | – | – | (56–96) | – | – | – | – | |
| Anal body diam. | 32.3 ± 1.8 | 21.7 ± 2.4 | 16.9 ± 0.9 | 39 | 25 | 15 | – | 32 | 12.3 ± 1 |
| (30–35) | (17–26) | (15–18) | (32–45) | (22–28) | (14–16) | – | – | (10.4–13.8) | |
| Tail | 55.3 ± 3.3 | 108.1 ± 9.8 | 93.7 ± 5.0 | 65 | 117 | 78 | – | – | 82.1 ± 6.2 |
| (52–60) | (90–126) | (85–100) | (56–72) | (108–135) | (75–80) | – | – | (72.2–92.2) | |
| Ratio of tail length to rectum | – | 1.7 ± 0.1 | – | – | – | – | – | 1.5 | – |
| – | (1.1–1.8) | – | – | – | – | – | (1.4–2.3) | – | |
| Spicules length | 44.5 ± 3.8 | – | – | 47 | – | – | – | – | – |
| (38–49) | – | – | (32–54) | – | – | (27–39) | – | – | |
| Spicules width | 7.1 ± 0.3 | – | – | 10 | – | – | – | – | – |
| (7–8) | – | – | (8–11) | – | – | – | – | – | |
| Gubernaculum length | 20.0 ± 1.0 | – | – | 28 | – | – | – | – | – |
| (18–21) | – | – | (19–32) | – | – | – | – | – | |
| Gubernaculum width | 0.9 ± 0.09 | – | – | 0.87 | – | – | – | – | – |
| (0.8–1.1) | – | – | (0.64–1.20) | – | – | – | – | – | |
| D%= (E pore from anterior end/Pharynx length) ×100 | 84.6 ± 3.7 | 85.1 ± 6.8 | 87.1 ± 3.5 | – | – | – | – | – | – |
| (78.8–90.5) | (76.3–100.0) | (82.5–94.4) | – | – | – | – | – | – | |
| E%= (E pore from anterior end/Tail) ×100 | 300.2 ± 16.8 | 138.7 ± 10.2 | 125.5 ± 5.0 | – | – | – | – | – | – |
| (273–323) | (124.3–160.0) | (118.0–136.3) | – | – | – | – | – | – | |
| SW%= (Spicules length/Anal body diam.) ×100 | 137.8 ± 8.2 | – | – | – | – | – | – | – | – |
| (126.6–150.0) | – | – | – | – | – | – | – | – | |
| GS%=(Gubernaculum length/Spicules length)×100 | 45.1 ± 2.5 | – | – | – | – | – | – | – | – |
| (41.6–48.8) | – | – | – | – | – | – | – | – | |
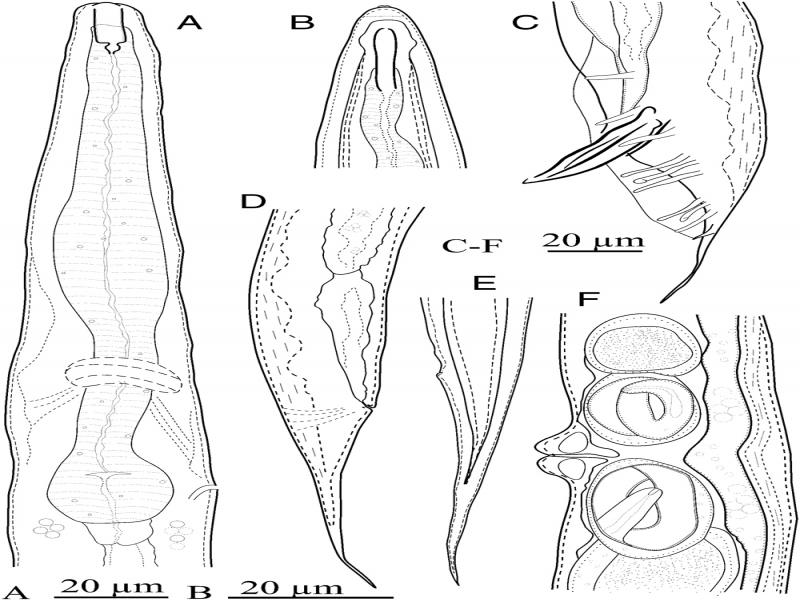
Figure 1:
Iranian population of Oscheius myriophilus (Poinar, 1986). (A) Pharyngeal region of hermaphrodite; (B: Anterior body region of infective juvenile; (C) Male tail, genital papillae, spicules, and gubernaculum; (D) Posterior body region of hermaphrodite; (E) Infective juvenile tail; (F) Vulval region.
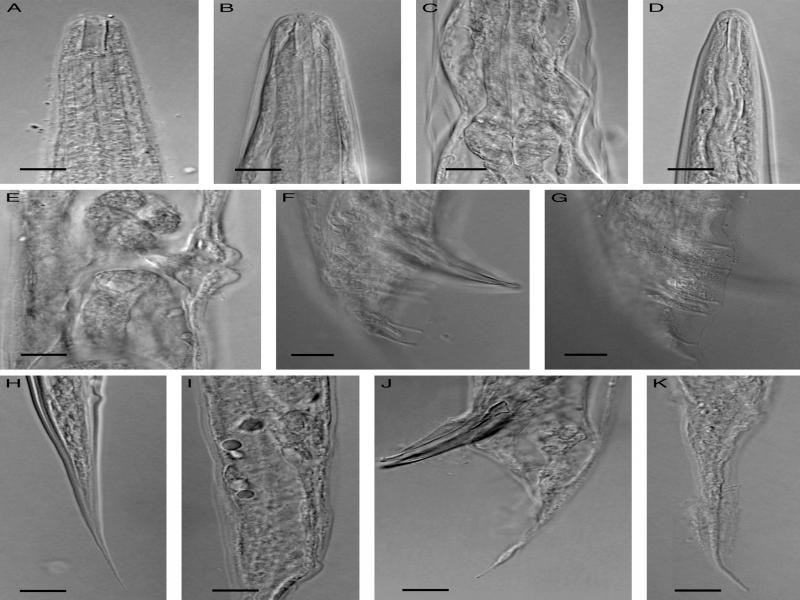
Figure 2:
Iranian population of Oscheius myriophilus (Poinar, 1986). (A) Anterior body region of hermaphrodite; (B) Anterior body region of male; (C) Part of pharynx (male), (D) Anterior body region of infective juvenile; (E) Vulval region; (F, G) Male tail and genital papillae; (H) Infective juvenile tail; (I) Female rectum; (J) Spicule and tail tip; (K) Hermaphrodite tail (scale bars = 10 µm).
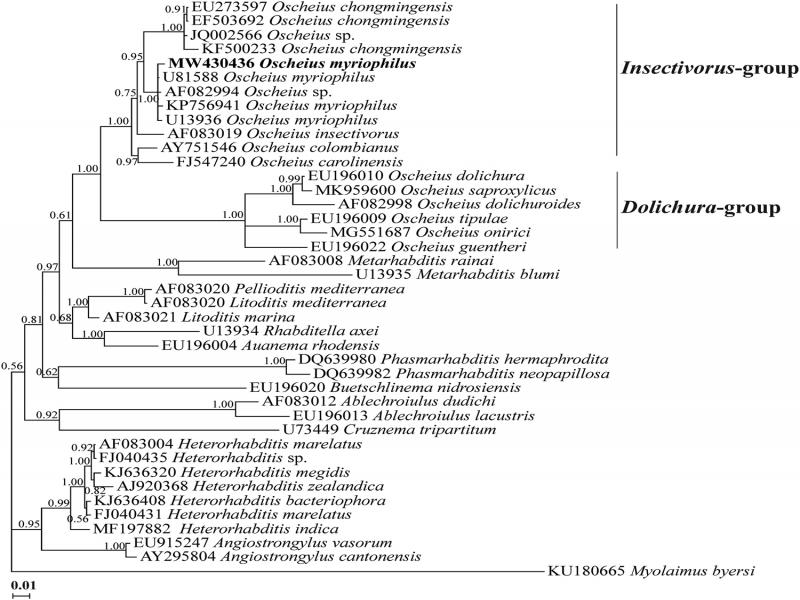
Figure 3:
Bayesian 50% majority rule consensus tree inferred using partial SSU rDNA sequence of Iranian population of Oscheius myriophilus (Poinar, 1986) under the GTR + G + I model. Bayesian posterior probability values more than 0.50 are given for appropriate clades. The Iranian population is indicated in bold.
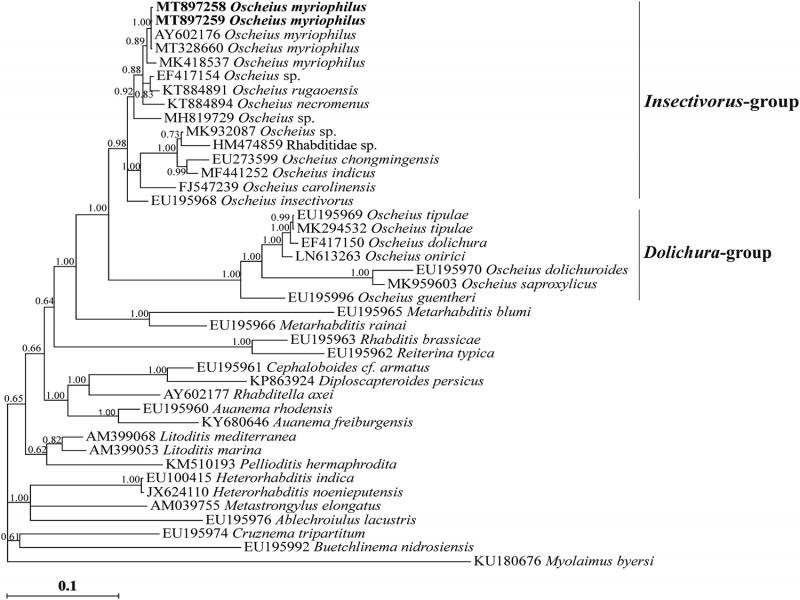
Figure 4:
Bayesian 50% majority rule consensus tree inferred using the partial LSU rDNA sequences of Iranian population of Oscheius myriophilus (Poinar, 1986) under the GTR + G + I model. Bayesian posterior probability values more than 0.50 are given for appropriate clades. The sequences of Iranian population are indicated in bold.
Table 2.
Comparative LC50 and LC90 values of Oscheius myriophilus (Poinar, 1986) for Cydalima perspectalis (Walker, 1859) and Hyphantria cunea (Drury, 1773) at 48 h post-treatment by EPNs
| Host | Organism | χ 2 (df=6) | P-value | Intercept ± SE | Slope ± SE | LC50 | LC90 |
|---|---|---|---|---|---|---|---|
| C. perspectalis (fourth larval instars) | O. myriophilus | 66.70 | 0.000 | −0.79 ± 0.06 | 0.005 ± 0.000 | 152.70 (68.1–267.1) | 400.30 (280.2–802.7) |
| C. perspectalis (fifth larval instars) | O. myriophilus | 72.18 | 0.000 | −0.68 ± 0.06 | 0.005 ± 0.00 | 74.53 (20.70–133.71) | 217.02 (150.92–438.99) |
| H. cunea (fourth larval instars) | O. myriophilus | 65.24 | 0.000 | −0.92 ± 0.06 | 0.005 ± 0.000 | 197.30 (110.0–339.1) | 470.90 (332.3–934.9) |
| H. cunea (fifth larval instars) | O. myriophilus | 78.00 | 0.000 | −0.52 ± 0.06 | 0.005 ± 0.000 | 99.94 (−20.4–211.27) | 346.47 (227.4–906.9) |
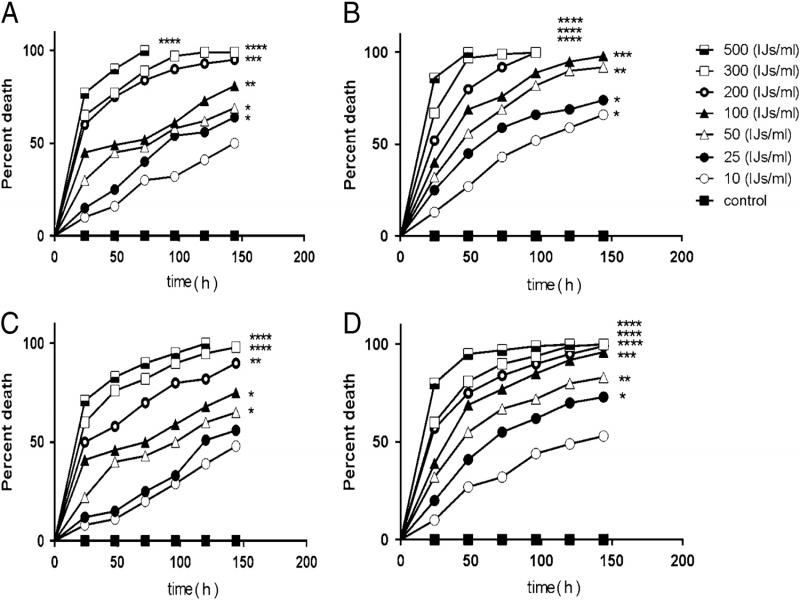
Figure 5:
Death of Cydalima perspectalis (Walker, 1859) and Hyphantria cunea (Drury, 1773) larvae after exposure to different doses of Oscheius myriophilus (Poinar, 1986) in 24–144 h post treatment in laboratory bioassays. (A) fourth instar larvae of Cydalima perspectalis exposed to Oscheius myriophilus (B) fifth instar larvae of Cydalima perspectalis exposed to nematode (C) fourth instar larvae of H. cunea exposed to nematode (D) fifth instar larvae of Hyphantria cunea exposed to nematode, Log-rank test (Mantel–Cox) on GraphPad Prism software was performed to determine statistical significance for the death curves. *p< 0.05, **p<0.01, ***p<0.001, ****p<0.0001, compared with control.