
Figure 1:
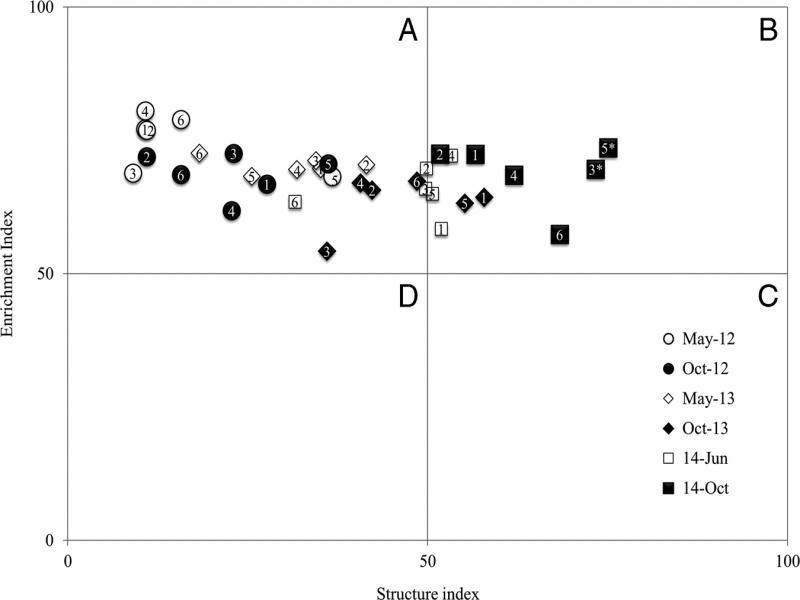
Figure 2:
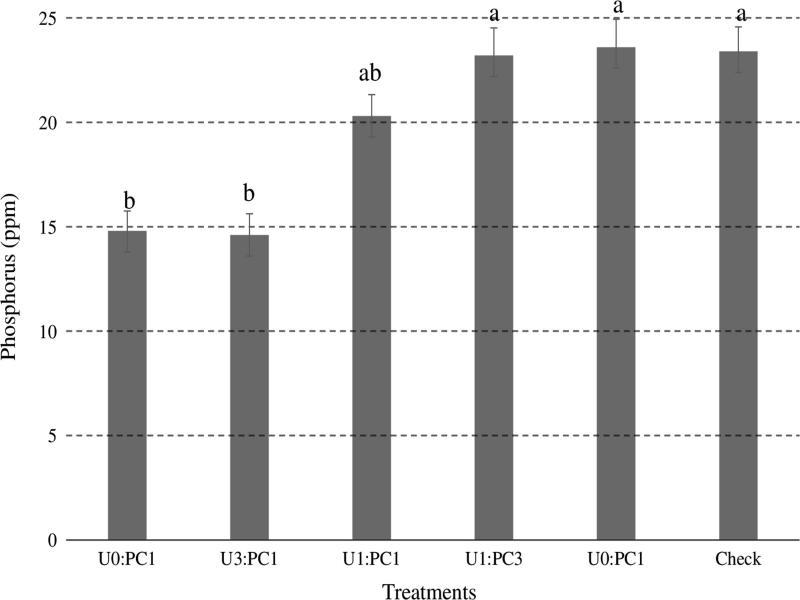
Figure 3:
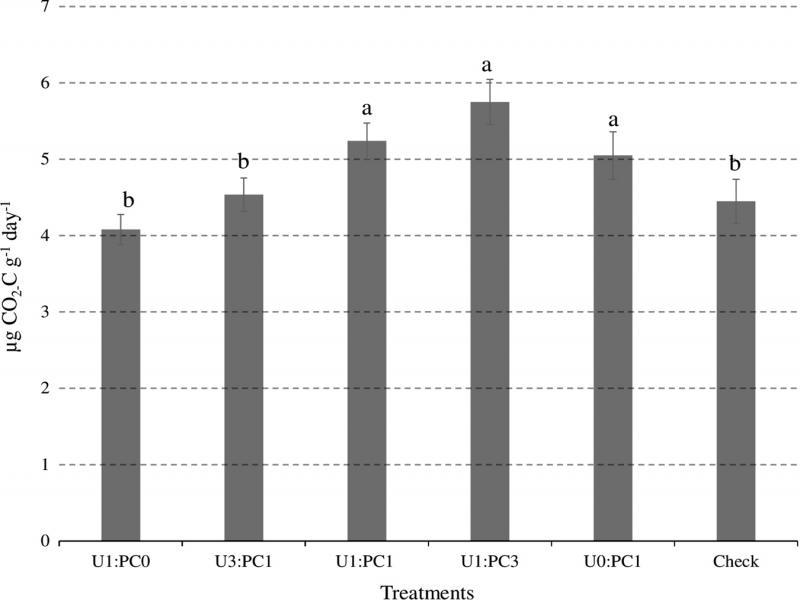
Figure 4:
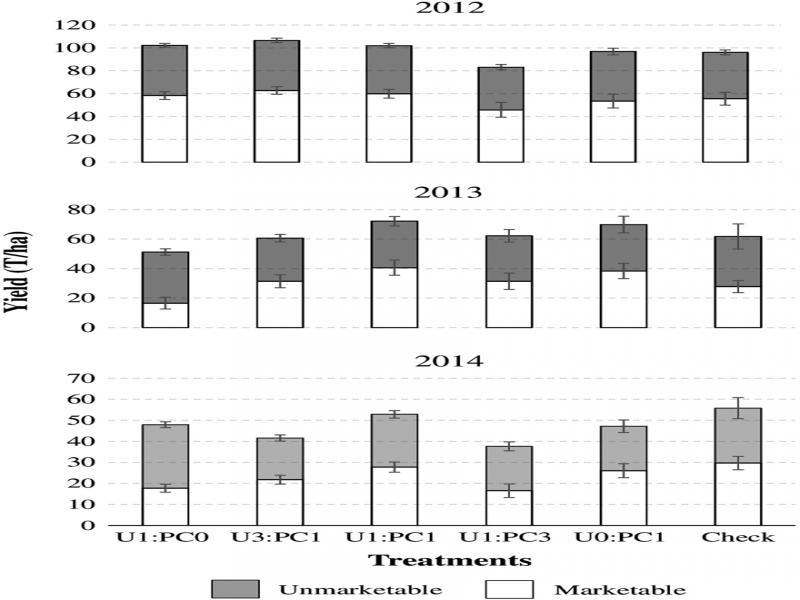
Figure 5:
Figure 6:
Soil pH, nitrate-nitrogen (NO3-N) and calcium (Ca) contents (ppm) in plots amended with integrated application of urea and PC to supply 135 kg N/ha recommended for processing carrot cultivars, standard urea application and non-amended check in sandy loam soil at planting (0) and at 133 days after planting (DAP) in 2012 to 2013 growing seasons_
| Treatments as a ratio of urea (U) and PC | ||||||||
|---|---|---|---|---|---|---|---|---|
| Variables | YR | DAP | U1: PC0a | U3:PC1 | U1:PC1 | U1:PC3 | U0:PC1 | Check |
| pH | 2012 | 0 | 6.8 ± 0.1 bBb | 6.8 ± 0.2 bB | 7.2 ± 0.3 bA | 7.0 ± 0.2 bAB | 7.2 ± 0.1 bA | 7.2 ± 0.4 cA |
| 133 | 6.4 ± 0.3 cB | 6.8 ± 0.3 bAB | 7.4 ± 0.1 abA | 7.2 ± 0.4 bA | 7.3 ± 0.5 bA | 7.3 ± 0.6 abcA | ||
| 2013 | 0 | 6.9 ± 0.1 bA | 7.0 ± 0.2 abA | 7.4 ± 0.1 abA | 7.2 ± 0.3 bA | 7.3 ± 0.5 bA | 7.4 ± 0.6 bA | |
| 133 | 6.7 ± 0.2 bB | 7.1 ± 0.1 aAB | 7.5 ± 0.1 aA | 7.4 ± 0.2 aA | 7.6 ± 0.3 aA | 7.5 ± 0.5 abA | ||
| NO3-N | 2012 | 0 | 1.4 ± 0.3 dAB | 0.6 ± 0.2 cB | 0.8 ± 0.9 cAB | 0.5 ± 0.1 cB | 0.7 ± 0.5 cB | 1.5 ± 0.6 cA |
| 133 | 29.2 ± 17 aA | 2.9 ± 0.9 bB | 3.0 ± 1 bB | 3.7 ± 1 abB | 4.6 ± 2 bB | 3.0 ± 2 bB | ||
| 2013 | 0 | 5.3 ± 0.6 cA | 5.4 ± 1.3 aA | 6.0 ± 0.9 aA | 5.4 ± 0.2 aA | 6.5 ± 1.2 aA | 7.2 ± 3 aA | |
| 133 | 17.5 ± 8 bA | 2.6 ± 1.2 bB | 3.4 ± 2.3 bB | 4.6 ± 2.5 aB | 3.8 ± 1.4 bB | 2.7 ± 0.5 bB | ||
| Ca | 2012 | 0 | 1159.7 ± 171 bA | 1120.7 ± 123 bA | 1263.3 ± 129 abA | 1139.3 ± 82 bA | 1192.7 ± 115 bA | 1295.7 ± 298 bA |
| 133 | 1057.3 ± 103 bA | 1126.7 ± 110 bA | 1287.7 ± 122 abA | 1193.7 ± 33 bA | 1307.3 ± 351 abA | 1303.7 ± 433 bA | ||
| 2013 | 0 | 1111.3 ± 91 bA | 1108.7 ± 120 bA | 1246.7 ± 73 bA | 1152.3 ± 129 bA | 1345.3 ± 424 abA | 1406.3 ± 495 aA | |
| 133 | 1243.3 ± 95 aA | 1242.3 ± 121 aA | 1471.3 ± 57 aA | 1388.3 ± 116 aA | 1423.0 ± 186 aA | 1450.3 ± 365 aA | ||
List of nematode genera detected in plots amended with integrated application of urea and PC at different levels to supply 135 kg N/ha recommended for processing carrot cultivars, standard urea, and non-amended check plots in sandy loam soil in 2012, 2013, and 2014 growing seasons_
| Herbivores | Bacterivores | Fungivores | Omnivores | Predators |
|---|---|---|---|---|
| Basiria (2) | Eumonhystera (1) | Aphelenchoides (2) | Eudorylaimus (4) | Tripyla (3) |
| Boleodorus (2) | Mesorhabditis (1) | Aphelenchus (2) | Mesodorylaimus (4) | Clarkus (4) |
| Cephalenchus (2) | Panagrellus (1) | Ditylenchus (2) | Microdorylaimus (4) | Mylonchulus (4) |
| Malenchus (2) | Panagrolaimus (1) | Filenchus (2) | Pungentus (4) | Prionchulus (4) |
| Paratylenchus (2) | Pellioditis (1) | Diphtherophora (3) | Thonus (4) | Nygolaimus (5) |
| Psilenchus (2) | Pristionchus (1) | Tylencholaimellus (4) | Aporcelaimellus (5) | |
| Tylenchus (2) | Rhabditis (1) | Prodorylaimus (5) | ||
| Dolichorynchus (3) | Acrobeloides (2) | |||
| Helicotylenchus (3) | Cephalobus (2) | |||
| Hemicycliophora (3) | Cervidellus (2) | |||
| Heterodera (J2) a (3) | Eucephalobus (2) | |||
| Pratylenchus (3) | Heterocephalobus (2) | |||
| Rotylenchus (3) | Plectus (2) | |||
| Tylenchorhynchus (3) | Microlaimus (3) | |||
| Trichodorus (4) | Prismatolaimus (3) | |||
| Longidorus (5) | Alaimus (4) | |||
| Xiphinema (5) |
Probability values (Pr > F) of treatment (TR), sampling time (T), and interaction of treatment and sampling time (TR × T) effects for nematode trophic group abundances, non-herbivore and total nematodes, nematode community and soil food web indices, soil respiration and soil physiochemical properties for field plots amended with integrated application of urea and PC at different levels to supply 135 kg N/ha and standard urea application and non-amended check in sandy loam soil in 2012 to 2014_
| Probability > F | |||
|---|---|---|---|
| Variables | TR | T | TR × T |
| Trophic groups | |||
| Herbivores | 0.95 | < 0.0001 | 0.60 |
| Bacterivores | 0.95 | < 0.0001 | 0.67 |
| Fungivores | 0.93 | < 0.0001 | 0.77 |
| Omnivores | 0.86 | < 0.0001 | 0.35 |
| Predators | 0.48 | < 0.0001 | 0.82 |
| Non-herbivores | 0.98 | < 0.0001 | 0.62 |
| Total nematodes | 0.97 | < 0.0001 | 0.89 |
| Diversity indices | |||
| H′a | 0.99 | < 0.0001 | 0.2 |
| Hill’s N1 | 0.97 | < 0.0001 | 0.29 |
| Hill’s N0 | 0.99 | < 0.0001 | 0.44 |
| Ecological disturbance indices | |||
| PPI | 0.91 | < 0.0001 | 0.43 |
| MI | 0.67 | < 0.0001 | 0.48 |
| MI25 | 0.13 | < 0.0001 | 0.64 |
| Food web indices | |||
| EI | 0.630 | 0.0012 | 0.49 |
| SI | 0.041 | < 0.0001 | 0.48 |
| BI | 0.623 | < 0.0001 | 0.61 |
| CI | 0.940 | < 0.0001 | 0.48 |
| Soil respiration | 0.020 | < 0.0001 | 0.53 |
| Soil physiochemical properties | |||
| Bulk density | 0.45 | < 0.0001 | 0.98 |
| Porosity | 0.26 | < 0.0001 | 0.98 |
| Moisture | 0.28 | < 0.0001 | 0.73 |
| Soil pH | 0.18 | < 0.0001 | 0.01 |
| Phosphorus | 0.02 | 0.005 | 0.74 |
| Potassium | 0.69 | < 0.0001 | 0.42 |
| Calcium | 0.48 | < 0.0001 | 0.03 |
| Magnesium | 0.74 | < 0.0001 | 0.55 |
| Organic matter | 0.23 | < 0.0001 | 0.54 |
| Nitrate-nitrogen | 0.02 | < 0.0001 | <0.0001 |
| Ammonium-nitrogen | 0.43 | < 0.0001 | 0.99 |
| Cation exchange capacity | 0.62 | < 0.0001 | 0.55 |