
Table 1.
List species examined in this study and their corresponding sampling locations.
| Species | GPS coordinates | Al. | Vegetation environment |
|---|---|---|---|
| Labrys fujianensis | 26°04´52.9˝N,119°14´26.7˝E | 28 | Scrubland soil with ferns and bamboo |
| Labrys fuzhouensis | 26°08´57.6˝N,119°17´34.4˝E | 107 | Rhizosphere of Alpinia zerumbet |
| Coslenchus rafiqi | 26°05´08.2˝N,119°14´10.0˝E | 27 | Swamp soil |
| Coslenchus costatus | 26°05´00.9˝N, 119°14´32.6˝E | 25 | Rhizosphere soil of bamboo |
| Boleodorus thylactus | 26°08´57.6˝N,119°17´34.4˝E | 107 | Rhizosphere soil of Alpinia zerumbet |
| Aglenchus geraerti | 26°09´09.2˝N,119°17´35.7˝E | 88 | Rhizosphere soil of grass near the bamboo |
| Basiria aberrans | 26°09´56.3˝N,117°55´34.2˝E | 644 | Rhizosphere soil of peanut |
| Filenchus vulgaris | 26°05´00.9˝N,119°14´32.6˝E | 25. | Rhizosphere soil of bamboo |
| Lelenchus leptosoma 1 | 26°05´00.9˝N,119°14´32.6˝E | 25. | Rhizosphere soil of bamboo |
| Lelenchus leptosoma 2 | 26°08´57.3˝N,119°17´34.1˝E | 107 | Rhizosphere soil of Litchi chinensis |
| Malenchus bryanti | 43°48´53.1˝N,125°24´40.3˝E | 225 | Rhizosphere soil of aspen |
| Tylenchus arcuatus | 26°05´23.9˝N,119°14´00.3˝E | 12 | Rhizosphere soil of locust tree |
| Psilenchus hilarulus | 26°05´09.4˝N,119°13´50.2˝E | 7 | Rhizosphere soil of grass |
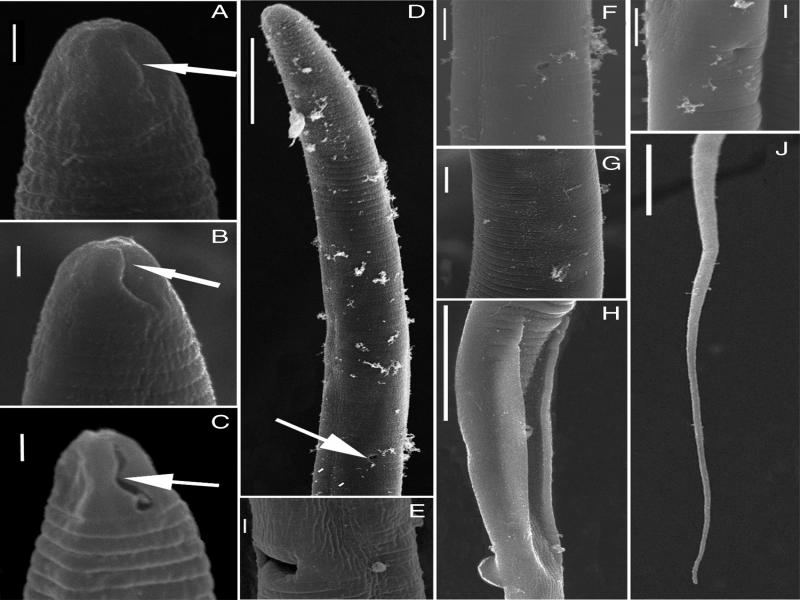
Figure 1:
SEM pictures of Lelenchus leptosome population 1, 2 (de Man, 1880; Andrássy, 1954). (A, B) Lelenchus leptosome population 1; (C-J) Lelenchus leptosome population 2. (A, B, C) lip region; (D) anterior body (excretory pore indicated by arrow); (E) lateral view of the vulva; (F) excretory pore; (G) annulation at mid-body; (H) lateral view of cloacal aperture; (I) anus; (J) tail. (Scale bars: A, B, C, E, G=1 μm; D, H, J=10 μm ; F, I=2 μm).
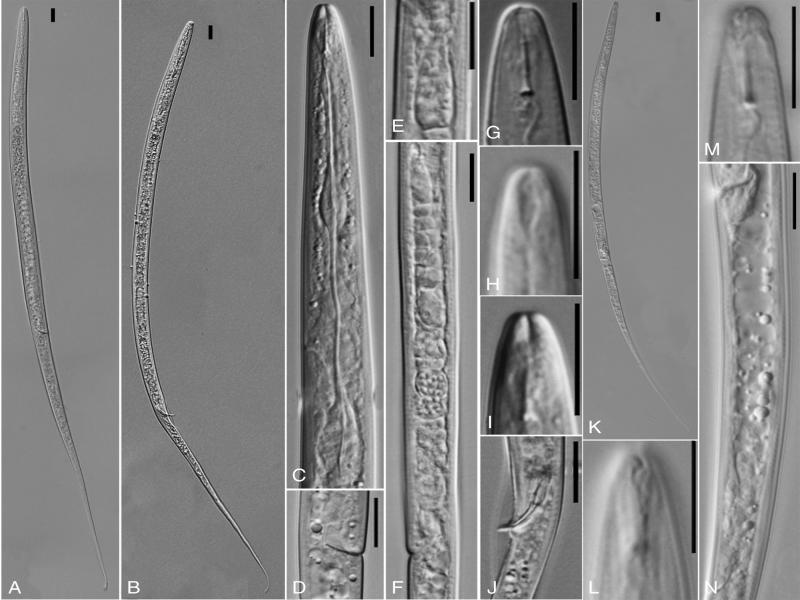
Figure 2:
LM pictures of Lelenchus leptosome populations 1 and 2. (K-N) Lelenchus leptosome population 1; (A-J) Lelenchus leptosome population 2. (A, B, K) body habitus; (C) anterior body; (D) ventral view of the vulva; (E) pharyngeal bulb; (F) lateral view of female reproductive system; (G-I, L, M) different image planes of cephalic region; (J) spicule and gubernaculum; (N) vulval to the anus. (Scale bar: 10 μm).
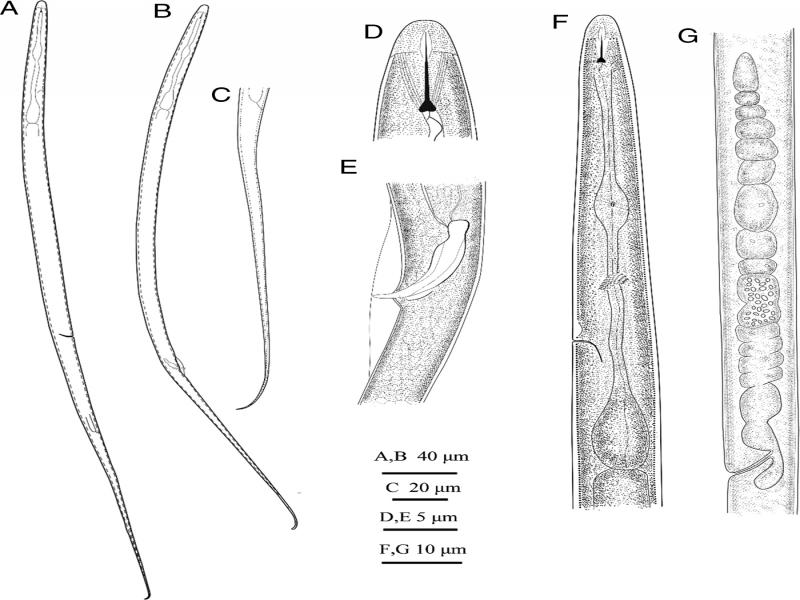
Figure 3:
Line drawing of Lelenchus leptosoma population 2. (A, C, D, F) female; (B, E) male; (A, B) body habitus; (C) tail; (D) cephalic region; (E) spicule and gubernaculum; (F) anterior body; (G) reproductive system.
Table 2.
The compositional bias (GC content) and 1st, 2nd, and 3rd codon position nucleotide alignments.
| Taxa | |||
|---|---|---|---|
| Nucleotide composition | Tylenchidae | Criconematina | Hoplolaimina |
| GC | 28.72 | 22.54 | 29.42 |
| GC 1st | 39.80 | 28.07 | 38.82 |
| GC 2nd | 35.14 | 35.07 | 36.61 |
| GC 3rd | 11.23 | 4.48 | 12.84 |
Table 3.
The p-distance of COI gene between studied Tylenchidae species.
| LFJ | LFZ | CR | AG | BA | BT | PH | CC | FV | LL1 | LL2 | MB | TA | LB | |
|---|---|---|---|---|---|---|---|---|---|---|---|---|---|---|
| LFJ | 99.5 | |||||||||||||
| LFZ | 78.9 | 99.5 | ||||||||||||
| CR | 83.0 | 81.4 | 100 | |||||||||||
| AG | 83.2 | 81.3 | 99.8 | 99.5 | ||||||||||
| BA | 79.8 | 76.2 | 81.5 | 81.3 | 99.5 | |||||||||
| BT | 78.7 | 76.6 | 82.4 | 82.3 | 79.4 | 99.8 | ||||||||
| PH | 72.5 | 73.5 | 77. 8 | 77.7 | 73.2 | 77.2 | 100 | |||||||
| CC | 80.5 | 78.2 | 87.5 | 87.3 | 79.8 | 80.8 | 75.7 | 98.6 | ||||||
| FV | 82.4 | 79.5 | 83.3 | 83.2 | 80.9 | 82.5 | 76.3 | 82.4 | 100 | |||||
| LL1 | 76.8 | 76.8 | 81.0 | 81.1 | 71.7 | 73.9 | 70.8 | 77.6 | 75.1 | 96.0 | ||||
| LL2 | 79.2 | 81.2 | 84.4 | 84.2 | 75.5 | 79.0 | 75.1 | 82.8 | 80.1 | 86.9 | 97.7 | |||
| MB | 81.1 | 78.8 | 82.6 | 82.5 | 78.1 | 81.8 | 74.8 | 81.0 | 82.7 | 74.0 | 79.6 | 99.7 | ||
| TA | 82.4 | 79.2 | 88. 9 | 88.8 | 81.8 | 85.6 | 78.5 | 83.7 | 83.8 | 76.7 | 81.3 | 84.7 | 100 | |
| LB | 84.1 | 81.2 | 86.6 | 87.0 | 81.5 | 81.5 | 72.9 | 87.2 | 84.3 | 77.9 | 84.6 | 84.0 | 84.9 | 0 |
1 Notes: LFJ, Labrys fujianensis; LFZ, Labrys fuzhouensis; CR, Coslenchus rafiqi; AG, Aglenchus geraerti; BA, Barsiria aberrans; BT, Boleodurus thylactus; PH, Psilenchus hilarulus; CC, Coslenchus costatus; FV, Filenchus vulgaris; LL1, Lelenchus leptosoma 1; LL2, Lelenchus leptosoma; MB, Malenchus bryanti; TA, Tylenchus arcuatus; LB, Lelenchus brevislitus.
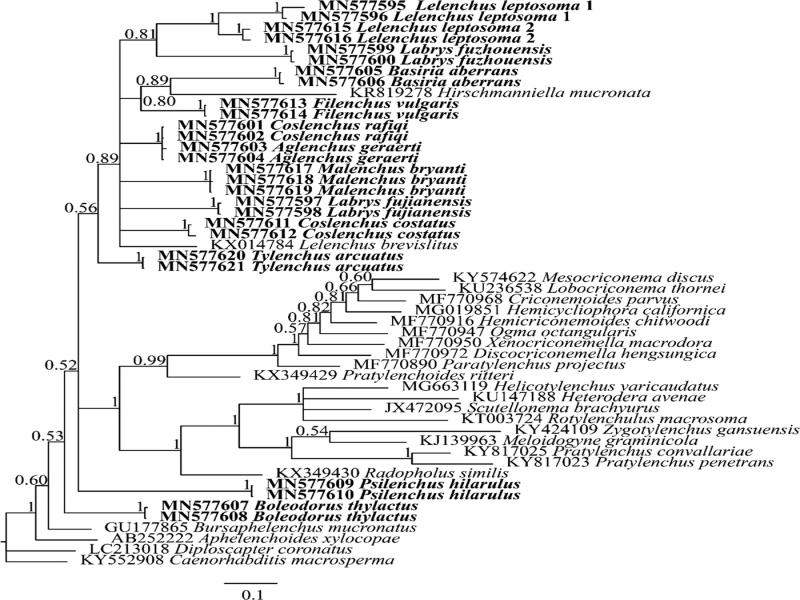
Figure 4:
Bayesian 50% majority rule consensus tree interfered with mitochondrial COI gene. New sequences original to this study are indicated in bold. Branch support is PP value in BI analysis.
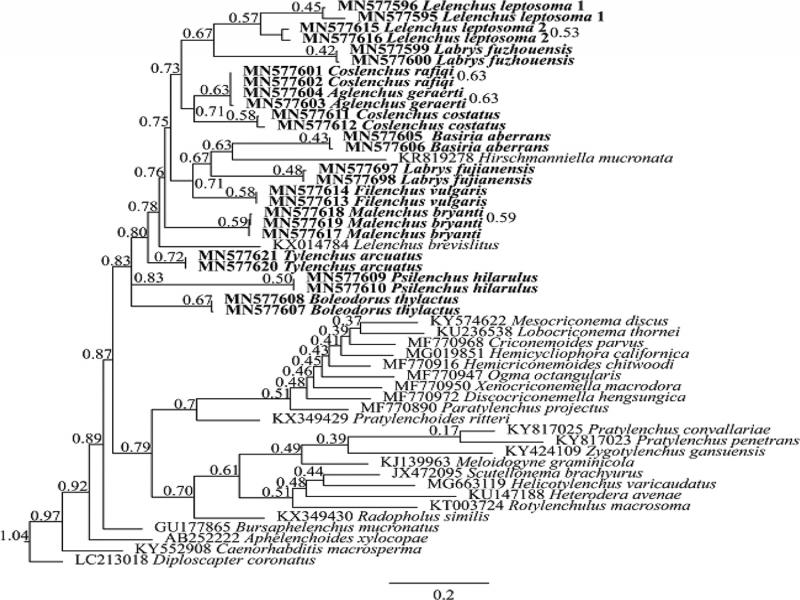
Figure 5:
The maximum likelihood tree interfered on the mitochondrial COI gene. New sequences original to this study are indicated in bold. Branch support is BS value from ML analysis.
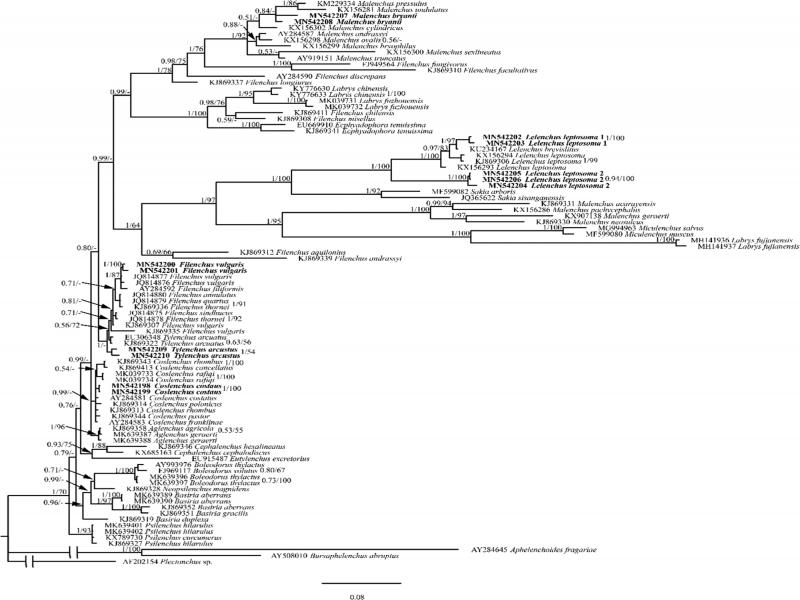
Figure 6:
Bayesian 50% majority rule consensus tree interfered with the 18S rRNA gene. New sequences original to this study are indicated in bold. Branch support is indicated in the following order: PP value in BI analysis/BS value from ML analysis.
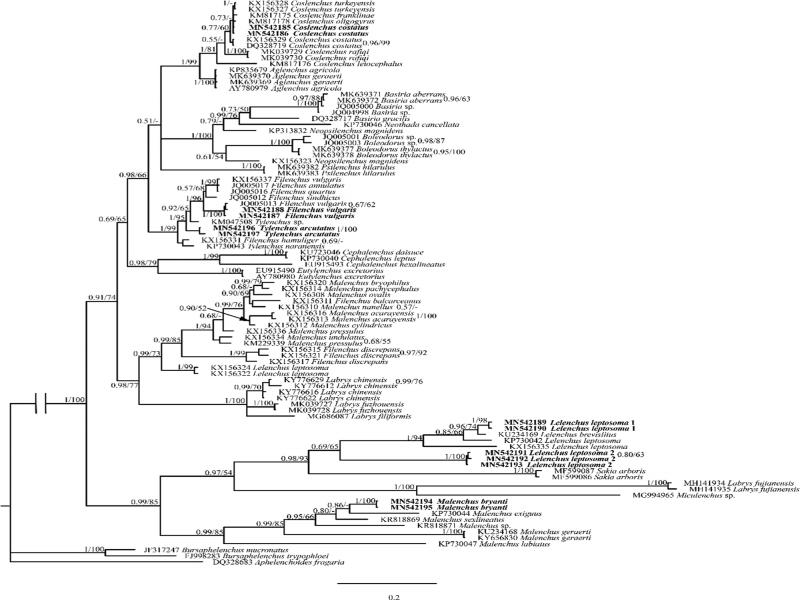
Figure 7:
Bayesian 50% majority rule consensus tree interfered with the 28S rRNA gene. New sequences original to this study are indicated in bold. Branch support is indicated in the following order: PP value in BI analysis/BS value from ML analysis.