
Table 1.
Crop phase for bahiagrass, peanut, and cotton during 2016 to 2019a.
| Phase number | Rotation | 2016 | 2017 | 2018 | 2019 |
|---|---|---|---|---|---|
| 1 | Conventional | P | C1 | C2 | P |
| 2 | Conventional | C1 | C2 | P | C1 |
| 3 | Conventional | C2 | P | C1 | C2 |
| 4 | Bahiagrass | CS | B1 | B2 | PS |
| 5 | Bahiagrass | B1 | B2 | PS | CS |
| 6 | Bahiagrass | B2 | PS | CS | B1 |
| 7 | Bahiagrass | PS | CS | B1 | B2 |
Table 2.
Cotton planting, nematode sampling, cotton harvest, and irrigation dates in 2017 and 2018.
| 2017 | 2018 | |
|---|---|---|
| Cotton planting | April 28 | April 27 |
| Soil samplinga | ||
| Preplant (Pi) | April 13 | April 19 |
| Midseason (Pm) | June 19 | June 22 |
| Harvest (Pf) | September 25 | September 25 |
| Root sampling | June 19 | June 22 |
| Cotton harvest | October 17 | October 8 |
| Irrigation eventsb | May 10 | May 12 |
| July 5 | June 26 | |
| August 2 | July 12 | |
| August 25 | July 18 | |
Table 3.
Effects of irrigation, crop phase, and nematicide application on Rotylenchulus reniformis in 2017 and 2018.
| Total Rotylenchulus reniformis population density | ||||||||
|---|---|---|---|---|---|---|---|---|
| 2017 | 2018 | |||||||
| Pia | Pm | Pf | Rf | Pi | Pm | Pf | Rf | |
| ANOVA (p-values) | ||||||||
| Irrigation (I) | 0.76 | 0.75 | 0.61 | 0.61 | 0.27 | 0.49 | 0.25 | 0.21 |
| Crop phase (C) | < 0.01** | < 0.01** | < 0.01** | 0.02* | < 0.01** | < 0.01** | < 0.01** | < 0.01** |
| I × C | 0.35 | 0.46 | 0.02* | 0.79 | 0.05* | 0.82 | 0.39 | 0.16 |
| Nematicide (N) | 0.96 | 0.47 | 0.13 | 0.78 | 0.01** | 0.22 | 0.13 | 0.78 |
| I × N | 0.89 | 0.70 | 0.22 | 0.62 | 0.10 | 0.72 | 0.53 | 0.16 |
| C × N | 0.18 | 0.75 | 0.84 | 0.50 | 0.29 | 0.90 | 0.74 | 0.41 |
| I × C × N | 0.67 | 0.80 | 0.65 | 0.90 | 0.18 | 0.84 | 0.53 | 0.34 |
| Ratio of Rotylenchulus reniformis immature females and juveniles: males | ||||||||
| 2017 | 2018 | |||||||
| Pia | Pm | Pf | Pi | Pm | Pf | |||
| ANOVA (p-values) | ||||||||
| Irrigation (I) | 0.11 | 0.34 | 0.15 | 0.11 | 0.46 | 0.19 | ||
| Crop phase (C) | 0.05* | 0.18 | 0.01** | 0.02* | 0.28 | 0.03* | ||
| I × C | 0.93 | 0.38 | 0.92 | 0.10 | 0.36 | 0.43 | ||
| Nematicide (N) | 0.95 | 0.61 | < 0.01** | 0.40 | 0.56 | 0.75 | ||
| I × N | 0.18 | 0.84 | 0.08 | 0.37 | 0.43 | 0.95 | ||
| C × N | 0.87 | 0.50 | 0.02* | 0.72 | 0.64 | 0.83 | ||
| I × C × N | 0.97 | 0.37 | 0.06 | 0.43 | 0.73 | 0.94 | ||
1 Notes: aPi, Pm, and Pf are p-values for mean nematode population densities (per 100 cm3 soil) prior to planting, at midseason (52 and 56 days after planting in 2017 and 2018), and at harvest (150 and 151 days after planting in 2017 and 2018), respectively. Rf is reproduction factor (Pf/Pi).
* and ** represent significant effects at p ≤ 0.05 and p ≤ 0.01, respectively.
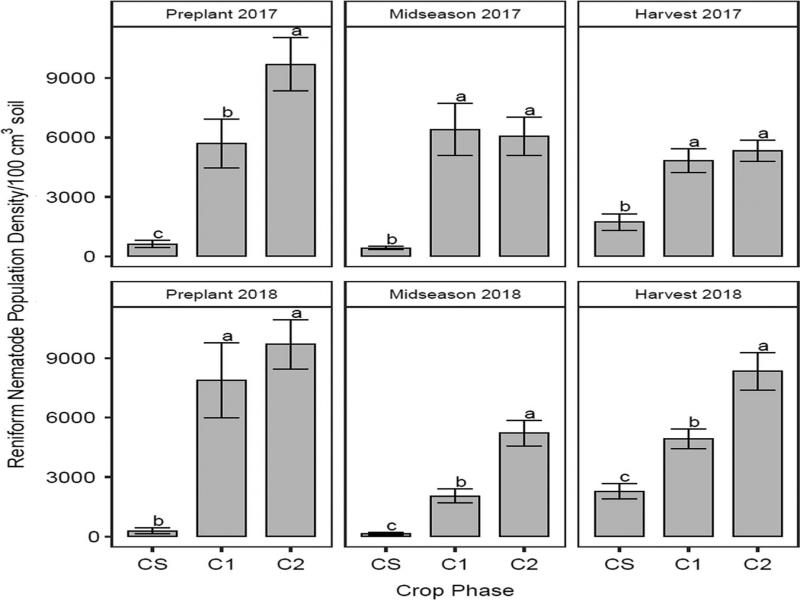
Figure 1:
Reniform nematode (Rotylenchulus reniformis) population density (nematodes/100 cm3 soil) as influenced by crop phase in 2017 and 2018 soil samples. CS is the cotton phase of the sod-based rotation, C1 is first-year conventional cotton, and C2 is second-year conventional cotton. Different letters denote significant differences between crop phases (Fisher’s protected LSD, p ≤ 0.05).
Table 4.
Effects of irrigation, crop phase, and nematicide application on Mesocriconema ornatum and Helicotylenchus dihystera in 2017 and 2018.
| Mesocriconema ornatum population density | ||||||||
| 2017 | 2018 | |||||||
| Pia | Pm | Pf | Rf | Pi | Pm | Pf | Rf | |
| ANOVA (p values) | ||||||||
| Irrigation (I) | 0.14 | 0.19 | 0.29 | 0.96 | < 0.01** | 0.43 | 0.97 | 0.76 |
| Crop phase (C) | < 0.01** | 0.02* | < 0.01** | 0.21 | < 0.01** | 0.05* | 0.76 | 0.03* |
| I × C | 0.04* | 0.72 | 0.30 | 0.32 | 0.58 | 0.84 | 0.88 | 0.76 |
| Nematicide (N) | 0.71 | 0.66 | 0.53 | 0.81 | 0.31 | 0.22 | 0.30 | 0.13 |
| I × N | 0.68 | 0.42 | 0.15 | 0.98 | 0.78 | 0.10 | 0.27 | 0.74 |
| C × N | 0.97 | 0.54 | 0.52 | 0.55 | 0.15 | 0.42 | 0.97 | 0.13 |
| I × C × N | 0.34 | 0.87 | 0.63 | 0.42 | 0.99 | 0.25 | 0.55 | 0.76 |
| Helicotylenchus dihystera population density | ||||||||
| 2017 | 2018 | |||||||
| Pia | Pm | Pf | Rf | Pi | Pm | Pf | Rf | |
| ANOVA (p values) | ||||||||
| Irrigation (I) | 0.33 | 0.60 | 0.93 | 0.31 | 0.06 | 0.28 | 0.22 | 0.36 |
| Crop phase (C) | 0.56 | 0.03* | 0.19 | 0.90 | 0.07 | 0.15 | 0.04* | 0.43 |
| I × C | 0.85 | 0.34 | 0.98 | 0.60 | 0.57 | 0.50 | 0.56 | 0.39 |
| Nematicide (N) | 0.02* | 0.10 | < 0.01** | 0.75 | 0.02* | 0.01** | < 0.01** | 0.42 |
| I × N | 0.07 | 0.64 | 0.52 | 0.39 | 0.57 | 0.44 | 0.03* | 0.50 |
| C × N | 0.42 | 0.01** | 0.06 | 0.25 | 0.25 | 0.06 | 0.02* | 0.28 |
| I × C × N | 0.64 | 0.09 | 0.29 | 0.37 | 0.40 | 0.15 | 0.09 | 0.24 |
1 Notes: aPi, Pm, and Pf are p-values for mean nematode population densities (per 100 cm3 soil) prior to planting, at midseason (52 and 56 days after planting in 2017 and 2018), and at harvest (150 and 151 days after planting in 2017 and 2018), respectively. Rf is reproduction factor (Pf/Pi).
* and ** represent significant effects at p ≤ 0.05 and p ≤ 0.01, respectively.
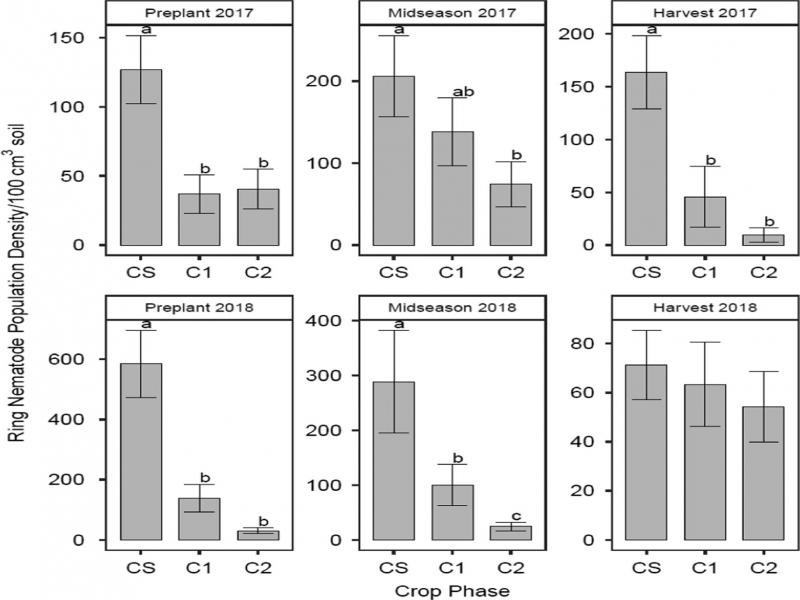
Figure 2:
Ring nematode (Mesocriconema ornatum) population density (nematodes/100 cm3 soil) as influenced by crop phase in 2017 and 2018 soil samples. CS is the cotton phase of the sod-based rotation, C1 is first-year conventional cotton, and C2 is second-year conventional cotton. Different letters denote significant differences between crop phases (Fisher’s protected LSD, p ≤ 0.05).
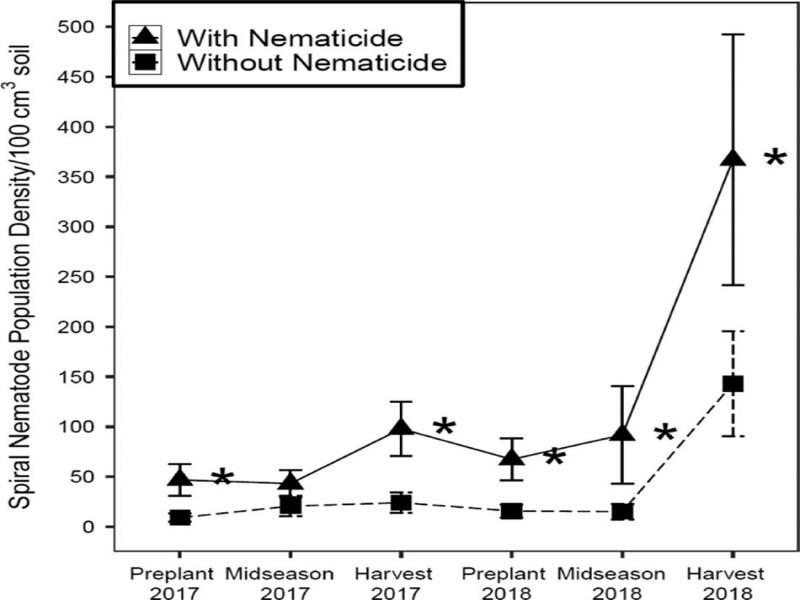
Figure 3:
Spiral nematode (Helicotylenchus dihystera) population density (nematodes/100 cm3 soil) as influenced by nematicide application in 2017 and 2018 soil samples. With nematicide and without nematicide refer to the absence or presence of fluopyram, respectively. *indicates significant nematicide effect within the given season (p ≤ 0.05).
Table 5.
Effects of irrigation, crop phase, and nematicide application on cotton seed yield and lint yield (kg/ha).
| 2017a | 2018 | |||
|---|---|---|---|---|
| Seed yield | Lint yield | Seed yield | Lint yield | |
| ANOVA (p values) | ||||
| Irrigation (I) | 0.50 | 0.32 | 0.06 | 0.31 |
| Crop phase (C) | 0.01** | 0.01** | 0.19 | 0.41 |
| I × C | 0.64 | 0.72 | 0.53 | 0.62 |
| Nematicide (N) | < 0.01** | < 0.01** | 0.03* | 0.06 |
| I × N | 0.81 | 0.79 | 0.40 | 0.65 |
| C × N | 0.01** | 0.09 | 0.05* | 0.07 |
| I × C × N | 0.45 | 0.58 | 0.07 | 0.22 |
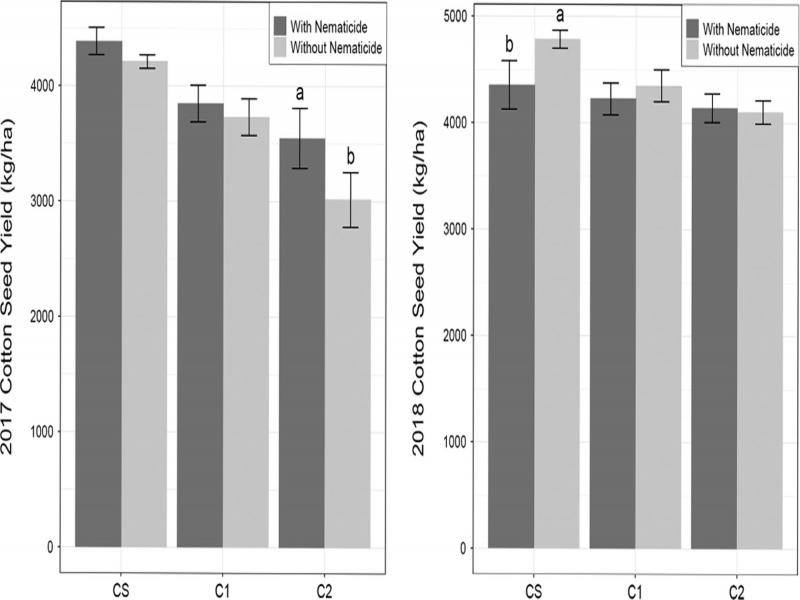
Figure 4:
Cotton seed yield (kg/ha) in 2017 and 2018. CS is the cotton phase of the sod-based rotation, C1 is first-year conventional cotton, and C2 is second-year conventional cotton. With nematicide and without nematicide refer to absence or presence of fluopyram, respectively. Different letters denote significant differences between nematicide treatments within crop phase (Fisher’s protected LSD, p ≤ 0.05).