
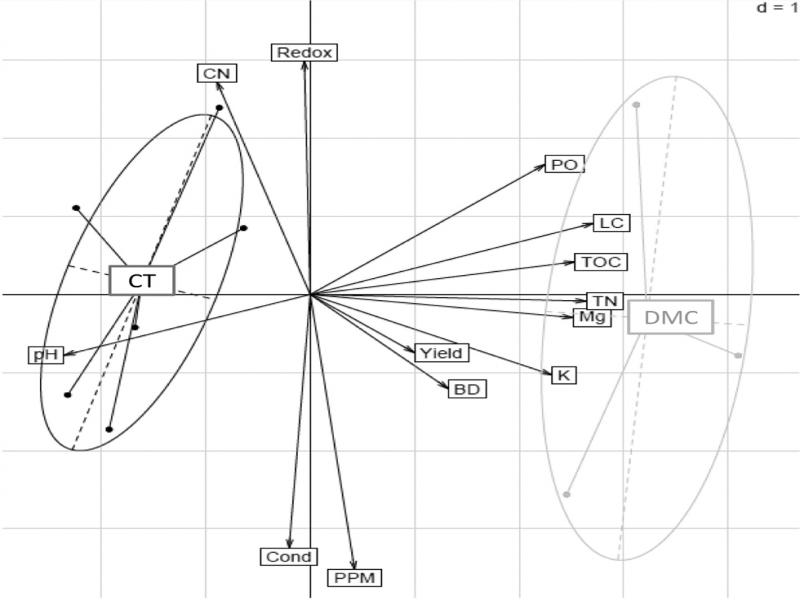
Figure 1:
Principal component analysis (PCA) between plots belonging to conventional plough-based tillage (CT) and direct-seeding mulch-based cropping (DMC) systems and other variables in Stung Chinith field experiment. The first two dimension captures 43.3 and 21.9% of the total variance, respectively. Each dot is a plot; plots are regrouped by an ellipse considering the cultivation mode (DMC vs CT, see text for details). The variables were measured from samples at 10 cm soil layer/depth during each nematode survey: Cond is soil conductivity, Redox is the redaction-oxidation reaction, and ppm is the amount of salt in parts per million. Other variables were calculated from 0 to 5 cm soil layer in the laboratory: pH, BD (soil bulk density (ρb)), K (available potassium (K+)), Mg (available magnesium (Mg2+)), TN (total nitrogen), TOC (total organic carbon), LC (labile carbon), PO (diphosphorus dioxide (P2O2)), and CN (ratio between carbon and nitrogen). Yield is rice yield calculated in kilogram per hectare (kg ha-1). Groups constituted by the cultivation mode (DMC vs CT) are significantly different (Monte–Carlo test p = 0.016).
Table 1.
Comparison of soil minerals in DMC versus CT in sandy field experiment in Cambodia.
| Systems | Plots ID | TOC | TN | CN | LC | pH | PO | BD | Ca2+ | Mg2+ | K+ |
|---|---|---|---|---|---|---|---|---|---|---|---|
| DMC | 42 L | 8.78 | 0.91 | 9.62 | 370.33 | 4.57 | 27.64 | 1.72 | 0.89 | 0.22 | 0.13 |
| DMC | 52 L | 8.38 | 0.91 | 9.16 | 254.94 | 4.50 | 15.21 | 1.78 | 1.20 | 0.22 | 0.14 |
| DMC | 62 L | 13.14 | 1.43 | 9.19 | 312.46 | 4.19 | 17.79 | 1.64 | 0.92 | 0.20 | 0.14 |
| CT | 41 LB | 4.62 | 0.46 | 9.94 | 139.35 | 4.91 | 11.53 | 1.68 | 0.53 | 0.14 | 0.10 |
| CT | 41 LT | 4.43 | 0.45 | 9.81 | 139.91 | 4.96 | 9.53 | 1.62 | 0.51 | 0.14 | 0.10 |
| CT | 51 LB | 5.53 | 0.59 | 9.32 | 110.56 | 4.97 | 12.86 | 1.62 | 0.90 | 0.15 | 0.10 |
| CT | 51 LT | 4.69 | 0.52 | 9.04 | 107.12 | 5.05 | 9.51 | 1.62 | 0.70 | 0.18 | 0.10 |
| CT | 61 LB | 8.30 | 0.75 | 10.99 | 174.19 | 4.45 | 13.39 | 1.49 | 0.56 | 0.15 | 0.10 |
| CT | 61 LT | 8.17 | 0.78 | 10.54 | 169.73 | 4.57 | 15.41 | 1.72 | 0.51 | 0.14 | 0.07 |
| DMC | Plot mean | 10.10 | 1.09 | 9.33 | 312.58 | 4.42 | 20.21 | 1.72 | 1.00 | 0.21 | 0.14 |
| CT | Plot mean | 5.71 | 0.57 | 9.92 | 139.57 | 4.84 | 11.86 | 1.63 | 0.60 | 0.15 | 0.09 |
1 DMC, direct-seeded mulch-based cropping system; CT, conventional tillage; TOC, total organic carbon; TN, total nitrogen; CN, ratio between carbon and nitrogen; LC, labile carbon; pH, potential of hydrogen; PO, diphosphorus dioxide (P2O2); BD, soil bulk density (ρb); Ca2+, calcium irons; Mg2+, available magnesium (Mg2+); and K+, available potassium (K+). Soil properties at 0–5-cm soil depth.
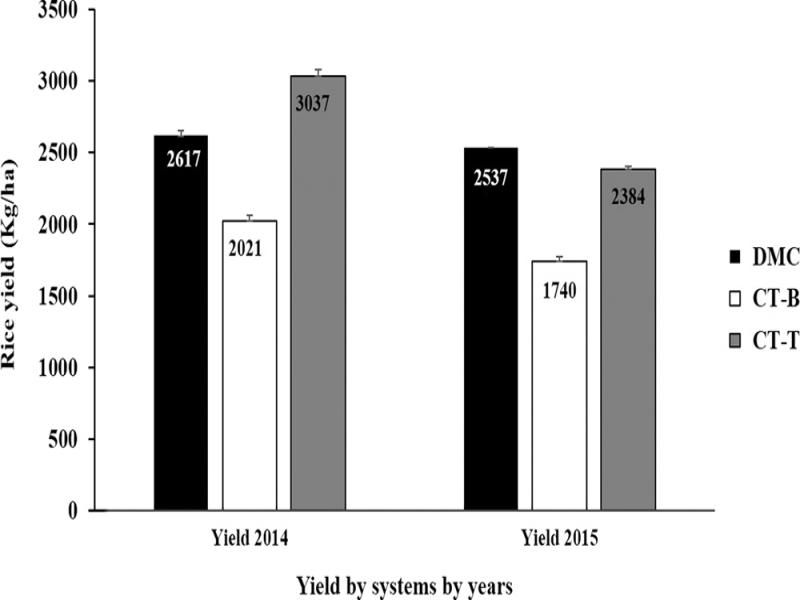
Figure 2:
Comparison of yield in direct mulch-based cropping systems (DMC) vs conventional plough-based tillage (CT) plots. Pairwise comparison of rice production in 2014 and 2015 in the DMC system vs two CT systems using the Kruskal–Wallis non-parametric test. DMC: direct-seeding mulch-based cropping system; CT-B: conventional tillage-seed broadcasting method; CT-T: conventional tillage transplanting method. Values are in kg ha−1 and in the form: mean ± standard error.
Table 2.
Generalized Linear Model (GLM) results with the p-value associated for the four principal factors and the interaction between them, considering the plants are infected or not.
| Variables | Log-likelihood ratio test (χ 2) | df | Pr (>χ 2) |
|---|---|---|---|
| Cropping system | 32.039 | 1 | p < 0.001 |
| Plot | 85.259 | 13 | p < 0.001 |
| Year | 12.900 | 1 | p < 0.001 |
| Rice developmental stage | 72.845 | 2 | p < 0.001 |
| Year × Plot | 132.994 | 13 | p < 0.001 |
| Year × Rice developmental stage | 11.432 | 2 | p = 0.003 |
| Plot × Rice developmental stage | 227.402 | 26 | p < 0.001 |
| Plot × Cropping system | 68.299 | 26 | p < 0.001 |
| Year × Cropping system | 3.514 | 1 | p = 0.060 |
| Rice Developmental stage × Cropping system | 2.366 | 2 | p = 0.030 |
| Cropping system | 52.274 | 1 | p < 0.001 |
| Plot | 99.796 | 13 | p < 0.001 |
| Year | 3.024 | 1 | p = 0.082 |
| Rice developmental stage | 32.079 | 2 | p < 0.001 |
1 GLM results using both non-infested and infested plants (coded 0 for non-infected and 1 for infected plants) were highlight in gray. The model tested the effects of the sampling by year (2014 and 2015), cropping system (DMC and CT), plot and rice developmental stage on RPN population densities and their interactions. The results obtained from the analysis of Deviance Table (Type II tests), the significance was considered at p < 0.05 (presented in bold in the Table). Other non-highlighted color was GLM results using only infected plants. The model tested the effect of the sampling by year (2014 and 2015), cropping system (DMC and CT), plot and rice developmental stage on RPN population densities. The significance was considered at p < 0.05 (presented in bold in the Table). No interactions were detected between variables.
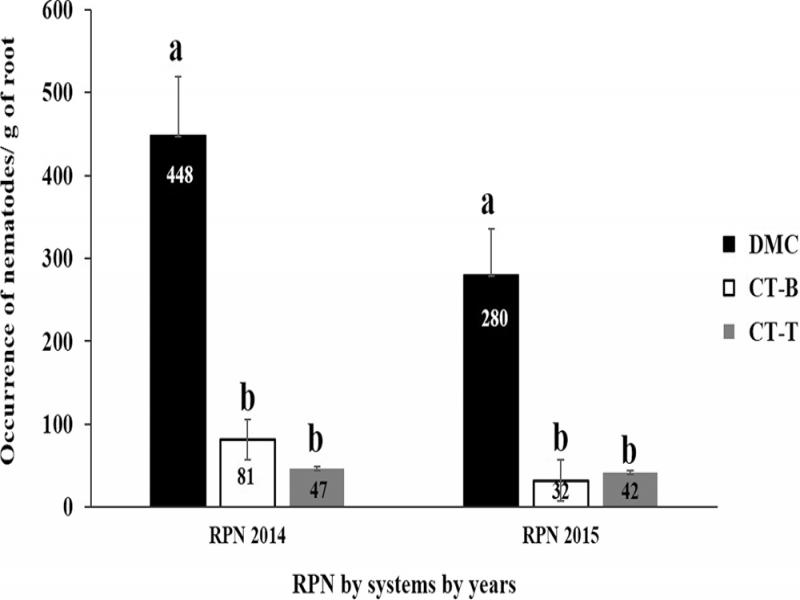
Figure 3:
Comparison of the average number of root-parasitic nematodes between DMC vs conventional tillage plots in both year sequences. RPN stands for root-parasitic nematodes extracted from rice roots. The number of nematodes indicated is the average of RPN per gram of root. Different letter on histogram (a, b) indicates significant difference using Kruskal–Wallis non-parametric test. Values are the mean ± standard error. DMC: direct-seeding mulch-based cropping system; CT-B: conventional tillage-seed broadcasting method; CT-T: conventional tillage transplanting method.
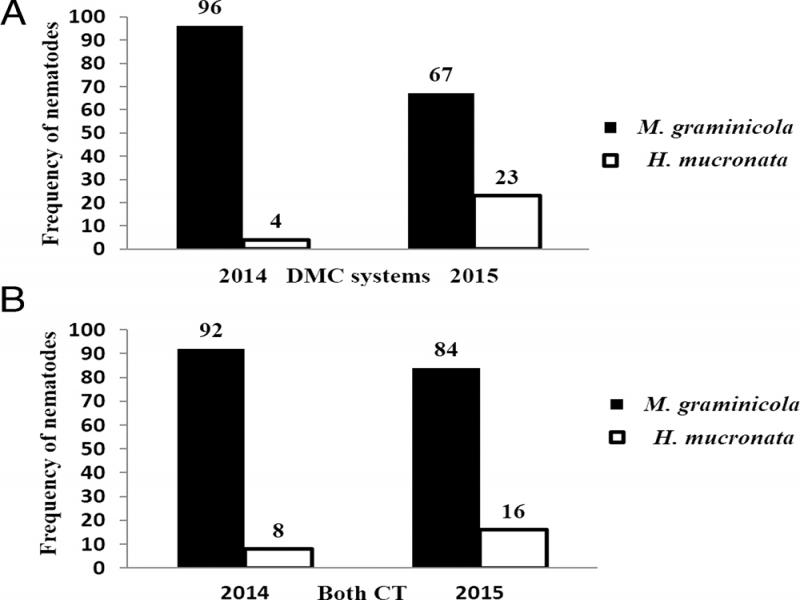
Figure 4:
Comparison of the percentage of Meloidogyne graminicola vs Hirschmanniella mucronata. (A) represents the percentage of M. graminicola vs H. mucronata in directmulch-based cropping systems (DMC). (B) represents the percentage of M. graminicola vs H. mucronata in conventional plough-based tillage (CT).
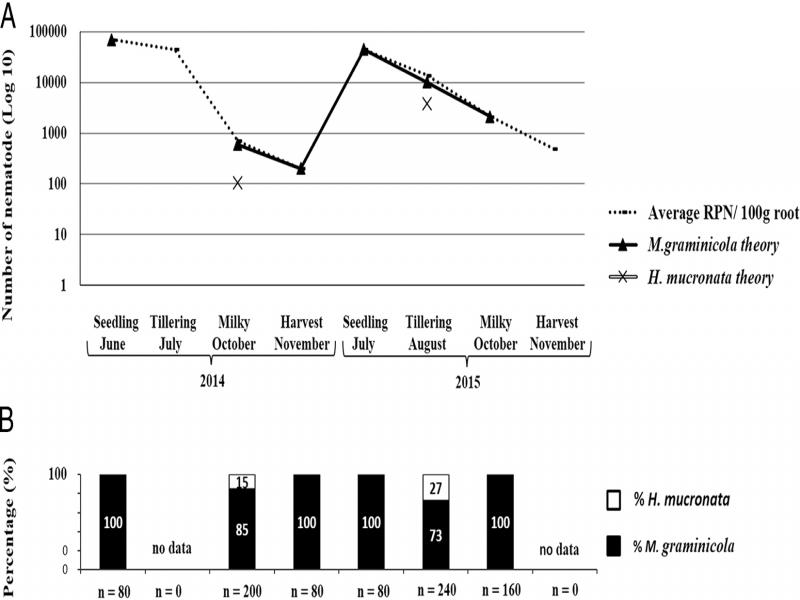
Figure 5:
Comparison of the dynamic of Meloidogyne graminicola vs Hirschmanniella mucronata following rice development stages. (A) represents the dynamic of M. graminicola theory (continue line with the black triangle symbols), of H. mucronata theory (continue line with the cross-black symbol), and of the average of root-parasitic nematodes (RPN) per 100 g of root (discontinued line with squared-white symbols). M. graminicola theory and H. mucronata theory were calculated by multiplying the ratio of M. graminicola and H. mucronata identified by PCR with the total number of RPN then divided by 100. The survey times and the rice development stages are indicated below the lines. The discontinued graphs for M. graminicola and H. mucronata are due to the fact that no J2 were collected during tillering stage 2014 and harvest stage 2015 because the hatching was compromised and we were not able to recover J2 for PCR/Blastn performance. (B) represents the percentage of M. graminicola (black histograms) vs H. mucronata (white histograms) during both eight surveys. n represents the total number of J2 successes identified by PCR and sequencing. No data means that no J2 were collected during tillering stage in 2014 and harvest stage in 2015, because the hatching was compromised and we were not able to collect J2.
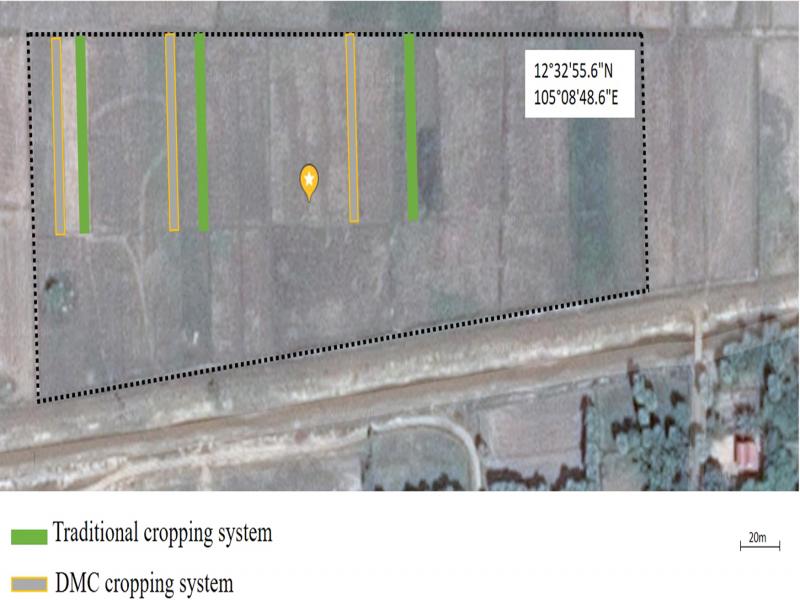
Figure S1:
Distribution of plots in the experimental field (28,850 m2) in Stung Chinith, Cambodia.
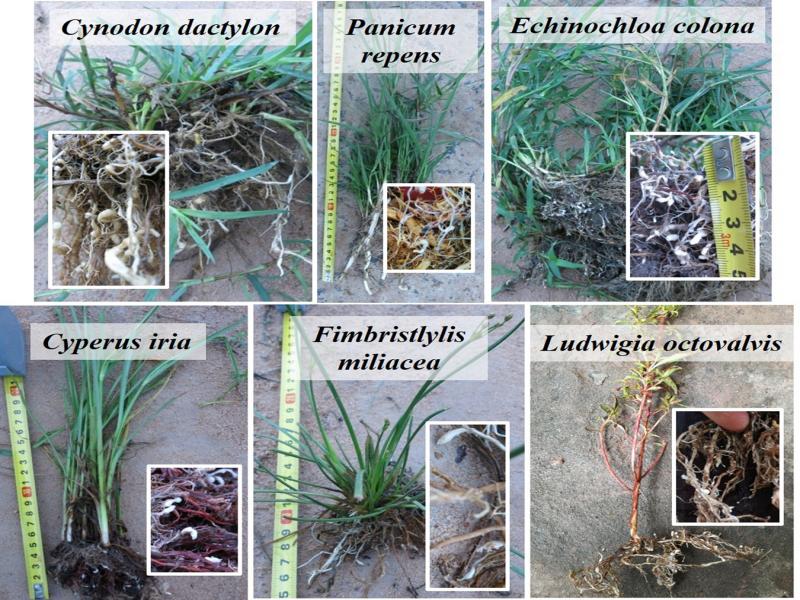
Figure S2:
The typical formation of root galls caused by M. graminicola infection in six weed species commonly found in the lowland experimental paddy field.