
The potato cyst nematodes (PCN) Globodera pallida (Stone) Behrens and G. rostochiensis (Wollenweber) Behrens occur worldwide and can cause over 80% yield loss of potato (Solanum tubersoum) in heavily infested fields (Brown, 1969; Greco and Moreno, 1992). Both species occur in the USA: G. rostochiensis was discovered in New York in 1941 and G. pallida was found in Idaho in 2006 (Chitwood et al., 1942; Hafez et al., 2007). Limiting the distribution of PCN is of highest importance to the US potato industry. As a result of the G. pallida find in Idaho, an extensive survey of potato-producing regions was undertaken in the USA to determine the origin and distribution of PCN. As part of this survey, additional potato acreage in the Pacific Northwest of the USA was sampled.
In one survey, in 2007, a morphologically distinct cyst nematode but very similar PCN was found at two locations in Idaho (Skantar et al., 2011). Independent of this survey, another unusual Globodera population was found at the Oregon State University Central Oregon Agricultural Research Center (OSU-COARC), Powell Butte, OR. These populations were both subsequently determined to be a new species: G. ellingtonae Handoo, Carter, Skantar, and Chitwood (Handoo et al., 2012). Phylogenetic analyses based on ITS rDNA places G. ellingtonae in a monophyletic clade containing both G. pallida and G. rostochiensis as well as the tobacco cyst nematode G. tabacum (Skantar et al., 2011). Due to the close phylogenetic relationship of G. ellingtonae to G. pallida and G. rostochiensis and evidence that G. ellingtonae reproduces on potato, potential damaging effects to potato by this nematode are of great concern (Skantar et al., 2011; Handoo et al., 2012; Zasada et al., 2013; Lax et al., 2014).
To address whether G. ellingtonae is a pathogen of potato, field research was undertaken at OSU-COARC, one of the original locations where this nematode was found. Prior to the discovery of G. ellingtonae at this research center, potatoes were grown on a four-year rotation with the field used for this research last cropped to potato in 2008. It is unknown when G. ellingtonae was introduced at this location. During the initial survey for Globodera sp. conducted in 2008, G. ellingtonae was found at very low densities (1-7 cysts/2.3 kg soil) across the farm, with one hotspot being identified with 24 cysts/2.3 kg soil. To enable the inclusion of a range of initial population densities, potato tubers were inoculated with cysts utilizing a strategy similar to that reported in the literature (Lamondia and Brodie, 1986; Smit and Vamerali, 1998). This strategy also allowed for the inclusion of higher initial population densities that would not have been achievable relying only on endemic field populations.
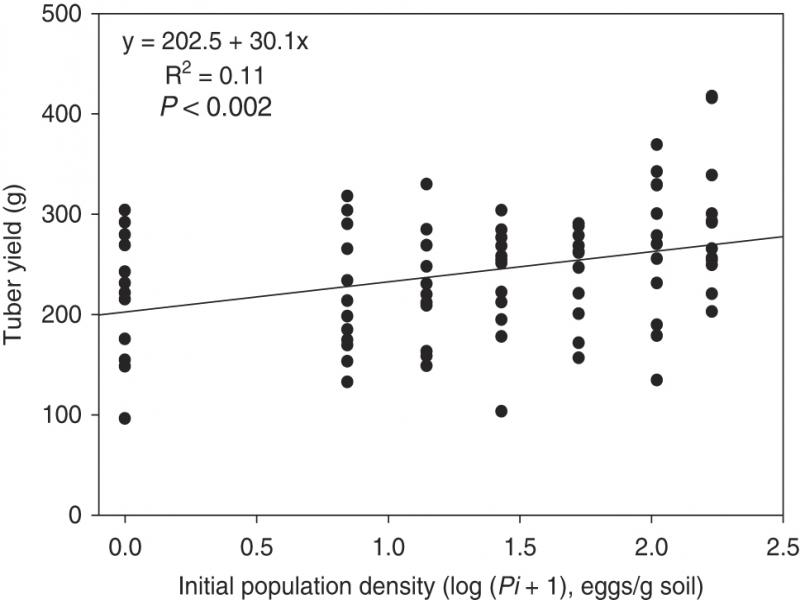
Because PCN generally have just one generation per year and become immobile after initially infecting a host as second-stage juveniles (J2), initial soil egg population density (Pi) is expected to correlate strongly with yield loss (Seinhorst, 1965; Oostenbrink, 1966). Considerable research has been conducted to correlate the Pi of PCN to end of season yield losses (Seinhorst, 1965, 1982; Oostenbrink, 1966; Brown, 1969; Elston et al., 1991; ). We experimentally varied Pi of G. ellingtonae and measured end of season potato yield, dry foliar weight, and final nematode population densities (Pf) in field and microplot experiments.
Materials and methods
Microplot experiment
Inoculum of G. ellingtonae was produced at the Oregon State University Central Oregon Agricultural Research Center (OSU-COARC), Powell Butte, OR by planting potato Russet Burbank into 22-liter pots buried in the soil containing G. ellingtonae cysts in May 2015. Plants were allowed to grow for four months, receiving irrigation and fertilizer. The pots were collected and soil was emptied onto a tarp, dried, and passed through a 4-mm sieve. The soil was mixed and subsamples (100 g) collected to determine G. ellingtonae initial population densities (Pi). Cysts were extracted from ten 100 g soil subsamples using a USDA cyst extractor (Ayoub, 1980), collected and counted. The number of eggs/cysts was determined by crushing all the collected cysts within the subsample with a rubber stopper on a 60- over a 500-mesh sieve (Zasada et al., 2013). The eggs that were retained on the 500-mesh sieve were washed into a 50 ml polystyrene tube. Eggs were enumerated by counting two 1 ml aliquots using an inverted microscope. The average cyst density of the soil was 0.6 (±0.04) cysts/g soil, the average egg density was 169 (±13) eggs/g soil, and the average number of eggs/cyst in soil was 255 (±26). Soil without G. ellingtonae was collected on a part of the farm at Powell Butte, OR where no G. ellingtonae had been found. Collected soil was dried and passed through a 4-mm sieve. Both the infested and uninfested soil is a Redmond ashy sandy loam.
The experiment was conducted in 2017 in microplots in Corvallis, OR. The experimental unit was a 5-liter pot, and pots were placed into beds that were 2.4 × 1.2 × 0.3 m. The bed frames were constructed with wood and lined with pond liner. Soil containing G. ellingtonae was mixed with non-cyst-containing soil to achieve varying Pi (Table 1). The total weight of soil in the pots was 4,800 g. During the process of mixing the soils, water was added to the mixture to create an initially moist environment. The pots were placed into the beds and the remaining area around the pots was filled with soil to help insulate the pots. A single-drop potato Russet Burbank tuber was planted approximately 6 cm deep in each pot. Two trials were conducted each occupying two beds with the second trial established a week after the first trial. The experimental design was completely randomized for both trials with treatments replicated six times.
Table 1.
Summary of microplot and field trials conducted to determine the pathogenicity of Globodera ellingtonae on potato (Solanum tuberosum).
| Name | Year | Cultivar | Initial nematode density (eggs/g soil) evaluated | |||||||||
|---|---|---|---|---|---|---|---|---|---|---|---|---|
| Microplot 1a | 2017 | Russet Burbank | 0, 6, 12, 26, 52, 104, 169 | |||||||||
| Microplot 2 | 2017 | Russet Burbank | 0, 6, 12, 26, 52, 104, 169 | |||||||||
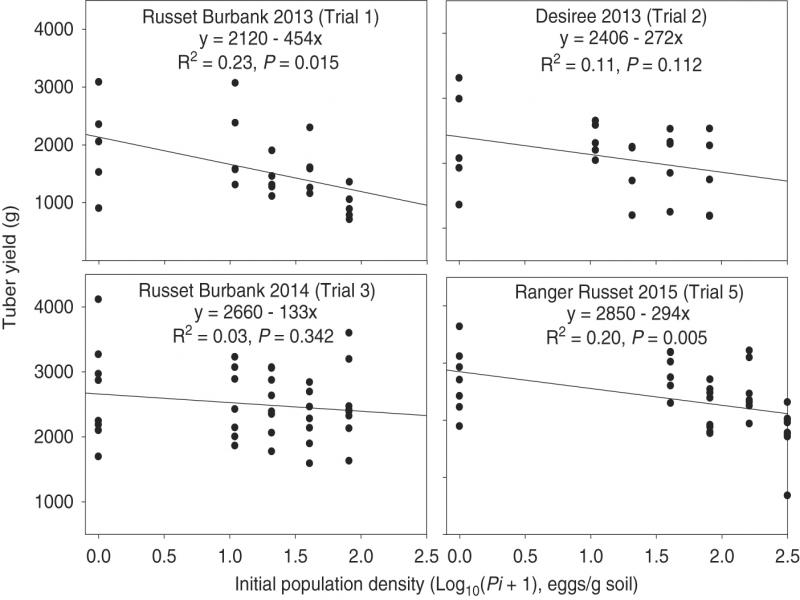
| Trial 1b | 2013 | Russet Burbank | 0, 10, 20, 40, 80 | |||||||||
| Trial 2 | 2013 | Désirée | 0, 10, 20, 40, 80 | |||||||||
| Trial 3 | 2014 | Russet Burbank | 0, 10, 20, 40, 80 | |||||||||
| Trial 4 | 2014 | Various varieties | 0, 80 | |||||||||
| Trial 5 | 2015 | Ranger Russet | 0, 40, 80, 160, 320 | |||||||||
| Pi a | Pf b | Eggs/cyst | RFc | |||||||||
|---|---|---|---|---|---|---|---|---|---|---|---|---|
| 6 | 110 cd | 165 ab | 18.3 a | |||||||||
| 13 | 189 bc | 200 a | 14.5 ab | |||||||||
| 26 | 269 ab | 162 ab | 10.3 bc | |||||||||
| 52 | 308 ab | 140 ab | 5.9 cd | |||||||||
| 104 | 376 ab | 134 b | 3.6 cd | |||||||||
| 169 | 410 a | 144 ab | 2.4 d | |||||||||
| P-value | ≤ 0.001 | 0.045 | ≤ 0.001 | |||||||||
| Potato yield (g) | ||||||||||||
|---|---|---|---|---|---|---|---|---|---|---|---|---|
| Cultivar (Trial) | 0 eggs/g soil | 80 eggs/g soil | Pf a | Eggs/cyst | RFb | |||||||
| Russet Burbank (Trial 1) | 1,878c | 1,063*d | 194 | 119 | 1.6 | |||||||
| Désireé (Trial 2) | 2,329 | 1,781 | 230 | 229 | 3.3 | |||||||
| Russet Burbank (Trial 3) | 2,677 | 2,516 | 292 be | 331 b | 3.7 b | |||||||
| Alturas (Trial 4) | 3,071 | 3,178 | 103 a | 198 a | 1.3 a | |||||||
| Ranger Russet (Trial 4) | 2,610 | 2,428 | 122 ab | 203 a | 1.5 ab | |||||||
| Russet Norkotah (Trial 4) | 1,777 | 1,691 | 127 ab | 200 a | 1.6 ab | |||||||
| Umatilla Russet (Trial 4) | 2,494 | 2,760 | 97 a | 157 a | 1.2 a | |||||||
| Yukon Gold (Trial 4) | 1,257 | 1,560 | 40 a | 170 a | 0.5 a | |||||||
| Ranger Russet (Trial 5) | 2,701 | 2,181* | 195 | 220 | 2.4 | |||||||
| Russet Burbank (Trial 1) | Désireé (Trial 2) | Russet Burbank (Trial 3) | Ranger Russet (Trial 5) | |||||||||
|---|---|---|---|---|---|---|---|---|---|---|---|---|
| Pf b | Eggs/cyst | RFc | Pf | Eggs/cyst | RF | Pf | Eggs/cyst | RF | Pf | Eggs/cyst | RF | |
| 10 | 132 abd | 287 ab | 13.2 a | 197 | 289 | 19.8 a | 50 b | 343 | 5.0 | |||
| 20 | 274 a | 374 a | 13.7 a | 213 | 267 | 10.7 ab | 67 b | 244 | 3.4 | |||
| 40 | 294 ab | 281 ab | 7.3 a | 330 | 247 | 8.3 b | 283 a | 313 | 7.1 | 159 | 273 a | 4.0 a |
| 80 | 119 b | 195 b | 1.5 b | 230 | 229 | 2.8 c | 292 a | 331 | 3.7 | 195 | 220 ab | 2.4 a |
| 160 | 169 | 201 ab | 1.1 b | |||||||||
| 320 | 209 | 167 b | 0.7 b | |||||||||
| P-value | 0.009 | 0.03 | <0.001 | 0.10 | 0.23 | <0.001 | <0.001 | 0.20 | 0.21 | 0.62 | 0.008 | <0.001 |