
Table 1
Oligonucleotides for plasmid construction and sequencing analysis.
| Primer name | Sequence |
|---|---|
| BioB-F | 5′-GAA GGA GAT ATA GAT ATG CCT CCG CCT ATT GGT AGC-3′ |
| BioB-R | 5′-TTA TGG AGT TGG GAT TTA CAG ATT CAG GGT CAC TTT TTC ATC GT-3′ |
| BioB-mut1-F | 5′-CCA TTT CCG GAA CTG ATT TTT CGT GCA CAG AAT GTT C-3′ |
| BioB-mut1-R | 5′-CAG TTC CGG AAA TGG CAG GCT AAA AAC GCT CAG TGC-3′ |
| BioB-Vec-F | 5′-ATC CCA ACT CCA TAA GGA TCC CTT G-3′ |
| BioB-Vec-R | 5′-ATC TAT ATC TCC TTC TTA AAG TTA AAC AAA ATT ATT TCT AGA TGT AGA TGT TAG CC-3′ |
| BioB-flank-F1a | 5′-GGA GAG GAA TGA TAT GAT GAA-3′ |
| BioB-flank-R1a | 5′-CAT CTT CTG CTT CTG TTC TG-3′ |
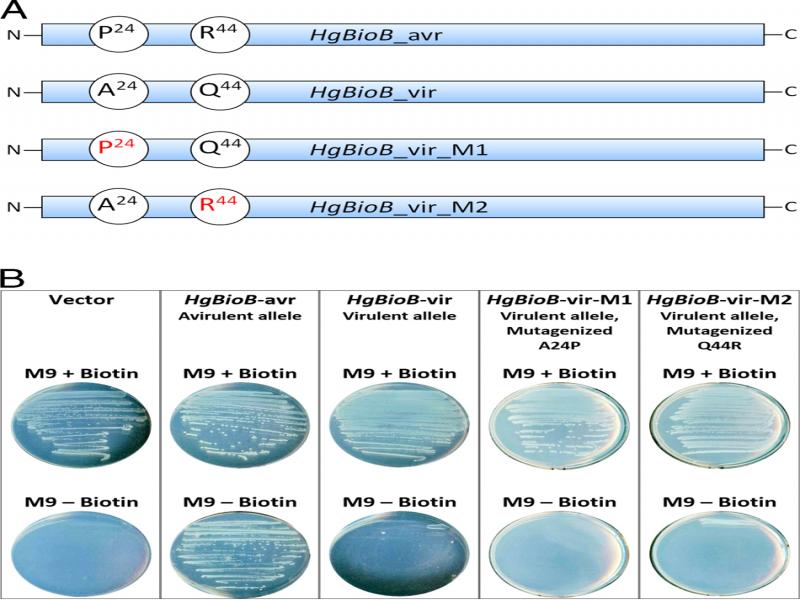
Figure 1
Complementation by expression of HgBioB in biotin synthase-deficient E. coli strain. (A) HgBioB construct diagrams showing polymorphic amino acids, from N-terminus to C-terminus, at positions 24 and 44. HgBioB-vir was mutagenized to produce HgBioB-vir-M1, by generating an alanine to proline mutation at position 24 (A24P); and HgBioB-vir-M2, by generating a glutamine to arginine mutation at position 44 (Q44R). (B) The expression of the vector control, HgBioB-avr, HgBioB-vir, and two mutagenized forms of the virulent allele HgBioB-vir-M1 and HgBioB-vir-M2 on minimal media with and without supplemental biotin.
Table 2
Sequencing analysis of HgBioB nematode populations showing the percentage of amino acids at each polymorphic region.
| 24th Amino acid | 44th Amino acid | |||||
|---|---|---|---|---|---|---|
| SCN populations | Threonine ( A CT) %A | Alanine ( G CT) %G | Proline ( C CT) %C | Glutamine (C A A) %A | Arginine (C G A) %G | Proline (C C A) %C |
| Hg257 | 100.00 | 100.00 | ||||
| Hg0-A | 60.00 | 40.00 | 53.33 | 40.00 | ||
| Hg0-B | 33.33 | 66.67 | 100.00 | |||
| OP 25a | 100.00 | 100.00 | ||||
| OP 20a | 100.00 | 100.00 | ||||
| OP 50a | 33.33 | 66.67 | 100.00 | |||
| TN 20a | 100.00 | 64.29 | 21.42 | |||
| Carbondale 6b | 75.00 | 25.00 | 75.00 | 25.00 | ||
| Carbondale 30b | 100.00 | 100.00 | ||||
| C 104c | 10.00 | 40.00 | 50.00 | 87.50 | 12.50 | |
| C 432c | 83.33 | 16.67 | 100.00 | |||
| EC 138c | 66.67 | 33.33 | 83.33 | 16.67 | ||
| EC 146c | 66.67 | 33.33 | 75.00 | 25.00 | ||
| EC 406c | 60.00 | 40.00 | 75.00 | 25.00 | ||
| NC 228c | 75.00 | 25.00 | 87.50 | 12.50 | ||
| NC 238c | 66.67 | 33.33 | 60.00 | 20.00 | 20.00 | |
| NC 305c | 100.00 | 100.00 | ||||
| NC 408c | 50.00 | 50.00 | 60.00 | 40.00 | ||
| NE 336c | 83.33 | 16.67 | 87.50 | 12.50 | ||
| NE 433c | 100.00 | 100.00 | ||||
| NW 138c | 75.00 | 25.00 | 85.71 | 14.28 | ||
| NW 209c | 57.14 | 42.85 | 66.67 | 33.33 | ||
| NW 308c | 75.00 | 25.00 | 83.33 | 16.67 | ||
| NW 421c | 66.67 | 33.33 | 83.33 | 16.67 | ||
| SC 349c | 75.00 | 25.00 | 83.33 | 16.67 | ||
| SE 132c | 60.00 | 40.00 | 66.67 | 33.33 | ||
| SE 148c | 100.00 | 100.00 | ||||
| SE 217c | 100.00 | 100.00 | ||||
| SW 207c | 40.00 | 60.00 | 50.00 | 50.00 | ||
| SW 242c | 45.45 | 54.54 | 60.00 | 40.00 | ||
| SW 251c | 85.71 | 14.28 | 100.00 | |||
| WC 216c | 100.00 | 100.00 | ||||
| WC 229c | 83.33 | 16.67 | 90.91 | 9.09 | ||
| WC 350c | 90.90 | 9.09 | 100.00 | |||
1 aInbred SCN strains provided by Charlie Opperman (OP) and Terry Niblack (TN); bSCN field populations from Carbondale, Illinois; cSCN field populations provided by Gregory Tylka. The sampling of these populations was conducted in 2015 from different regions of Iowa. The geographical origins are indicated as follows: C = central; EC = east central; NC = north central; NE = northeast; NW = northwest; SC = south central; SE = southeast; SW = southwest; WC = west central; * Amino acids with 100 percent allelic frequencies are shown in boldface.
Table 3
Statistical analysis of amino acid percentages from nematode field populations.
| Amino acid position 24 | Amino acid position 44 | |||
|---|---|---|---|---|
| Alanine (A24) | Proline (P24) | Glutamine (Q44) | Arginine (R44) | |
| Mean | 57.28 | 40.46 | 64.07 | 28.47 |
| SD | 33.51 | 32.88 | 36.02 | 33.21 |
| Median | 66.67 | 33.33 | 75.00 | 16.67 |
| Min | 40.00 | 9.09 | 50.00 | 9.09 |
| Max | 100.00 | 100.00 | 100.00 | 100.00 |
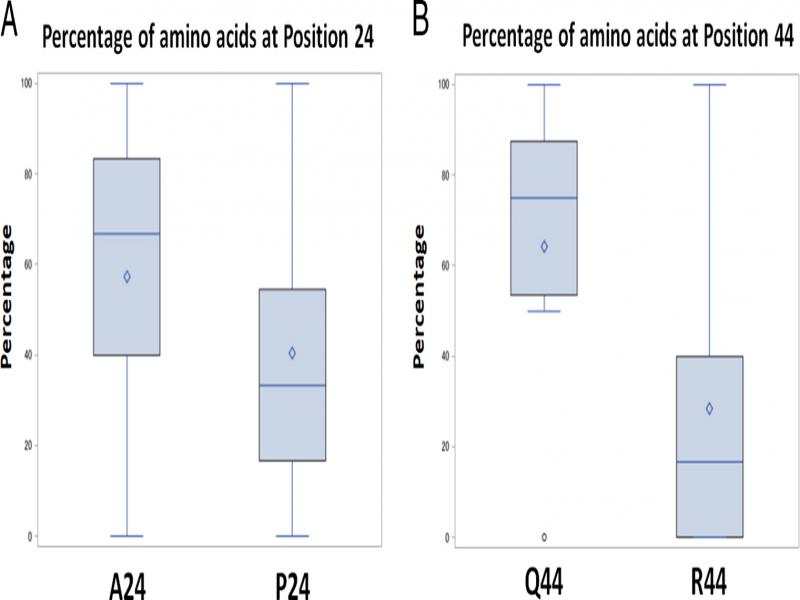
Figure 2
Box plots of HgBioB amino acid polymorphism trends among SCN field populations, showing the percentage of amino acid differences for A24P (A) and Q44R (B).
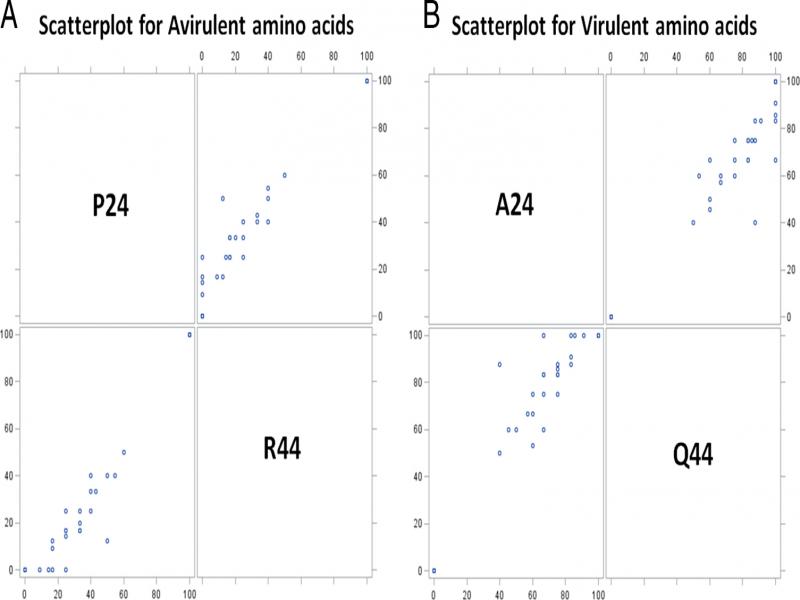
Figure 3
Scatterplots showing the HgBioB avirulent and virulent polymorphic amino acid pairs. (A) The avirulent pair shows a positive linear relationship between amino acid positions P24 and R44. (B) Similarly, the virulent pair also shows a positive linear relationship between amino acid positions A24 and Q44.