
Table 1.
Composition of diets and quantity of ingredients.
| Diet | Diet code | Ingredients composing the diet | Quantity of ingredients (%) |
|---|---|---|---|
| Beeswax | BW | Beeswax slightly air-dried | 100 |
| Standard diet | Gly | Corn flour | 18.85 |
| Wheat flour | 18.85 | ||
| Soybean flour | 9.42 | ||
| Powdered milk | 14.28 | ||
| Yeast | 4.76 | ||
| Beeswax | 15.00 | ||
| Honey | 9.42 | ||
| Glycerol | 9.42 | ||
| Dog croquettes 1 | DC1 | Beef | 4 in the nuggets with beef |
| Chicken | 4 in the nuggets with chicken | ||
| Carrots | 4 in the nuggets with carrots | ||
| Green vegetables | 4 in the nuggets with green vegetables | ||
| Derivatives of vegetables, oils and fats, minerals | Not available | ||
| Dog croquettes 2 | DC2 | Cereals | 4 in the nuggets with cereals in the form of beige pastille |
| Beef dehydrated | 4 in the nuggets with beef in the form of red steak | ||
| Poultry dehydrated | 4 in the nuggets with chicken in the form of beige steak | ||
| Derivatives of vegetable origin, meats, oils and fats, minerals | Not available | ||
| Dog croquettes 3 | DC3 | Cereals | 40 |
| Meats and derivatives of animal origin | 4 of dehydrated beef protein | ||
| Derivatives of vegetable origin | 4 of peas | ||
| Oils and fats, minerals, propylene glycol, sugar | Not available |
Table 2.
Cost of production of diets tested to rear G. mellonella larvae.
| Diet code | Composition | Purchase price (USD)a | Ingredients to produce 1 kg of diet | Calculated cost of diet/kg (USD) | Cost of total diet/kg (USD) | Time (wks) to feed 20 larvae of G. mellonella/kg of diet |
|---|---|---|---|---|---|---|
| BW | Beeswax | 5.11/kg | 1 kg | 5.11 | 5.11 | 3 |
| Gly | Corn flour | 0.34/kg | 188.57 g | 0.068 | ||
| Wheat flour | 17.03/bag of 25 kg | 188.57 g | 0.14 | |||
| Soy flour | 0.51/kg | 94.28 g | 0.051 | |||
| Powdered milk | 45.97/cardboard box of 10 kg | 142.86 g | 0.66 | 6.30 | 1½ | |
| Yeast | 40.86/cardboard box of 10 kg | 47.24 g | 0.20 | |||
| Beeswax | 5.11/kg | 150 g | 0.77 | |||
| Honey | 4.26/liter | 94.28 g | 0.40 | |||
| Glycerol | 42.57/liter | 94.28 g | 4.02 | |||
| DC1 | Adult dog multi-rolls + honey | 6.81/bag of 4 kg dog croquettes | 700 g | 1.19 | 4 | |
| 5.11 for 1 liter of honey | 300 ml | 1.53 | 2.72 | |||
| DC2 | Adult dog croquettes + honey | 7.66/bag of 4 kg | 700 g | 1.35 | 2.88 | 4 |
| 5.11 for 1 liter of honey | 300 ml | 1.53 | ||||
| DC3 | Tender adult dog croquettes + honey | 8.43/bag of 4 kg | 700 g | 1.48 | 2.11 | - |
| 5.11 for 1 liter of honey | 300 ml | 1.53 |
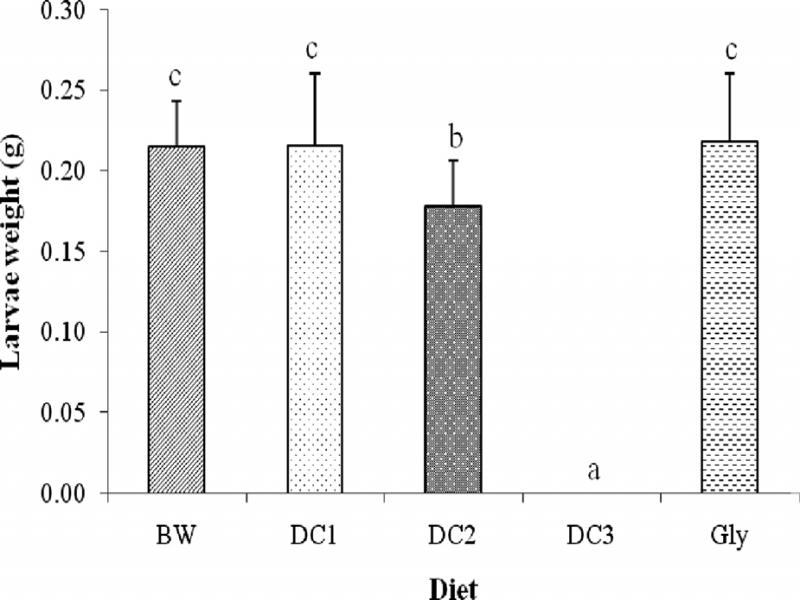
Figure 1:
Weight (mean ± standard deviation) of G. mellonella larvae obtained at the cocoon spinning stage by diet tested. No larvae emerged on diet DC3, and so there were no data. Weights followed by the same letter do not significantly differ at P < 0.05. BW, beeswax; Gly, standard glycerol-based artificial diet; DC1 to DC3, three varieties of adult dog croquettes.
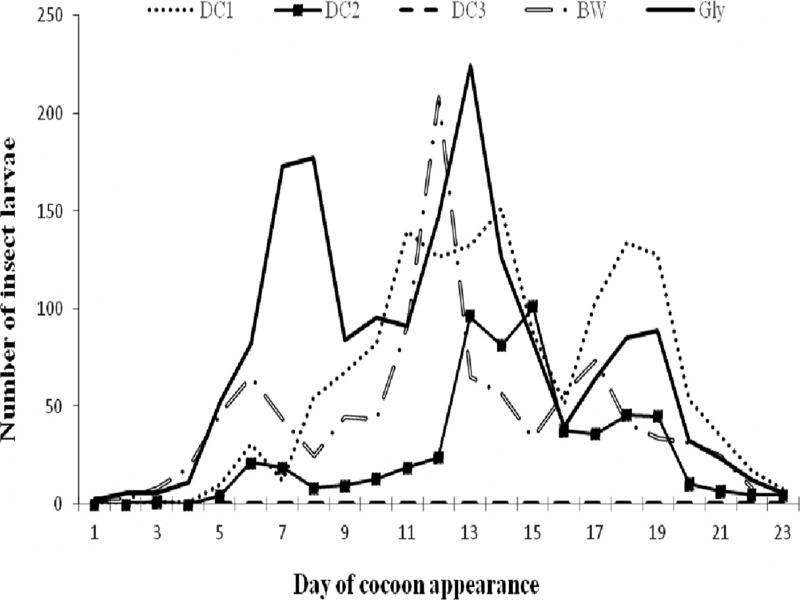
Figure 2:
Variation curve of the number of G. mellonella larvae produced for all five diets as a function of time. BW, beeswax; Gly, standard glycerol-based artificial diet; DC1 to DC3, three varieties of adult dog croquettes.
Table 3.
ANOVA for mortality at ambient temperature of G. mellonella larvae using factors of exposure time, nematode isolate, diet, and their interactions.
| Source of variation | F | df | P |
|---|---|---|---|
| Isolate | 0.34 | 4 | 0.851 |
| Diet | 9.91 | 2 | 0.001 |
| Exposure time | 5.42 | 3 | 0.002 |
| Diet × isolate | 5.49 | 8 | 0.001 |
| Diet × exposure time | 1.87 | 6 | 0.092 |
| Isolate × exposure time | 1.14 | 12 | 0.335 |
| Diet × isolate × exposure time | 1.62 | 24 | 0.048 |
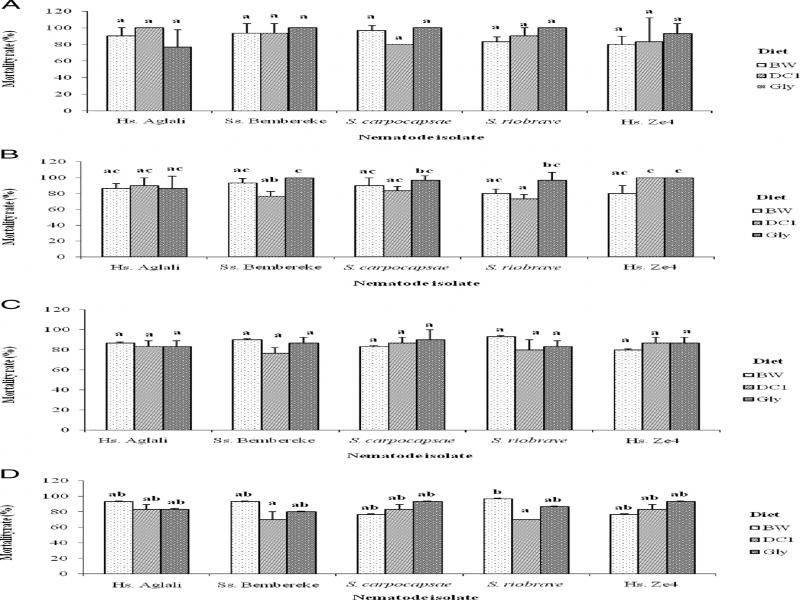
Figure 3:
Mortality rate (mean ± standard deviation) of G. mellonella larvae based on diet, nematode isolate, and exposure time (T1-T4): (A) T1 (1 wk); (B) T2 (2 wks); (C) T3 (3 wks); and (D) T4 (4 wks). Mortality rates followed by the same letter do not significantly differ at P < 0.05. BW, beeswax; Gly, standard glycerol-based artificial diet; DC1, adult dog croquettes.
Table 4.
ANOVA results for population density of nematodes in G. mellonella according to different factors (diets, nematode isolate, and exposure time) by dissection.
| Source of variation | F | df | P |
|---|---|---|---|
| Diet | 23.68 | 2 | 0.001 |
| Nematode isolate | 31.47 | 4 | 0.001 |
| Exposure time | 24.11 | 3 | 0.001 |
| Diet × Nematode isolate | 13.90 | 8 | 0.001 |
| Diet × Exposure time | 24.54 | 6 | 0.001 |
| Nematode isolate × Exposure time | 21.18 | 12 | 0.001 |
| Diet × Nematode isolate × Exposure time | 12.48 | 24 | 0.001 |
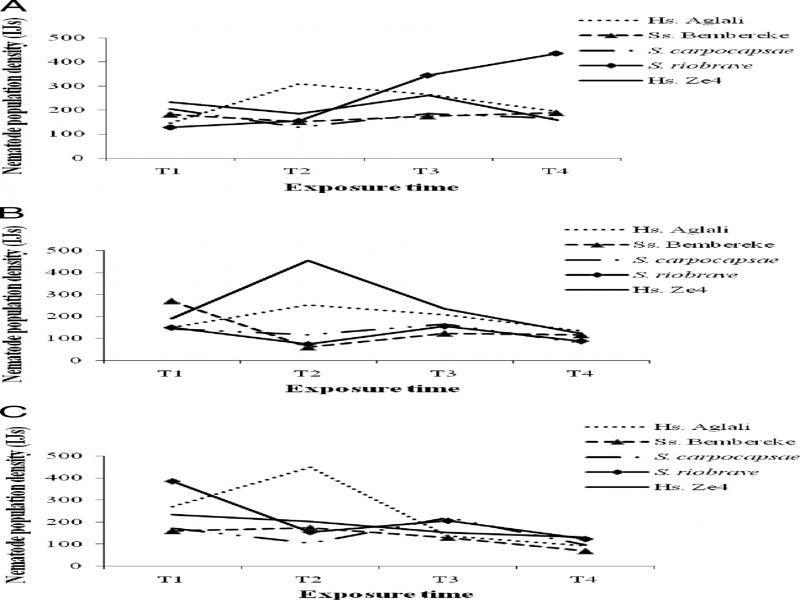
Figure 4:
Nematode population density resulting from dissection of infected G. mellonella larvae fed on BW (beeswax), DC1 (adult dog croquettes), and Gly (standard glycerol-based artificial diet) over time (T1-T4). The nematode population densities presented are the means obtained in 50 μ l of suspension/larvae: (A) BW; (B) DC1; and (C) Gly.
Table 5.
ANOVA results for population density of nematodes in G. mellonella according to different factors (diets, nematode isolate, and exposure time) by White traps.
| Source of variation | F | df | P |
|---|---|---|---|
| Diet | 4.33 | 2 | 0.013 |
| Nematode isolate | 64.61 | 4 | 0.001 |
| Exposure time | 145.79 | 3 | 0.001 |
| Diet × Nematode isolate | 6.82 | 8 | 0.001 |
| Diet × Exposure time | 1.08 | 6 | 0.369 |
| Nematode isolate × Exposure time | 11.23 | 12 | 0.001 |
| Diet × Nematode isolate × Exposure time | 4.78 | 24 | 0.001 |
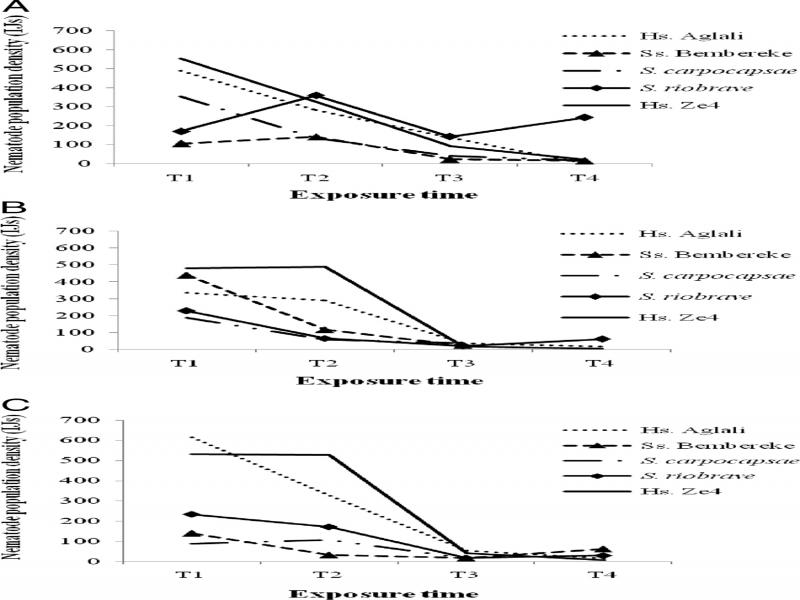
Figure 5:
Nematode population density based on nematode isolate and exposure time (T1-T4), over 7 d after the first appearance of nematodes in White traps for the BW (beeswax), DC1 (adult dog croquettes), and Gly (standard glycerol-based artificial diet) diets. The nematode population densities presented are the means obtained in 50 μ l of suspension/larvae: (A) BW; (B) DC1; and (C) Gly.
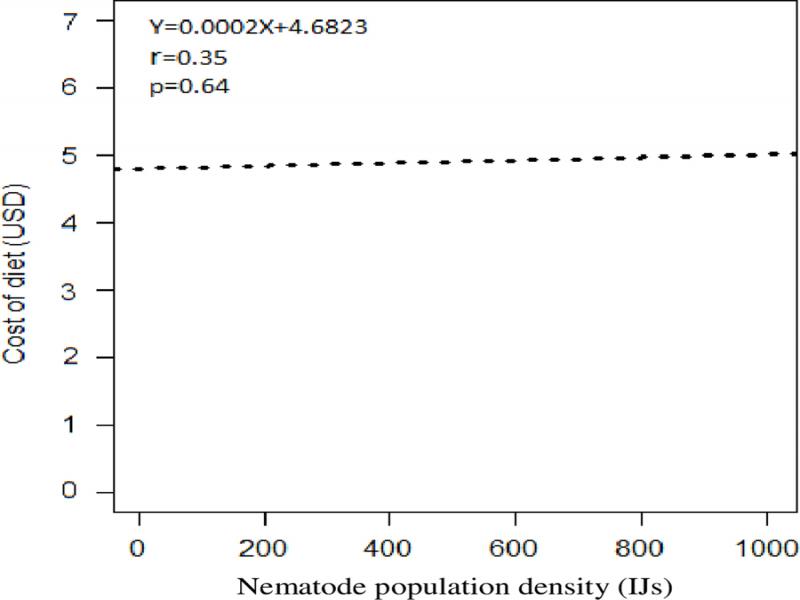
Figure 6:
Relationship between costs of producing diets of G. mellonella and nematode population densities.