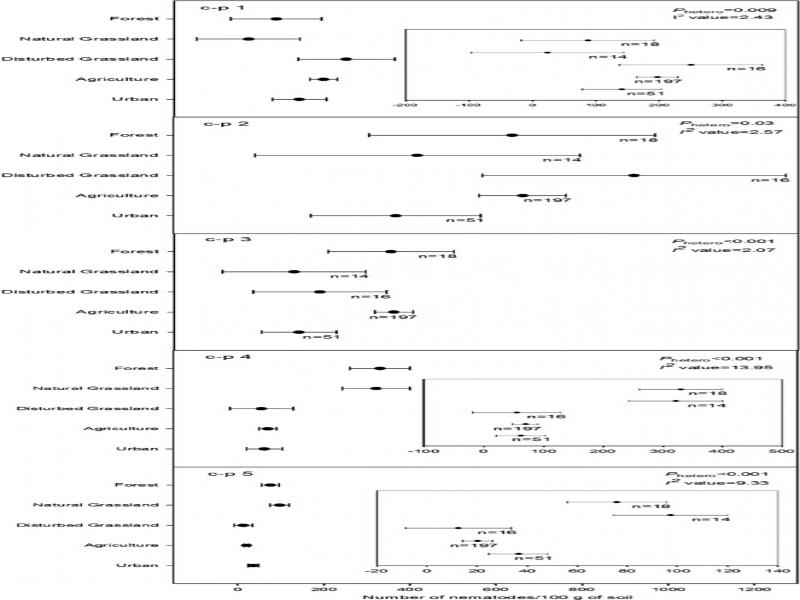
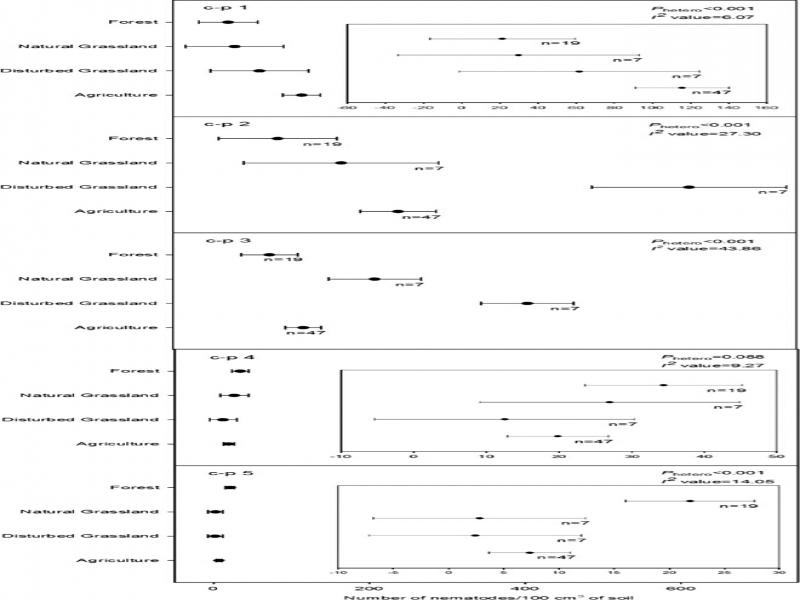
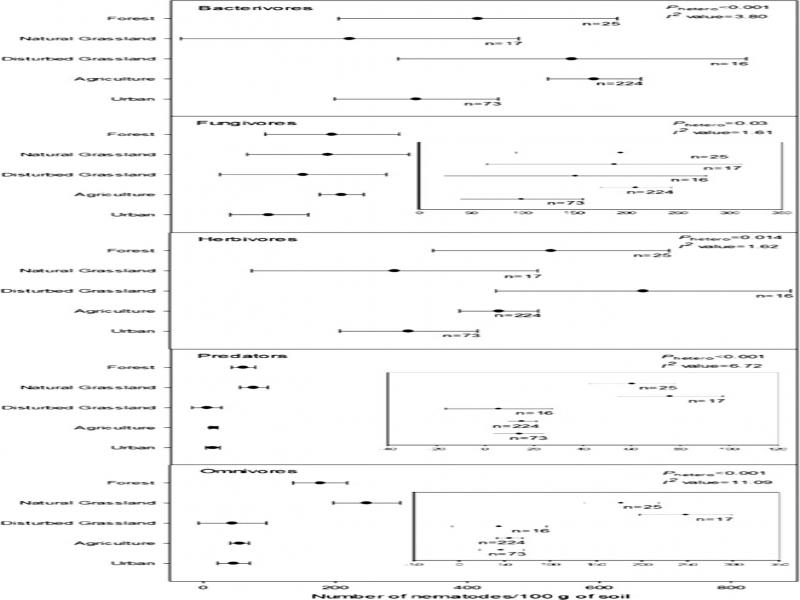
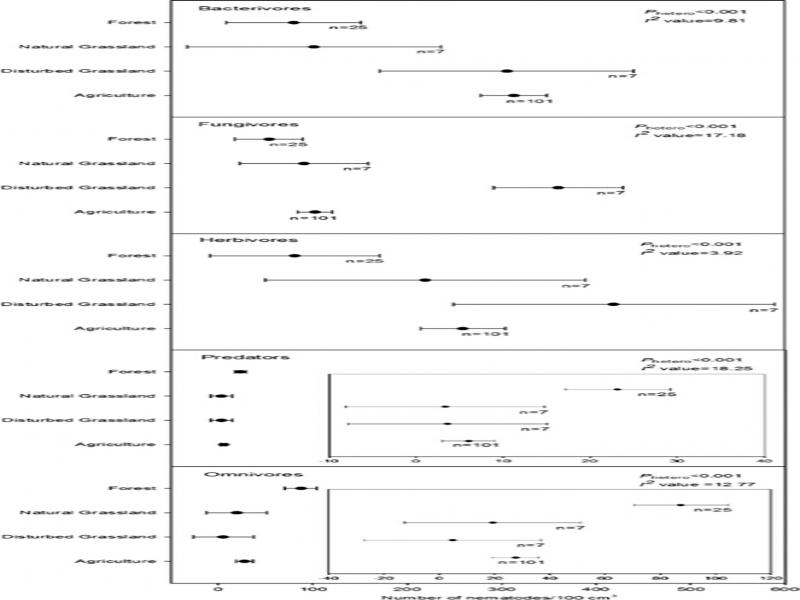
Biodiversity plays pivotal roles in ecosystem functioning and provision of ecosystem services that are crucial to human well-being. These services include providing food and water; managing floods, pests, and diseases; and supporting photosynthesis, nutrient cycling, soil formation, and crop pollination that sustain all other services (Millennium Ecosystem Assessment (MEA), 2003). Unfortunately, modern human civilization occurs at the expense of biodiversity. Land transformation is the principal driving force for biodiversity loss. Human activity has extensively transformed the land surface by agricultural intensification and urbanization (Vitousek et al., 1997). Urbanization and agricultural practices such as burning, tillage, fertilizer applications, and mono-cultural cropping practices affect below-ground biodiversity and its functions including decomposition, nutrient cycling, bioremediation, and pest and disease regulation (Giller et al., 1997). Despite its diverse benefits, biodiversity in soils is understudied compared to above-ground biodiversity.
Soil is a dynamic system in which organisms interact with each other and form complex food webs (Hunt and Wall, 2002). Nematodes are at the central place in the soil food web because they represent multiple trophic levels including primary, secondary, and tertiary consumer levels (Yeates et al., 1993). The structure of a nematode community provides good information on the condition of the soil food web since nematodes are specific in their food sources and are most abundant in all habitats where decomposition occurs (Bongers and Bongers, 1998). Yeates et al. (1993) assigned nematodes to different trophic groups such as bacterivores, fungivores, herbivores, predators, and omnivores based on their feeding habits. Bacterivores, fungivores, and herbivores are considered as nematode trophic groups in the lower hierarchy of the soil food web and predators and omnivores are considered as nematode trophic groups in the higher hierarchy of the soil food web (Yodzis, 2001). Nematode trophic interactions contribute to regulating nutrient dynamics in soil. Bacterivores and fungivores promote N and C mineralization by feeding on decomposing bacterial and fungal biomass. Nematode trophic groups in the higher hierarchy of the soil food web maintain ecological balance between decomposition and mineralization by regulating bacterivores and fungivores (Ingham et al., 1985). In addition, predators act as biocontrol agents by feeding on plant feeding nematodes (Bilgrami and Brey, 2005). Bongers (1990) developed a colonizer-persister (c-p) scale for nematodes by allocating the nematode taxa to one of five c-p groups ranging from colonizers (c) with a c-p value 1 to persisters (p) with a c-p value 5 through intermediate values based on their life history characteristics and survival strategies. Nematodes with small size, short life span, and high fecundity are assigned to c-p 1, whereas those with the longest-lived nematodes, low fecundity, and slow in development are placed in c-p 5 (Bongers, 1990). Many useful indices for nematode faunal analysis have been developed based on trophic groups and c-p scale. Consequently, nematodes can be used as indicators of structure and function of soil food webs and overall ecosystem conditions (Ferris et al., 2001).
A plethora of published literature exists on how different ecosystems affect the abundance (number of nematodes) and richness (number of taxa) of nematodes. However, there is no single consensus about the pattern of nematode abundance and richness in different ecosystems across the published literature. Some authors have reported that richness is high in forest ecosystems and abundance is high in agricultural ecosystems (Yeates and Bongers, 1999; Ferris et al., 2001; Yeates, 2007; Cardoso et al., 2015) but others have stated the converse (Neher et al., 2005; Briar et al., 2007; Darby et al., 2007; Kimenju et al., 2009). The existence of a large body of literature with diverse results creates the need to synthesize quantitative summaries in order to draw general conclusions across studies and test key hypotheses regarding patterns and processes governing soil biodiversity. Meta-analysis is a tractable and powerful statistical tool developed to generate a quantitative summary of all the published literature and draw conclusions across multiple studies (Arnqvist and Wooster, 1995). Therefore, meta-analysis was chosen to address this issue.
The specific objective of this study was to assess the influence of agricultural intensification and urbanization on nematode richness and abundance compared to forest and grassland ecosystems through meta-analysis of published literature on a global scale. The richness and abundance of nematodes were compared using different moderator levels or explanatory variables. We hypothesized that overall richness, overall abundance, and richness and abundance of nematodes of each trophic group and c-p guild are greater in forest and natural grassland (NGL) ecosystems compared to urban, agriculture and disturbed grassland (DGL) ecosystems.
Materials and methods
Data collection
The Web of Science core database was systematically searched for relevant publications on October 7, 2016, with the following combination of search terms: (‘nematode communities’ or ‘soil nematodes’ or ‘nematode diversity’ or ‘nematode abundance’ or ‘nematode biodiversity’) and (‘grassland’ or ‘forest’ or ‘agriculture’ or ‘prairie’ or ‘urban’), which resulted in 1,613 articles. Criteria for including an article in the analysis were: studies were conducted in forest, grassland, urban, or agriculture ecosystems; studies identified nematodes to family or genus level; studies reported mean abundance or richness expressed per grams or cm3 of soil; soil samples were collected from natural conditions; and studies reported sample size. Criteria for excluding an article were: studies conducted in controlled conditions like microcosms, mesocosms, pots, or greenhouses; studies expressing abundance of nematodes as relative abundance instead of absolute abundance; and studies reporting data for total free-living nematodes instead of each trophic group. Among the 1,613 articles, 598 relevant articles that contained data on richness and abundance of nematodes in different ecosystems were selected by examining titles and abstracts. Among the 598 articles, 111 articles (Supplementary Material) met the inclusion criteria and were selected for data extraction. Among the 111 articles, 91 expressed data in grams and 20 expressed data in cm3. The first 200 articles from a Google Scholar search were examined using the above search terms, which did not produce additional articles. A spreadsheet was constructed by extracting data from each article on authors, title, year of publication, unit of soil, richness and abundance of nematodes of each trophic group and each c-p guild, overall richness and overall abundance of nematodes, treatment, sample size, and type of ecosystem. Overall richness and overall abundance of nematodes were calculated by adding the number of genera/families and abundance of nematodes of either all trophic groups or all c-p guilds, respectively. Richness and abundance of nematodes under each trophic group and each c-p guild were calculated by adding the number of genera/families and abundance of nematodes corresponding to each guild and each trophic group, respectively. If there was more than one treatment in an article, they were considered as distinct studies in the meta-analysis. For example, there were two treatments, conventional-conservation tillage and organic-conservation tillage in Sánchez-Moreno et al. (2009), these two treatments were considered as two distinct studies. Based on these criteria, a total of 667 studies were subjected for meta-analysis of which 449 studies conducted in agriculture, 28 conducted in DGL, 74 conducted in forest, 36 conducted in NGL, and 80 conducted in urban ecosystems. Soil units in nematode studies are typically expressed as grams (Briar et al., 2007) or in cm3 (Wang et al., 2006). Therefore, the richness and abundance of nematodes expressed per 100 g of soil and 100 cm3 of soil were analyzed separately. Richness and abundance of nematodes per 100 g of soil were compared across all five ecosystems. However, the data expressed per 100 cm3 of soil were compared across only four ecosystems as no urban ecosystem studies using 100 cm3 were available. Abundance of nematodes that was not expressed per 100 g or cm3 of soil was converted to 100 g or cm3 of soil. However, richness of nematodes was not converted because increase in richness cannot be assessed with increase in the quantity of soil.
Effect size
Effect size typically represents the strength of the relationship between two variables or two groups (treatment and control) but can also refer to the estimate of a single group or value such as richness or abundance of each study (Borenstein et al., 2009). Summary effect size is defined as weighted mean of richness or abundance of all studies in each ecosystem. Meta-analyses were conducted to compare the summary effect sizes of overall richness and overall abundance of nematodes and nematodes of each trophic group and each c-p guild per soil weight and volume basis among different ecosystems such as forest, NGL, DGL, agriculture, and urban ecosystems. Overall richness and overall abundance of nematodes per grams and per cm3 of soil were considered as four main effect sizes; richness and abundance of nematodes per grams and per cm3 of soil in each trophic group and each c-p guild were considered as subgroup effect sizes.
Moderator variable
The types of ecosystems, forest, NGL, DGL, agriculture, and urban, were considered as moderator levels. These five ecosystems were assumed to have different regimes of disturbance where forest and NGL are considered less disturbed, whereas agriculture and urban ecosystems are considered highly disturbed from continuous human intervention. The moderator was chosen to determine the influence of disturbance on soil health.
Meta-analysis
The procedures and terminology of Borenstein et al. (2009) were followed in this analysis. Comprehensive meta-analysis (CMA) software was used to estimate effects of different levels of moderator on nematodes based on their confidence intervals, P hetero values, Q statistics, and I 2 values where Q is heterogeneity, and I 2 is a measure of inconsistency across the studies (Version 3, Biostat, Englewood, NJ, USA; 2014). Random effects model was used rather than fixed effects model for meta-analyses as it considers within-study variance along with between-studies variance. Each study was weighted by the inverse of non-parametric variance. Non-parametric variance was calculated using the formula 1/n, where n is the sample size adjusted by using the following formula:
where m is the number of studies in a paper; and t the number of time-points within a year (Borenstein et al., 2009, equation 24.6). Studies within a paper are generally considered as not independent (Mengersen et al., 2013), therefore, studies were down-weighted by a factor of m 0.5, (assuming 0.1 correlation among studies). After estimating different summary effects using CMA, the results were plotted in forest plots using SigmaPlot version 13.0 (Systat Software, San Jose, California). The summary effects along with their confidence intervals (CIs) from the meta-analyses were graphically depicted in forest plots.Heterogeneity
Q is a weighted squared deviation used to evaluate heterogeneity, defined here as real differences among summary effect sizes. It separates observed variation from true variation. Total variation (Qt) consists of Qw (expected variation, within-study variation, or sampling error) and Qm (excess variation, between-study variation) (Borenstein et al., 2009). I 2 is an estimate of the ratio of heterogeneity to total variation across the observed effect sizes (Higgins and Thompson, 2002; Huedo-Medina et al., 2006). It is the proportion of total variation due to heterogeneity in true effect size. I 2 is computed as 100 × (Qt–;df)/Qt %, where degrees of freedom (df) measures within-study variation and Qt–df is true heterogeneity or between-study variation. I 2 reflects the percentage of variation due to real differences in outcomes among studies (Borenstein et al., 2009). I 2 values of 25, 50, and 75% may be considered as low, moderate, and high, respectively (Higgins et al., 2003). In meta-analysis, a significant heterogeneity P value (P hetero value<0.05) or positive I 2 indicates that there were real differences among studies; however, the converse is not true. A non-significant P-value (P hetero value> 0.05) does not indicate that there were no real differences among studies because the non-significance could be due to low statistical power and/or large real dispersion of effect sizes and/or large within-study variance (Borenstein et al., 2009).
Sensitivity analysis and publication bias
A sensitivity analysis was conducted to assess the stability and consistency of the summary effects. The summary effect was recalculated by removing one study at a time. This measures how sensitive the results are to any one study. The potential presence of publication bias was tested using the Begg and Mazumdar rank (Kendall) correlation test and graphically by examining summary effect sizes vs their standard errors in funnel plots (Begg and Mazumdar, 1994; Borenstein et al., 2009).
Results
Heterogeneity test
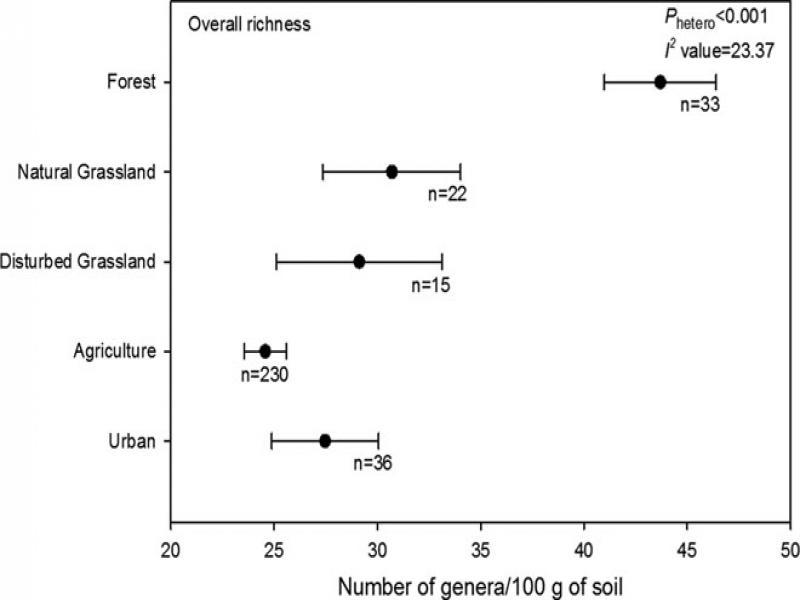
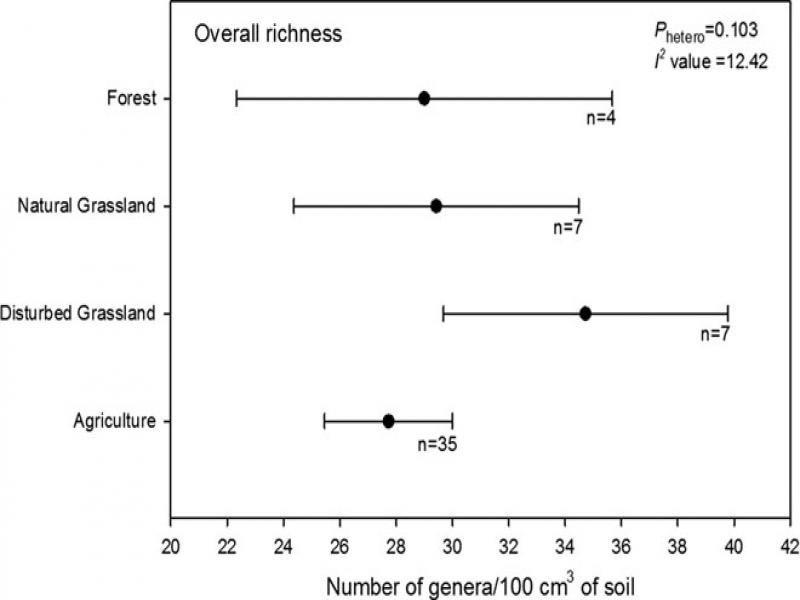
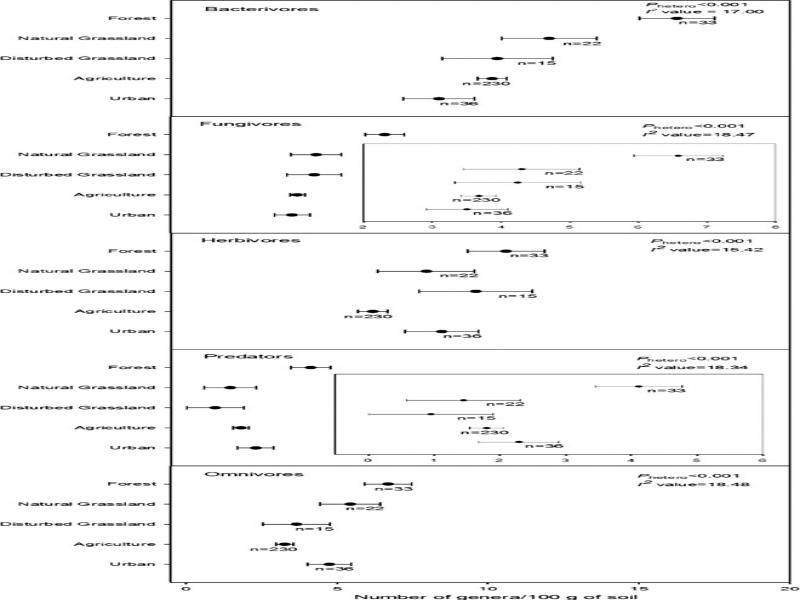
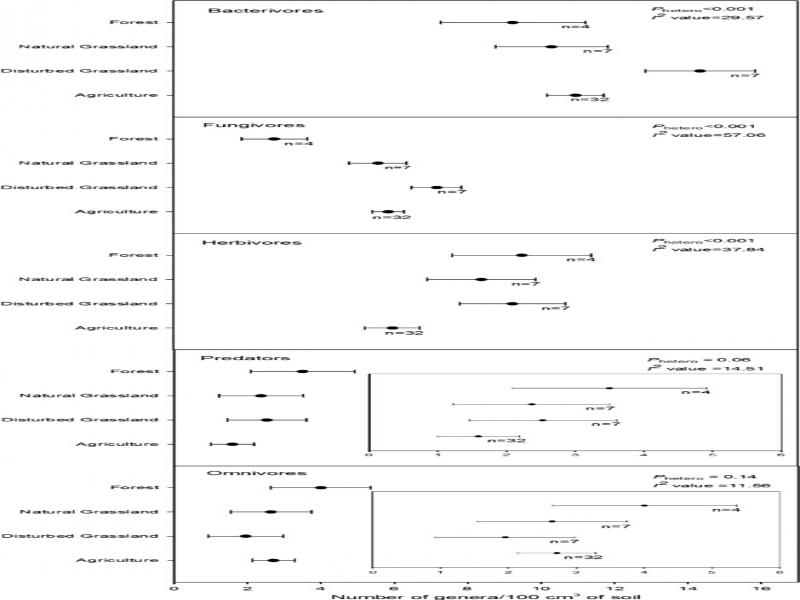
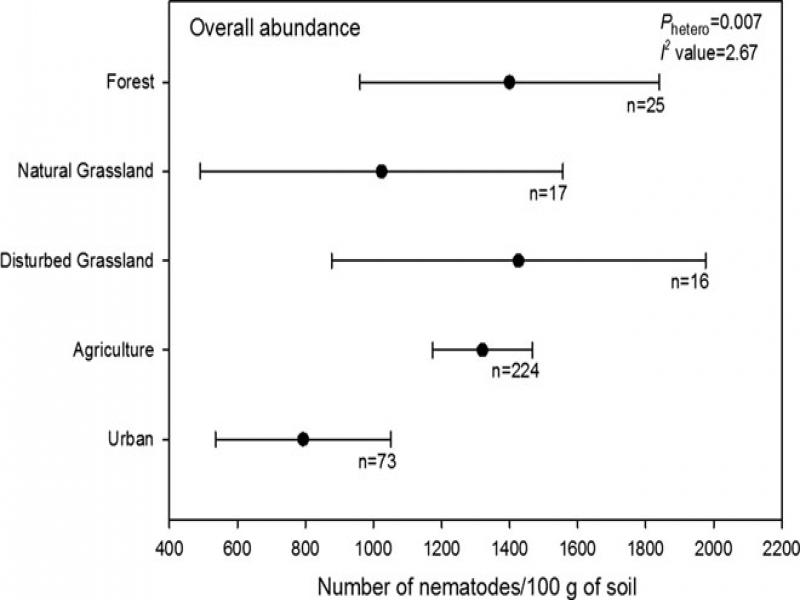
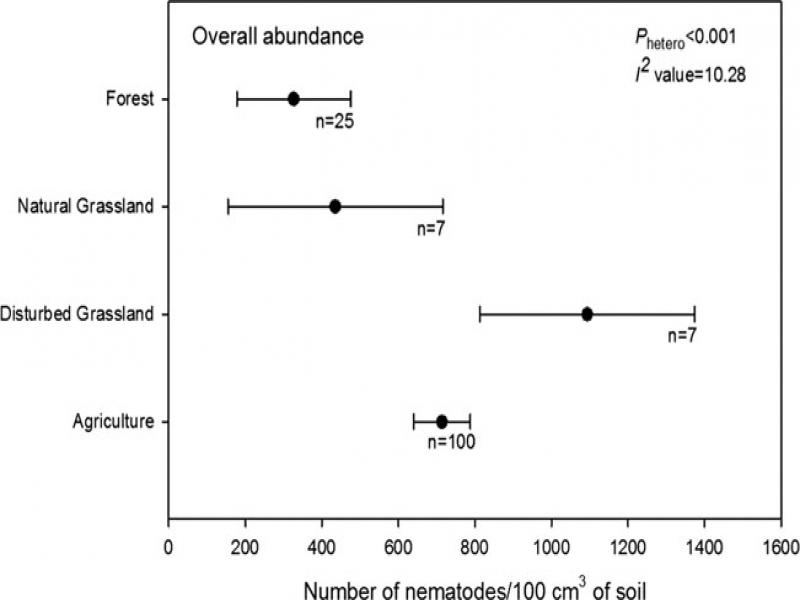
A total of 44 summary effect sizes were tested in the meta-analysis performed, of which 40 summary effect sizes were significantly heterogeneous (P hetero <0.05) and all summary effects had positive I 2 values (Table 1). The five summary effect sizes that were not significantly heterogenous included overall richness, c-p 4 richness and abundance, predator richness and omnivore richness from 100 cm3 soil samples (P hetero > 0.05) (Table 1).
Table 1
Heterogeneity statistics for the summary effect sizes per 100 g and per 100 cm3 of soil.
| 100 g | 100 cm3 | |||||
|---|---|---|---|---|---|---|
| Summary effect | Qt | Phetero | I2 | Qt | Phetero | I2 |
| Overall richness | 740.37 | 0.000 | 23.37 | 49.75 | 0.103 | 12.42 |
| Overall abundance | 525.42 | 0.007 | 2.67 | 320.94 | 0.000 | 10.28 |
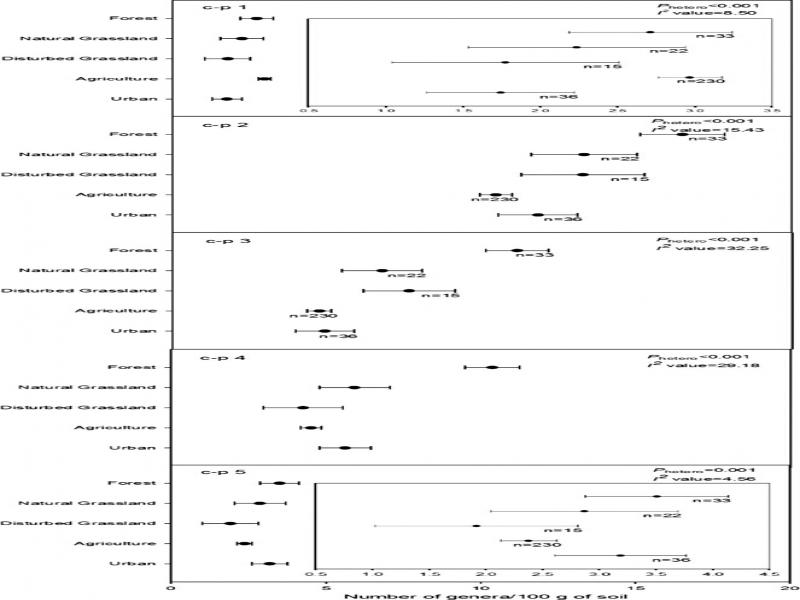
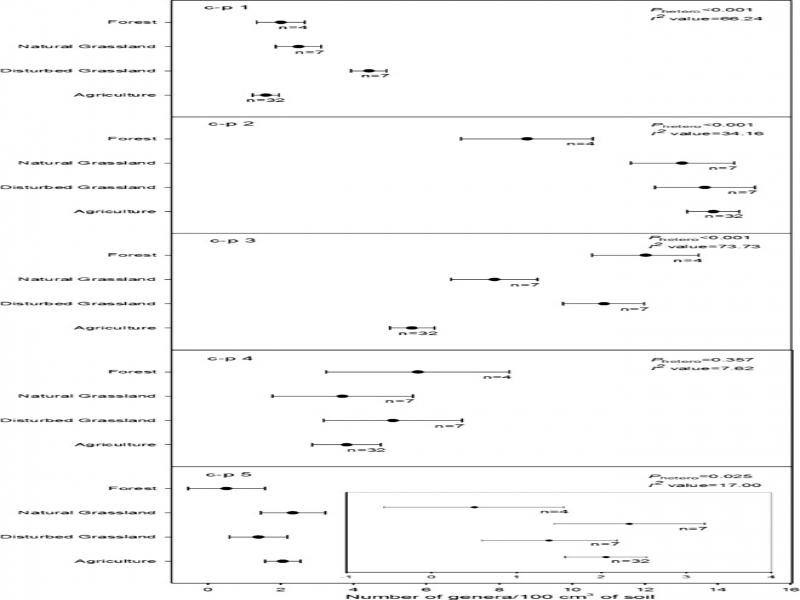
| Richness of c-p 1 | 347.88 | 0.000 | 8.50 | 129.66 | 0.000 | 66.24 |
| Richness of c-p 2 | 486.97 | 0.000 | 15.43 | 79.06 | 0.000 | 34.16 |
| Richness of c-p 3 | 453.61 | 0.000 | 32.25 | 147.73 | 0.000 | 73.73 |
| Richness of c-p 4 | 520.05 | 0.000 | 29.18 | 42.39 | 0.357 | 7.62 |
| Richness of c-p 5 | 390.74 | 0.001 | 4.56 | 54.84 | 0.025 | 17.00 |
| Abundance of c-p 1 | 553.15 | 0.009 | 2.43 | 330.58 | 0.000 | 6.07 |
| Abundance of c-p 2 | 422.77 | 0.028 | 2.57 | 186.77 | 0.000 | 27.30 |
| Abundance of c-p 3 | 1,299.77 | 0.000 | 2.07 | 224.18 | 0.000 | 43.86 |
| Abundance of c-p 4 | 609.75 | 0.000 | 13.95 | 70.48 | 0.088 | 9.27 |
| Abundance of c-p 5 | 730.70 | 0.000 | 9.33 | 159.32 | 0.000 | 14.05 |
| Richness of bacterivores | 584.92 | 0.000 | 17.00 | 76.29 | 0.000 | 29.57 |
| Richness of fungivores | 392.01 | 0.000 | 18.47 | 105.16 | 0.000 | 57.06 |
| Richness of herbivores | 358.48 | 0.000 | 15.42 | 69.50 | 0.000 | 37.84 |
| Richness of predators | 267.55 | 0.000 | 18.34 | 50.88 | 0.061 | 14.51 |
| Richness of omnivores | 446.01 | 0.000 | 18.48 | 48.12 | 0.135 | 11.56 |
| Abundance of bacterivores | 519.91 | 0.001 | 3.80 | 396.91 | 0.000 | 9.81 |
| Abundance of fungivores | 645.08 | 0.034 | 1.61 | 357.16 | 0.000 | 17.18 |
| Abundance of herbivores | 762.77 | 0.015 | 1.62 | 430.30 | 0.001 | 3.92 |
| Abundance of predators | 768.10 | 0.000 | 6.72 | 144.93 | 0.000 | 18.25 |
| Abundance of omnivores | 747.91 | 0.000 | 11.09 | 344.69 | 0.000 | 12.77 |