
Table 1.
Molecular basis of the MAM- phenotype
| Allele name | Nucleotide change | Exon | Amino acid change | Reference | rs number | Identified in (n) | gnomAD† frequency of the variant allele (≥0.01%) |
|---|---|---|---|---|---|---|---|
| MAM*01N.01 | c.123>G | 3 | p.Tyr41Ter | rs201392469 | 0.003 Middle East | ||
| c.373A>G | 5 | p.lle125Val | Thornton et al.5 | rs4893 | Middle East region (3) | 0.002 Ashkenazi Jew 0.041 European and Middle East | |
| MAM*01N.02 | c.182-186_322+418del (745bp deletion) | 4 | p.Trp62_Ser108del | Thornton et al.5 | NA | Turkish (2) | ND |
| MAM*01N.03 | c.323-231_492+338del (822bp deletion) | 5 | p.Val109_Ter164del | Thornton et al.5 | NA | Not known (1 ; Germany) | ND |
| MAM*01N.04 | c.1-3513_492+1379del (8518bp deletion) | 1–5 | p.Met1_Ter164del | Thornton et al.5 | NA | White/Cherokee (1; United States) | ND |
| MAM*01N.05 | c.1-3532_492+1361del (8519bp deletion) | 1–5 | p.Met1_Ter164del | Thornton et al.5 | NA | White (1; New Zealand) | ND |
| Not yet assigned | c.341 to IVS5+688 (923bp) | 5 | p.Gly114_Ter164del | Baglow et al.7 | NA | Malaysian (1) | ND |
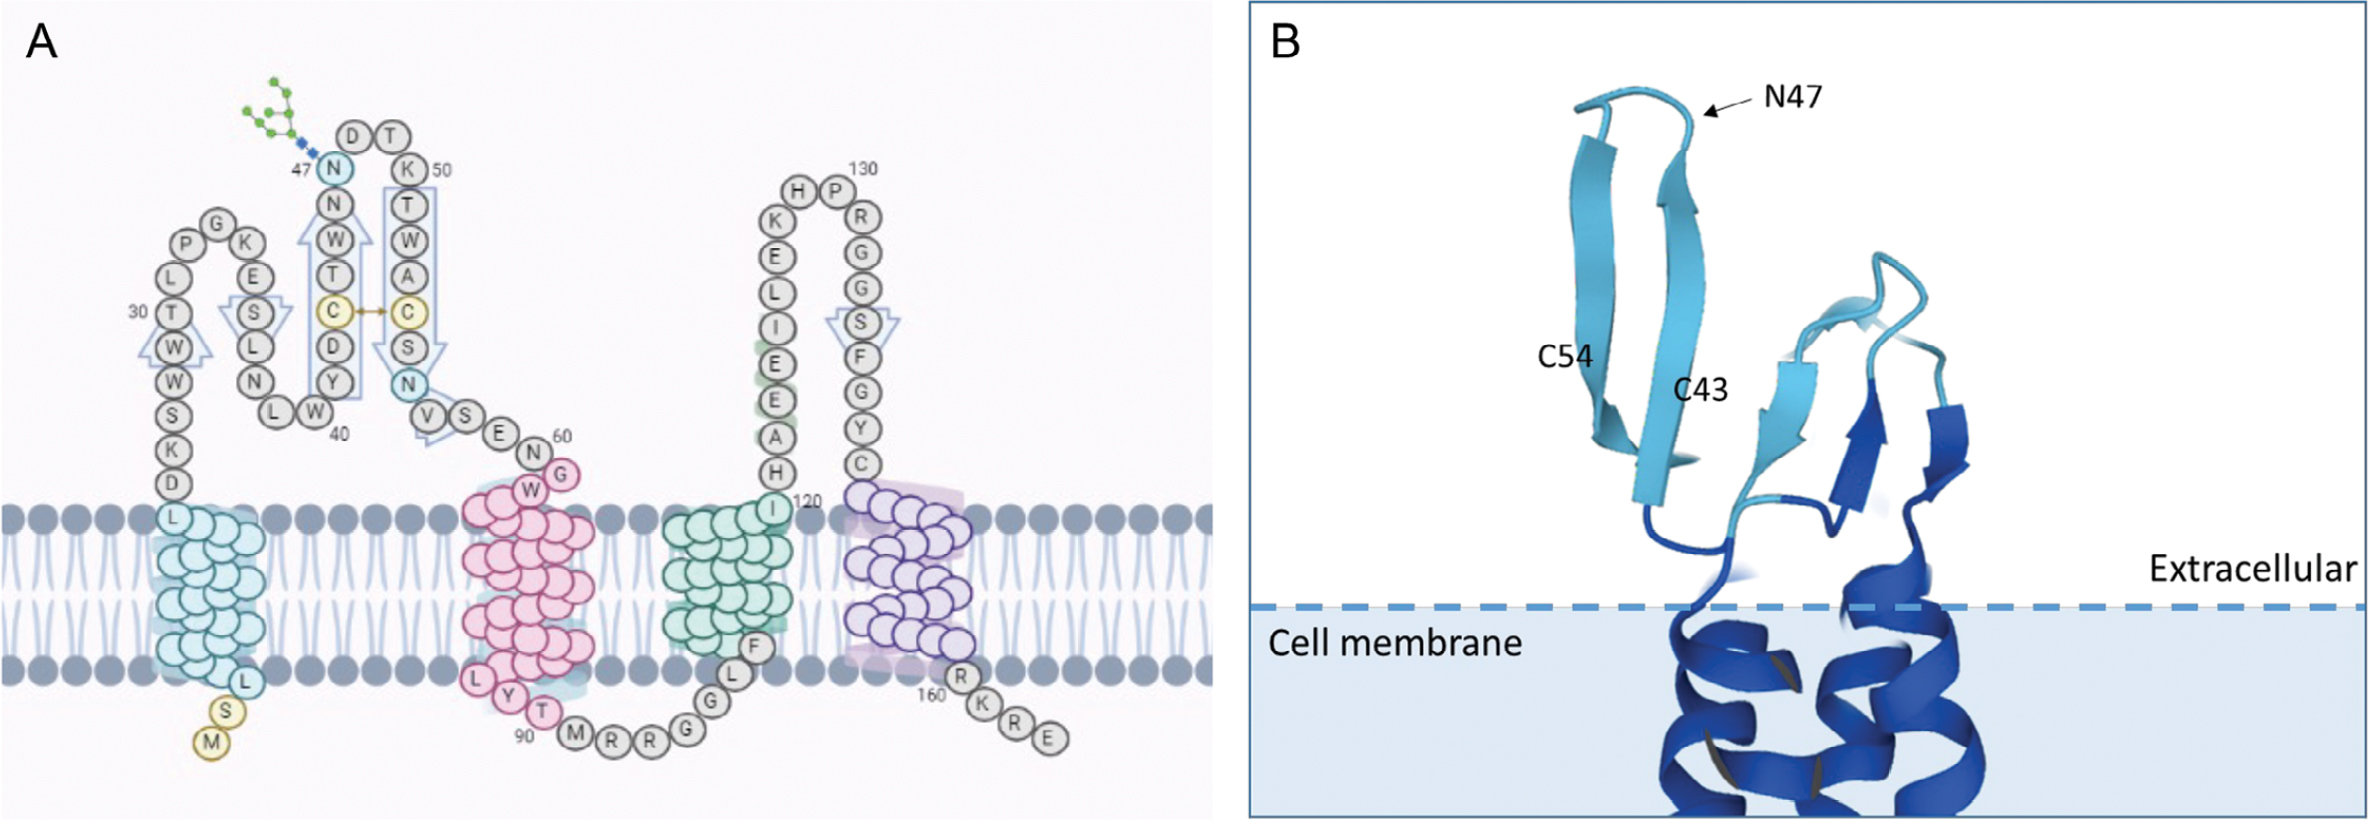
Fig. 1
(A) Schematic of EMP3 structure. Transmembrane domains are symbolized by colored circles. Confirmed N-glycan site (N47) is indicated (image created in BioRender.com). (B) Ribbon diagram of EMP3 extracellular domain. Cysteines believed to form a disulfide bond (C54 and C43) are indicated (generated by Alphafold2).
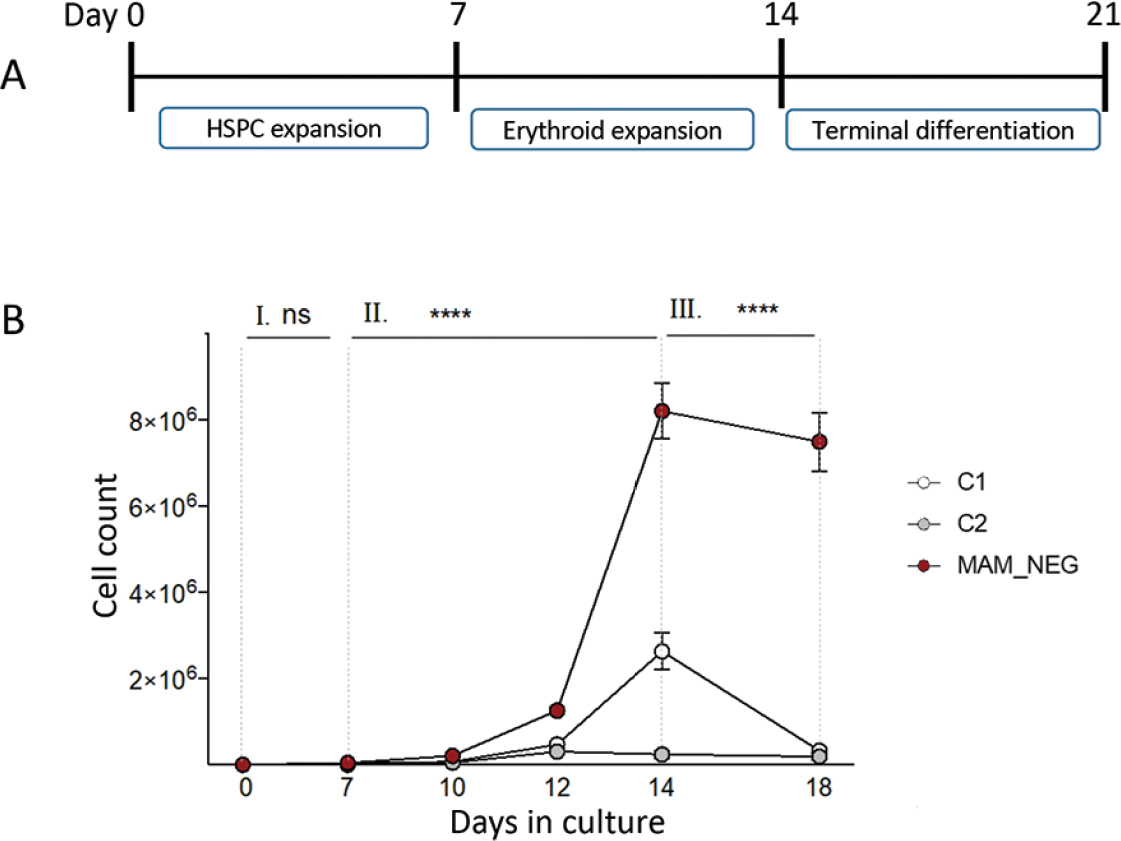
Fig. 2
(A) Timeline and description of the three phases of erythroid CD34+ progenitor cell culture. HSPC = hematopoietic stem and progenitor cells. (B) Cell culture of CD34+ cells from an EMP– individual (MAM_NEG) compared with two EMP+ control subjects (C1 and C2). EMP3– cells show a significantly increased growth during the expansion phase and a greater number of cells at the end of culture. ns = not significant; ****p < 0.0001. (Figure courtesy of Dr. A.G. Alattar, who performed the original experiment.)
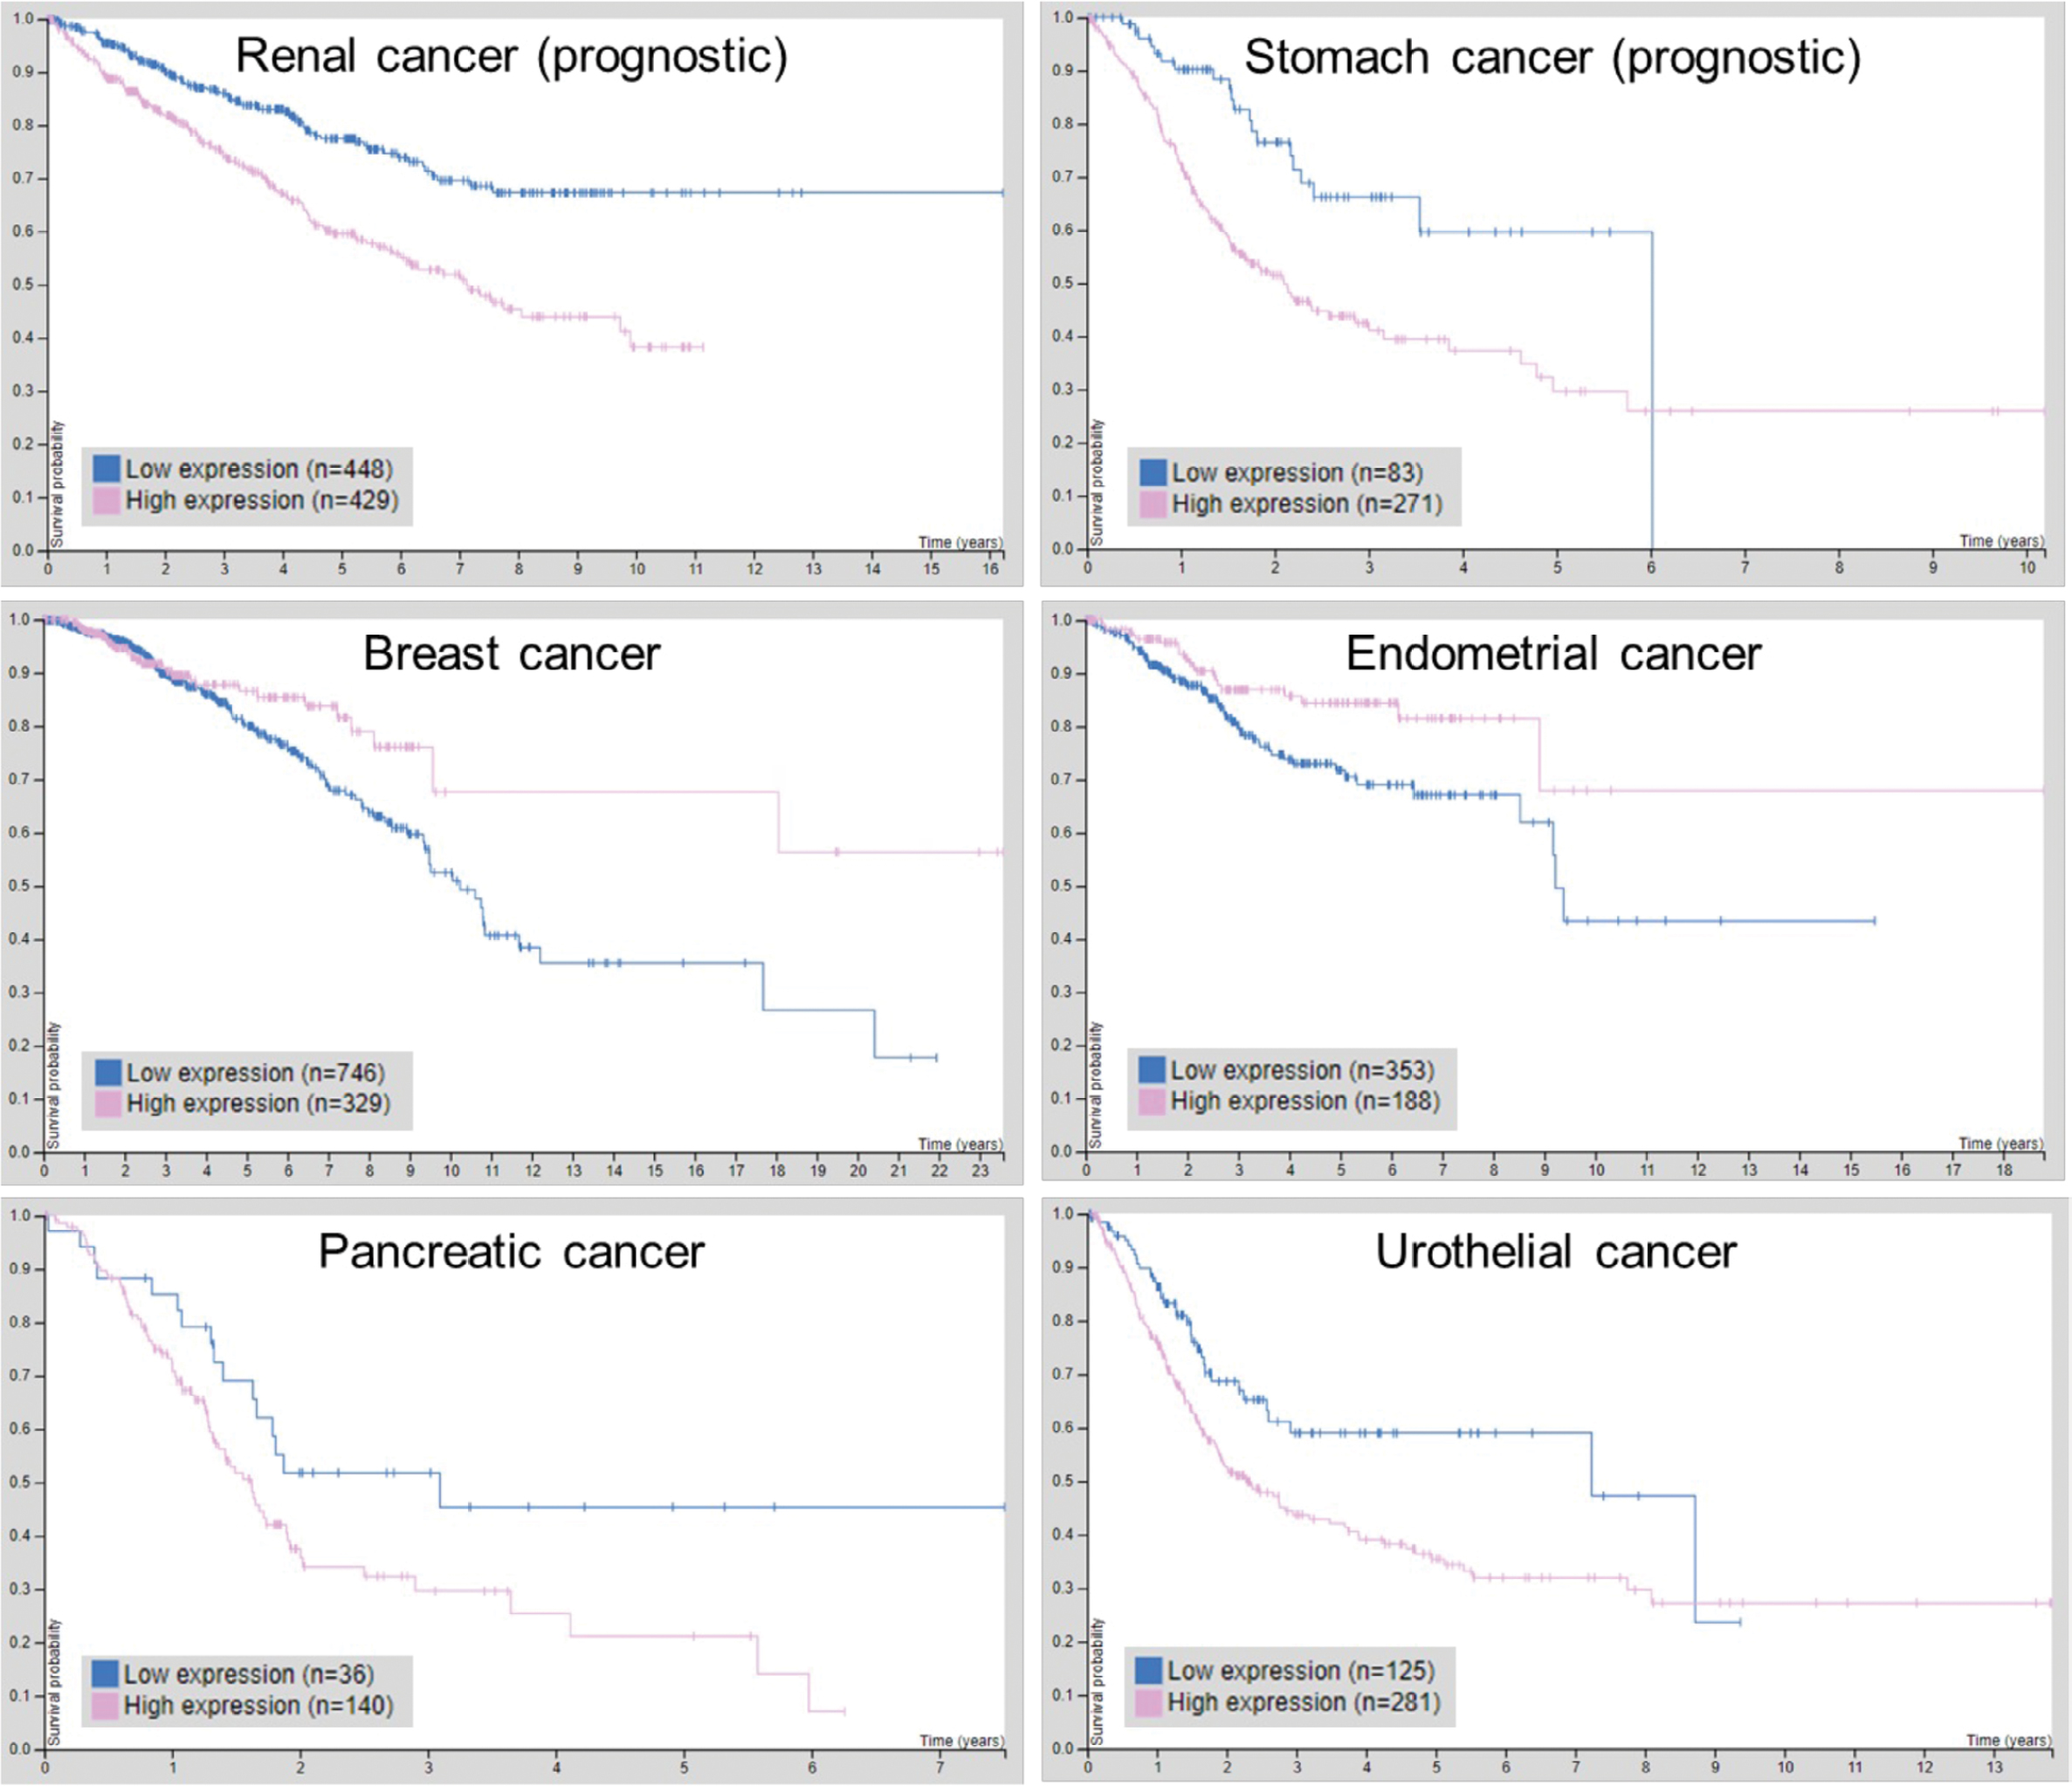
Fig. 3
Examples of Kaplan-Meier plots showing the influence of EMP3 expression on survival probability of patients with various cancers (data from https://www.proteinatlas.org/ENSG00000142227-EMP3, accessed on 5 August 2022). For renal and stomach cancers, EMP3 expression has been determined to be prognostic by the Human Protein Atlas with data from The Cancer Genome Atlas.