The goal of IoV is to allow vehicles to communicate with other vehicles, humans, pedestrians, roadside units, and other infrastructures. Such communications are classified into five categories that are referred to as V2X communication (X: vehicles, RSU, infrastructure, humans, and pedestrians). The vehicles transfer both safety and non-safety data at different data rates. Safety data as an accident, road traffic, and others, while non-safety data such as video streaming, gaming, and so on. Integration of IoV with advanced wireless communication technologies such as 5G makes it a heterogeneous network (Ndashimye et al., 2020). It composes of Wi-Fi, Long-Term Evolution (LTE), and others. In general, vehicle communication is supported for both safety and non-safety data transmissions. The vehicles use dedicated short-range communication (DSRC) which enables low latency communication for short-distance vehicles.
In IoV, vehicles use DSRC for communication; however, due to its shorter range and bandwidth limitations, it is not suitable for long-distance communications and bandwidth greedy applications. Hence, IoV integrates with 5G to provide high data rates for communication. However, it suffers from blockage issues as it is unable to penetrate through obstacles (Choi et al., 2018). Besides, LTE also provides long-distance communication because of its coverage range, and high bandwidth features. Each radio access technology has its benefits and limitations.
Vehicles are equipped with multiple antenna terminals that enable to access different radio access network (RAN). Due to the use of different RAN in a network, a network introduces the process of vertical handover (VHO) (Sheng et al., 2018). 5G comprises different radio access technologies due to the presence of different cells such as microcell, femtocell, and nanocell. Each cell will be having more than one RAN and hence, requires selection of the best network (Jubara, 2020). Several multi-criteria decision-making algorithms have been proposed for network selection. In general, this type of algorithm takes into account multiple parameters and computes them for decision-making. The TOPSIS is one of the decision-making algorithms. This type of multi-criteria decision algorithms is popular in the selection of networks. IoV enables allowing data transmission of the highway and urban roadways in an autonomous vehicle (Storck and Duarte-Figueiredo, 2019). If there is an increase in the vehicle density, then the number of requests from the vehicles for vertical handover will also gradually increase.
The vehicle is built with more than one antenna terminal. The support of different RAN technologies requires selecting a network when one or more RAN is present in the coverage range.
The network selection process is also performed using optimization, reinforcement learning methods, and access network discovery and selection function (ANDSF) (Ndashimye et al., 2020). Q-learning is an algorithm that can decide concerning the environment. In IoV, vehicles move at very high speeds with change in topology and connectivity, the data transmission relies on routing (Ndashimye et al., 2020). Routing is the process of transferring data from source to destination through relay vehicles (Ndashimye et al., 2020). In routing, the vehicles in a route are preferred by taking into account the vehicle-based metrics like traffic, vehicle capacity, reliability, mobility, and others. As per the estimation of the metrics, a route or path is identified and packet forwarding is performed in that route. The process of routing is subjected to some challenges as topology changes, time consumption in route selection, and so on. The algorithms and methods are proposed to solve these challenging issues.
The goal of this paper is to minimize the number of unnecessary handovers when there is a need for high bandwidth while the data type changes. This research builds a learning-based method to decide whether there is a need for handover and then it selects a network for handover. In this way, we can reduce the number of unnecessary handovers. Then, V2V routing is established to minimize the number of re-transmissions. A poor selection of transmission routes causes route failure that leads to an increase in the number of re-transmissions. To solve this issue, an optimization algorithm is used. The two main contributions of our proposed work are to perform handover using network selection and data transmission via the best route.
The rest of this paper is organized as follows: the second section presents the previous research works and methods, the third section gives a particular problem description, and the fourth section discusses the proposed algorithms of handover, network selection, and routing. The fifth section discusses the simulation results, and the sixth section depicts the conclusion with future research directions.
Related work
Prior works on handover
Handover (HO) in the vehicular network is challenging to perform since the mobility of vehicles changes. Many research works have studied this issue and performed handover without any degradation in network metrics. In the study of Chang et al. (2019), a cluster-based handoff, and dynamic edge-backup node (DEBCK) is proposed where the vehicles on the road lane were clustered, and the backup node provides handoff. Here, the cluster head performs the handoff and the backup mobile edge vehicle. The three main parameters that were taken into account for handoff are storage, communication, and energy. The main drawback of this work is poor handoff performance of backup mobile edge and cluster head, and failure to perform handoff whenever there is a need. In the study of Jubara (2020) a procedure for HO was proposed with the aim of minimization of delay in HO. A cross-layer protocol in an adaptive L4 HO procedure begins to estimate signal strength and if the quality of the signal was poor, then the link between user and base station disconnects. Then the Stream Control Transmission Protocol (SCTP) is assigned to the new IP and it is updated to the layers. However, the signal strength was not the only significant metric to make HO decisions. Due to the mobility of the vehicle and moving pattern on the road lane, HO of moving vehicles was proposed (Choi et al., 2018). According to the idea of this work, a group of users consists of a mail leader, sub-leader, and follower. The sub-leader was selected based on the maximum number of connections. In case if more than one vehicle has similar characteristics then, a sub-leader was selected at random. Initially, the vehicle computes reference signal received power (RSRP), reference signal received quality (RSRQ), link quality, and is reported for HO decision. A decision tree was built for HO decision-making using RSRP measurement. But the vehicles HO in a group requires frequent computation in the group, as well as measurement, and hence the computation will be higher in this work. The network layer-based L2 extension HO scheme was proposed (Naeem et al., 2019) and the architecture consists of an access router (AR), roadside unit (RSU), and vehicles. This work defines two HO schemes as inter-AR HO and intra-AR HO. The key goal of this scheme was to minimize latency and improve the packet delivery ratio. A fuzzy logic model and Elman Neural Network (ANN) was designed to decide along with the assurance of QoS (Naeem et al., 2019). For HO decisions, the parameters that are taken into account as cost, transmission range, velocity, load, and capacity. Even though this work performs better, the time for HO decision consumes time which increases the delay in the HO that may cause packet drop and degrades packet delivery ratio. The paper (Singh et al., 2020) concentrates on handover as well as routing. A handoff protocol was proposed that computes link expiration time (LET) for detecting the connectivity between vehicles. The partner selection protocols enable a selection of optimal partner nodes (PN). Initially, the route was determined from GPS information and then the partner in the routes was selected from the vehicular LET using the traffic information. The vehicle with a high LET will be selected as the optimal PN in the route. In this work, only a single metric was taken into account for selecting a route between source and destination. However, if an opposite moving vehicle with high LET cannot be selected as PN and hence it requires considering other parameters too. In the study of Leu et al. (2019), and enhanced Access Network Discovery and Selection Function (ANDSF) was presented to perform a BS selection in the network. This algorithm combines with multilayer perceptron (MLP). The parameters were load, signal strength, throughput, and delay. The traditional workflow of the ANDSF is illustrated in Figure 1.
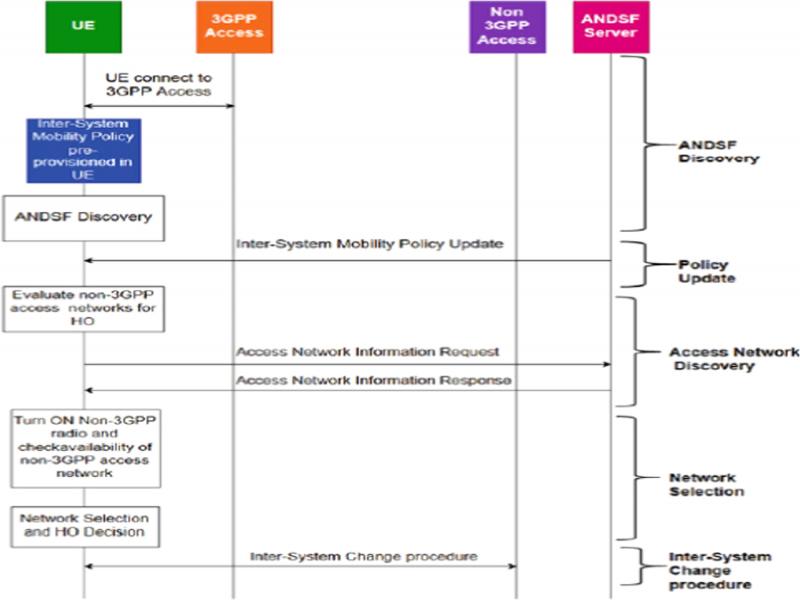
Figure 1:
Workflow procedure of ANDSF (Ndashimye et al., 2020).
The ANDSF was equipped within the EPC which was started to be used in 3G and also on advanced radio access networks. This server was employed to discover information, manage policies, select policies, manage rules, and others. The user equipment can be a sensor, vehicle, or any other device that can access radio technology. The server first discovers the device and then performs a change in the connectivity. The procedure works by the developed set of rules and policies.
The vertical HO was performed using multi-criteria methods by taking into account the significant parameters such as QoS, delay, cost, and others (Hamurcu and Eren, 2020). Due to the consideration of multiple metrics for HO decision using enhanced Technique for Order of Preference by Similarity to Ideal Solution (TOPSIS) fuzzy logic (Embus et al., 2020). The working of this combination of algorithm works as per the following steps:
Step 1: creates decision matrix using the parameters that were involved for HO decision. The computation was executed for each available network in the coverage area.
Step 2: apply the Euclidean distance formula for determining the normalized decision matrix.
Step 3: computation of weighted normalized decision matrix based on the function of the cross product.
Step 4: estimate two ideal solutions as positive and negative from the cost metric. Hereby a set of benefit-based criteria were used for positive ideal solution prediction.
Step 5: again use the Euclidean distance formula and determine the distance value for the estimated ideal solution.
Step 6: compute relative closeness using the determined ideal solution in previous steps.
Step 7: at the end, the ranking was performed from the determined closeness for each network, and based on this ranking, the best network was selected for HO.
The processing steps illustrated above for enhanced TOPSIS using fuzzy were able to overwhelm the problems in conventional RSS-based HO. Each step includes multiple criteria, these steps were not parallel, i.e. on each HO request, all the process requires to be performed and the decision was made after ranking.
Prior works on routing
The IoV environment that uses different types of radio access network due to the coverage range of each radio access. However, the vehicles have in-built DSRC for short-range data transmission, while the destination vehicle moves far from the source, then a route has to be preferred for data transmission.
Vehicles perform routing by selecting relay vehicles between the source and destination since the DSRC range was small and hence it is not able to connect longer distance vehicles. In the study of Nguyen and Jung (2020), Ant Colony Optimization (ACO) algorithm is proposed with the idea of coloring vehicles. This algorithm presents two processes as solution construction and pheromone update. The idea of coloring was to give similar colors for the vehicles that have the same destination. As per the pheromone value, the route was selected in this work. However, this work failed to consider the significant parameters of the vehicles for the computation of the pheromone value that decides the transmission route. In the study of Al-Kharasani et al. (2020), a cluster-based adept cooperative algorithm (CACA) is proposed focusing on the QoS metrics. As per this work, clustering formation is done and a cluster head was selected. This work follows Optimized Link State Routing (OLSR) protocol with the Multi-Point Relay (MPR). This selection takes into account mobility factors, distance range, and quality of path (QoP). The vehicles that satisfy these parameters were selected as MPR and then the intersection vehicles were eliminated. The selection of MPR was not efficient, since the vehicles move at high speed. A protocol design was proposed, i.e. partner selection protocol that considers Vehicle Link Expiration Time (VLET) (Ndashimye et al., 2020). In this work the handoff means a vehicle disconnects from a partner node and joins a new partner node (PN), the partner node enables to perform data transmission. The only measure that was used in the selection of PN was not efficient since there are other significant metrics as signal strength which was also essential in node selection. A cross-layer design was proposed (Leu et al., 2019) that selects an optimal route based on the metrics forwarding probability, bandwidth, and link duration. The forwarding probability for the vehicle was formulated by considering velocity, distance, and communication range. The link duration was mathematically calculated as communication link lifetime that takes into account vehicle velocity, GPS location, and communication range. Then, the third parameter of bandwidth was calculated from link gain, noise power, and channel bandwidth.
The relay node selection was presented in the study of Cao et al. (2019) for relay selection using the estimation of curving rate. A double direction relay node selection was involved when the request to broadcast (RTB) was 1 and then it select relay from the estimation of curving rate, delivery ratio, one-hop delay, and message dissemination speed. The curving rate was formulated from the road length and the range of the vehicle. The computation of each parameter one after the other for route selection was time consuming and it leads to higher packet drop.
Routing is also performed using optimization algorithms. In the study of Leu et al. (2019), a hybrid optimization algorithm is proposed combining monarch butterfly and gray wolf optimization for route selection. The parameters that were taken into account for route selection are different costs computed for congestion, collision, travel, and QoS. For QoS prediction, fuzzy membership functions were applied. Initially, the butterfly algorithm was involved and then the gray wolf was performed for position updates and selecting optimal paths. The traditional issue in gray wolf optimization is its poor performance, and low accuracy. Fuzzy logic was also used to select routes by estimating link quality and achievable throughput. The link quality was based on the position, direction, and expected transmission count. As per the fuzzy weight, the output of the selection of next hop relay was performed. However, this work failed to tolerate the mobility issues concerning vehicular communication.
Problem definition
Issues concerning handover, network selection, and routing are discussed in this section from the previous research works. In the study of Ndashimye et al. (2020), the author proposed reinforcement learning algorithms. TOPSIS, K-Nearest Neighbor (K-NN), and AHP are proposed for handoff decisions considering bandwidth, network cost, preferences, connectivity probability, and signal to noise ratio (SNR) as the evaluation metrics.
TOPSIS algorithm are subjected to rank reversal problem that either includes or eliminates the order of preferences. Besides this problem, it performs poorly to make vertical handover decisions.
The handover is performed by the vehicle based on the ranking results the vehicle. However, the need for handover is not evaluated. Also, if all the vehicles requests for handover then TOPSIS had to perform the handover individually since the parameters differs for each vehicle.
The use of k-NN for handover decisions was not efficient, since the k-NN algorithm gives higher accuracy in results only when the link quality was better. Also while the arrival of data was in large amount then the algorithm slows down to process and hence it takes time to make handover decisions.
The data forwarding through these two metrics is not sufficient, since there may be a blockage that causes NLOS issues. This issue was common in mmWave and hence vehicle parameters are essential to be considered while making forwarding decisions.
The use of AHP was not efficient since it requires training of the data and then it can select the best path. But here as per the current situation of the vehicles the path needs to be selected and also the movement of vehicles will not be the same in all the regions. Also, the addition of new criteria was difficult in this algorithm.
Several algorithms have been proposed for the process of routing. Dijkstra algorithm and random relay selection are proposed for routing and data forwarding (Cao et al., 2019). QoS parameters are computed and estimated for the selection of routes. Since the movement of vehicles is dynamic and so, the management of the topologies is achieved by constructing the graphs.
The major problems identified in routing are as follows:
The graph parameters are completely based on the past transmission history of the vehicles and the transmission of the vehicles depends on the channel metrics. Using these metrics, the graph was not able to predict the signal strengths with its neighboring vehicle. Consequently causing frequent handover.
The maintenance of graphs is complex due to mobility concerns, hence it needs large resource blocks and dynamic processing to manage the graph.
The random selection of radio networks with individual parameters may leads to poor performance of networks since the main constraints of QoS in this work is bandwidth or delay, i.e. it considers anyone from this, and hence the network selection is poor.
All of the above-highlighted gaps concerning handover, network selection, and routing are addressed in our proposed work.
Proposed system
This section is broken down into four sub-sections to describe the environment and expand each algorithm concerning handover, network selection, and routing in this proposed research work.
System model
The proposed heterogeneous IoV network is designed with vehicles consisting of a 5G base station, LTE base station, RoadSide Unit (RSU), and vehicles. The entities that participates in this system are defined below.
Definition 1: Vehicle – the vehicle moves on a restricted path, i.e. on-road lane in which the path is pre-defined in a map. The moving speed of the vehicle depends on the vehicle. Vehicles have in-build GPS, using which their latitude and longitude information is gathered. The location of the vehicle and the speed of the vehicle is dynamic. Vehicles use DSRC and other advance Ran for data transmission. It transmits safety and non-safety data.
Definition 2: RSU – RSU is employed in IoV for performing communication with the infrastructure. This entity is static in the environment and also it enables DSRC for vehicles.
Definition 3: 5G mmWave base station (BS) – the BS is static and this allows to perform high speed–short-range communication. It can solve the lack of spectrum issue.
Definition 4: LTE BS – this BS is also static and it allows long-distance communication with higher bandwidth and comparatively high spectrum efficiency.
The proposed system model is depicted in Figure 2, which composes all the above-defined entities into the system. The road lane has ‘n’ number of moving vehicles in their direction on the road. In this work, the handover is a decision that will be taken by the vehicle only when the current base station link is not good. But in case of sudden need in transmitting a safety application, it makes network selection process at that moments along with the consideration of data type as one of the parameters. Handover decision is the decision by which the need for handover is determined and it performs handover to the available network. For handover decision dynamic Q-learning in which the threshold is set as per the environment. If the handover has to be performed, it then selects a network from fuzzy-convolution neural network (F-CNN). For network selection, the fuzzy rules are defined and used in CNN. Then routing takes place by using an optimization algorithm called jellyfish algorithm that selects V2V pairs between source to destination and so, it is called V2V chain routing.
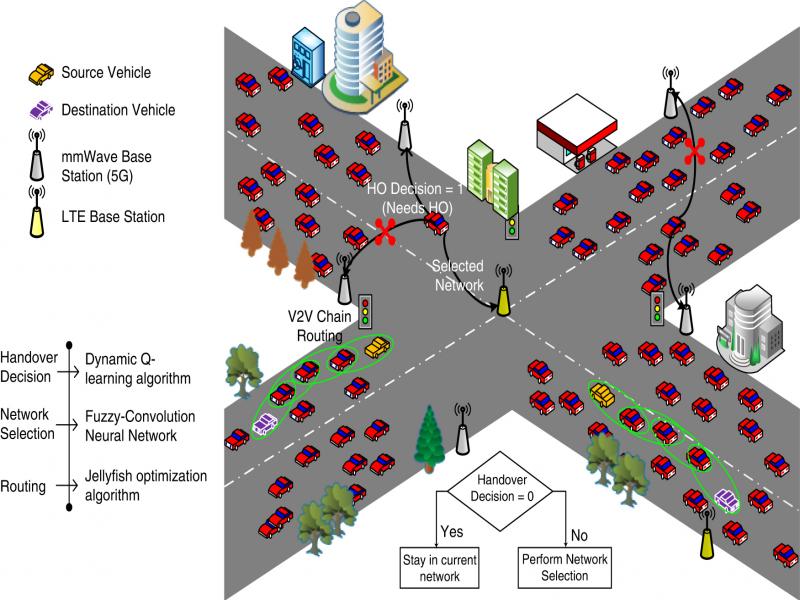
Figure 2:
Proposed system model.
Handover decision
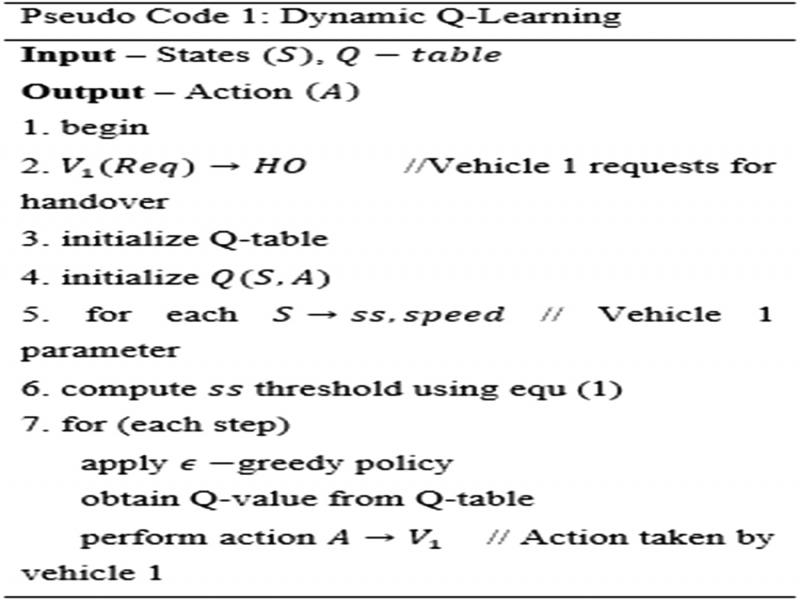
Handover decision by dynamic Q-learning, the dynamic means to use threshold concerning the available network. Dynamic Q-learning algorithm determines the need for handover by evaluating vehicle speed and signal strength. We set the threshold for signal strength using Shannon entropy rule as shown in the following equation:
(1)where S(ss) denotes the Shannon entropy for signal strength that composes of values for DSRC, mmWave, and LTE that range between (‒30 to ‒70 dBm). P(ss) denotes the probability of the signal strength (Figure 3).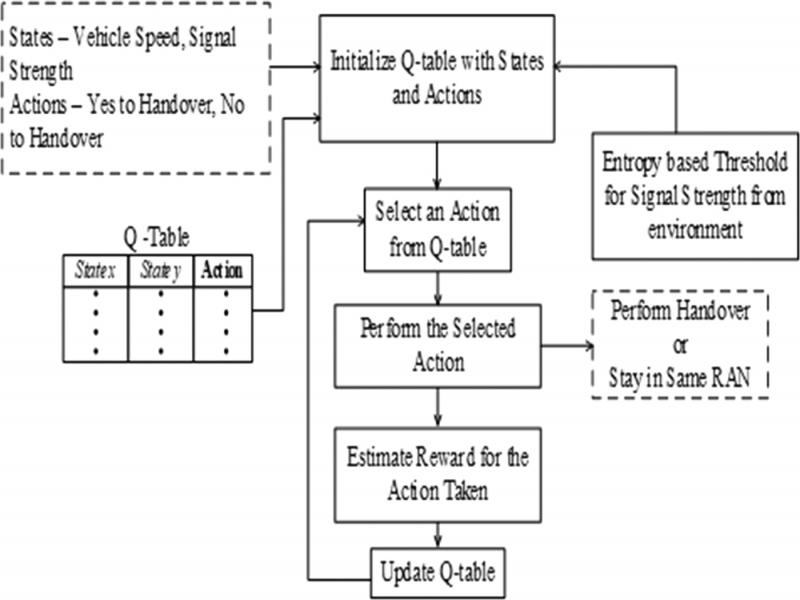
Figure 3:
Workflow of dynamic Q-learning.
Let Q(S,A) represent state and action based on the Q-values. Each state S will have two parameters and this Q(S,A) is determined and updated in the rule. The temporal difference update rule is as follows:
The term Q(S΄,A΄) defines next state and action is the reward given by the agent, is the discount factor that is [0–1], then is the learning rate [0–1], i.e. it denotes the step length to estimate the (S,A). The action is taken using ϵ-greedy policy where ϵ represents epsilon. The pseudo-code for dynamic Q-learning is given below to decide the decision for handover:
Network selection
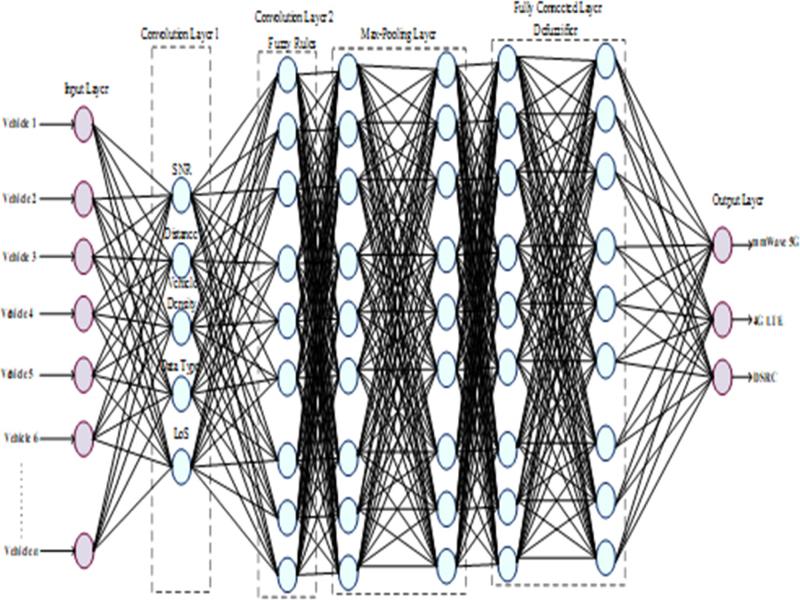
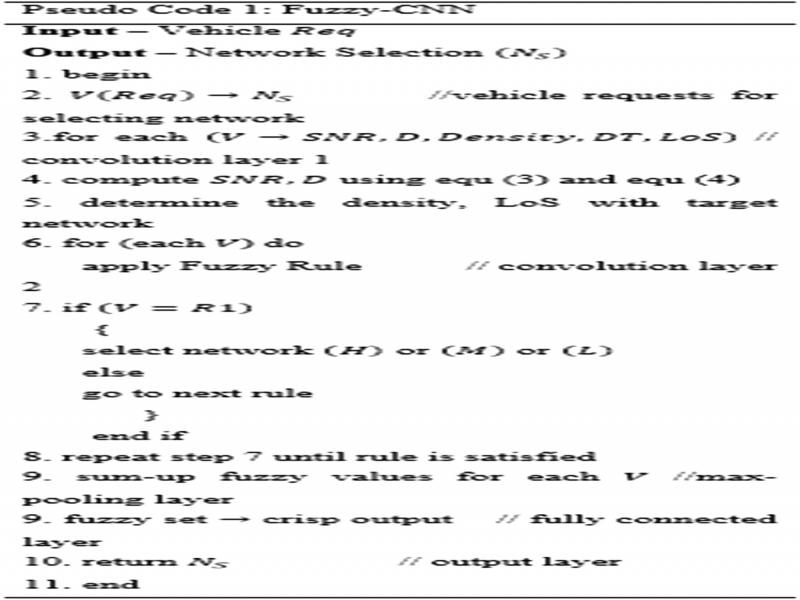
Network selection is the process of selecting a network from the available RANs. F-CNN algorithm is applied for network selection. The CNN is designed with layers of convolution, max-pooling, and fully connected layers. The layers are employed with fuzzy rules that are defined from the metrics signal strength, the distance between BS and vehicle, vehicle density in serving BS, data type (safety or non-safety), and line of sight. The definition for each metric is depicted below.
Definition 1: Signal strength – signal strength defines the SNR which gives the number of signals. A channel will compose noise as well as signal, the high the noise, the channel is unfit for transmission. The SNR (Sr) is determined from signal power Ps, and noise PN respectively. The formulation is:
Definition 2: Distance between BS and vehicle – the distance between BS and a vehicle is estimated using Euclidean distance. This measure defines the stability of the link, as the distance increases the link will be unstable and when the distance decreases the link will be stronger. Euclidean distance is computed using the following equation:
For computing distance, the coordinate points of the BS and vehicle is used. Distance is determined from the BS location coordinates of (x,y), and vehicle location coordinates of (x1,y1), respectively. The location of BS is fixed and so it requires to know only the vehicle coordinate for distance estimation.
Definition 3: Vehicle density – the density of vehicle VD denotes the number of vehicles that are connected with that particular BS.
(5)where NCL and NNL represents the number of connected links and number of new links.Definition 4: Data type – the data type in vehicles are two, they are safety and non-safety. In this work, safety is denoted as 0 and non-safety as 1. The safety messages will be of traffic information, high-speed vehicle information. This type of data has a higher priority in transmission than the non-safety data.
Definition 5: LoS – line of sight defines the direct contact between the vehicle and BS without any obstacles that block the signals. For transmission, LoS is only preferred and the signals in Non-LoS are not preferred.
The above five metrics involve the development of fuzzy rules. The fuzzy logic deals with the decision-making by the defined rules as shown in Table 1. The mmWave signals will be chosen for any type of traffic, but only when the LoS is present since blockage of mmWave leads to poor performance, in case of blockage the vehicle selection will be 4G LTE.
Table 1.
Fuzzy rules.
| Input | ||||||
|---|---|---|---|---|---|---|
| Rule number | Sr | Distance | VD | Data type | LoS | Output |
| R1 | H | H | H | H | H | H |
| R2 | H | H | H | H | L | H |
| R3 | H | H | H | L | H | M |
| R4 | H | H | H | L | L | M |
| R5 | H | H | L | H | H | H |
| R6 | H | H | L | H | L | M |
| R7 | H | H | L | L | H | L |
| R8 | H | H | L | L | L | M |
| R9 | H | L | H | H | H | H |
| R10 | H | L | H | H | L | L |
| R11 | H | L | H | L | H | L |
| R12 | H | L | H | L | L | L |
| R13 | H | L | L | H | H | H |
| R14 | H | L | L | H | L | M |
| R15 | H | L | L | L | H | L |
| R16 | H | L | L | L | L | M |
| R17 | L | H | H | H | H | H |
| R18 | L | H | H | H | L | L |
| R19 | L | H | H | L | H | H |
| R20 | L | H | H | L | L | M |
| R21 | L | H | L | H | H | H |
| R22 | L | H | L | H | L | H |
| R23 | L | H | L | L | H | L |
| R24 | L | H | L | L | L | L |
| R25 | L | L | H | H | H | H |
| R26 | L | L | H | H | L | M |
| R27 | L | L | H | L | H | L |
| R28 | L | L | H | L | L | L |
| R29 | L | L | L | H | H | M |
| R30 | L | L | L | H | L | M |
| R31 | L | L | L | L | H | L |
| R32 | L | L | L | L | L | L |
| Parameter | Range/Value | |||
|---|---|---|---|---|
| Simulation area | 2,500 m × 2,500 m | |||
| Number of vehicles | 100 | |||
| Number of 5G mmWave BSs | 2 | |||
| Number of 4G LTE BSs | 2 | |||
| Vehicle mobility type | Linear mobility | |||
| Vehicle speed | 10-40 m/s | |||
| Transmission range | ||||
| DSRC | 300 m (Max) | |||
| mmWave | ~500 m | |||
| LTE | 100 km (Max) | |||
| Transmission rate | 3-5 packets per second | |||
| Packet size | 512 bytes | |||
| Simulation time | 1,000 sec | |||
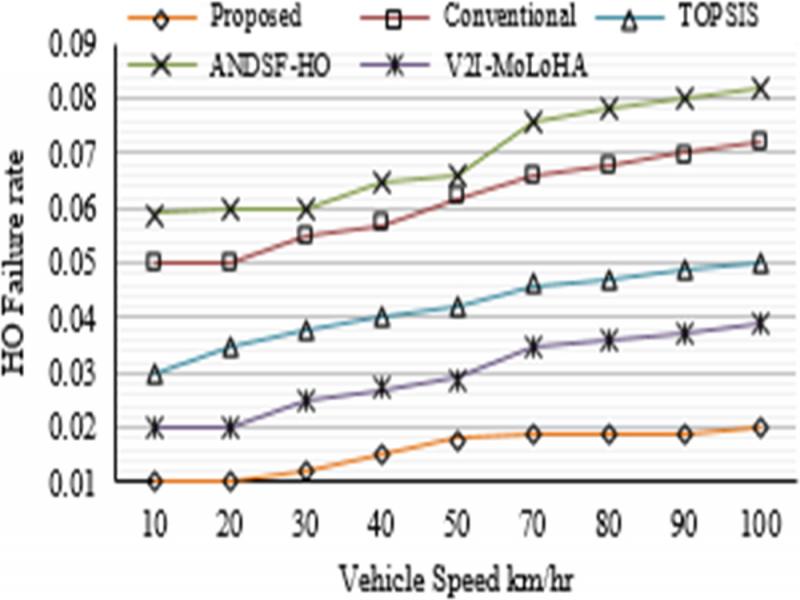
| Method | Average number of HO | Better efficiency | Average HOFR | Better efficiency |
|---|---|---|---|---|
| Conventional | 5.51 | 55% | 0.133 | 90% |
| TOPSIS | 2.15 | 20% | 0.041 | 40% |
| ANDSF-HO | 3.57 | 30% | 0.069 | 60% |
| V2I-MoLoHA | 3.03 | 25% | 0.029 | 20% |
| Proposed | 1.30 | – | 0.01 | – |
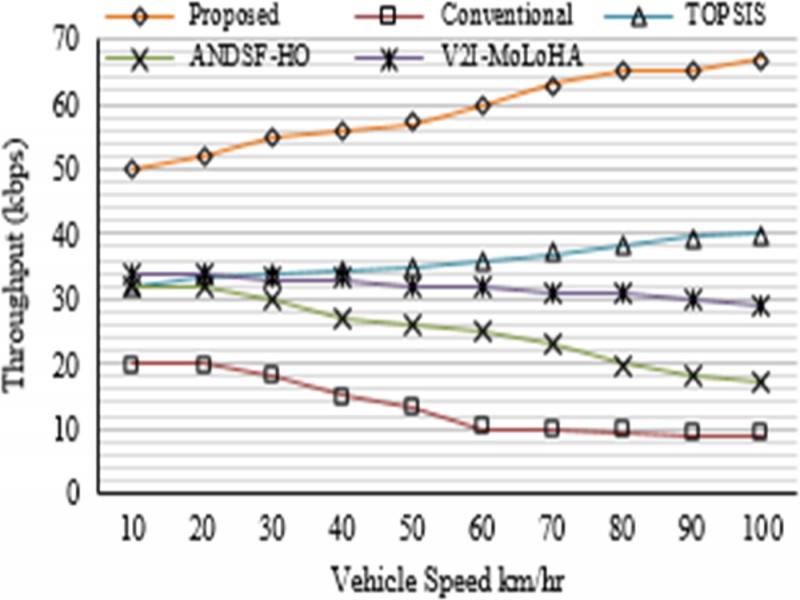
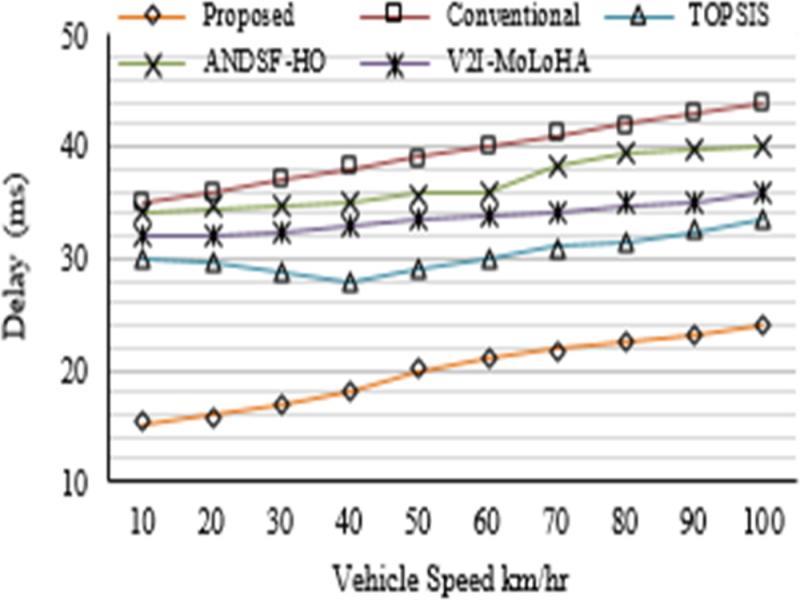
| Method | Mean (kbps) | Better efficiency | Average delay (ms) | Better efficiency |
|---|---|---|---|---|
| Conventional | 13.7 | 46% | 39 | 21% |
| TOPSIS | 35.96 | 23% | 30 | 12% |
| ANDSF-HO | 25 | 34% | 37 | 19% |
| V2I-MoLoHA | 31.89 | 27% | 34 | 16% |
| Proposed | 58.89 | – | 18 | – |
| Method | Packet loss (%) | Better efficiency |
|---|---|---|
| Conventional | 48 | 21% |
| TOPSIS | 32.4 | 12% |
| ANDSF-HO | 24 | 19% |
| V2I-MoLoHA | 18.8 | 16% |
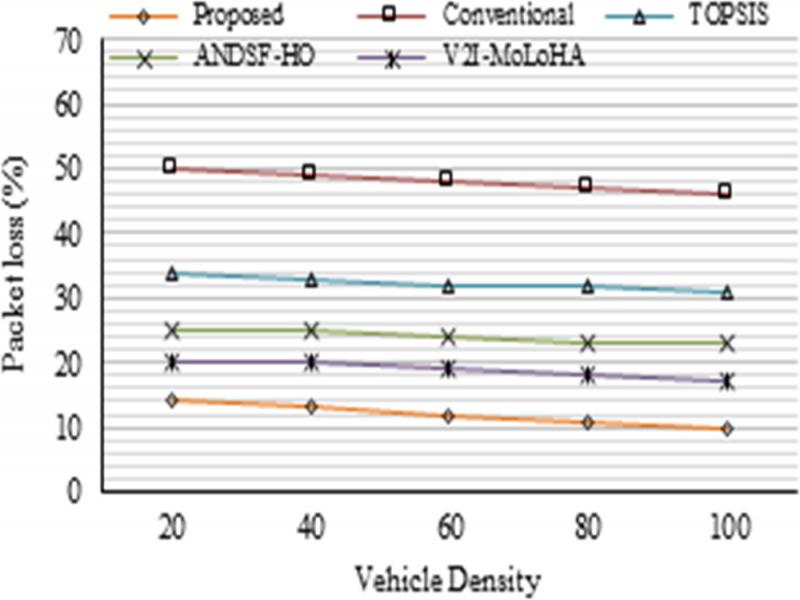
| Proposed | 12 | – |