
Introduction
Nowadays, multimedia presentations are becoming more and more important particularly because our world is increasingly digitized and always connected. Multimedia presentations may include different modalities that may range from simple text, audio, speech, sound, images, to more complex content such as touch sense and smell (Rahayu, 2011).
Visual-based multimedia presentations aim at reconstructing visual information that corresponds to the perception of the human visual system (HVS). Recently, high dynamic range (HDR) imaging is considered as one of the technological advances that can accomplish this purpose (Narwaria et al., 2015). Ideally, HDR imaging requires special tools, devices, and processing pipelines that are different from those used for today’s ordinary image processing in dealing with low dynamic range (LDR)/standard dynamic range (SDR) images.
However, considering the prevalence of today’s conventional imaging technology, HDR can also take advantage of SDR/LDR image processing methods. For example, this can be seen from the rise of smartphone and DSLR cameras in the past few years that can be used to capture HDR-processed images (Kundu et al., 2017a, b; Mantiuk et al., 2016). HDR images obtained in this way are usually created using the inverse tone mapping operator (ITMO) and multi-exposure fusion (MEF) methods because these two methods can produce images in a very wide range of lighting conditions (Azimi et al., 2015). These two methods were found to be able to process images that can produce visual information that has a range similar to that of the HVS. In addition, the resulting HDR images processed by these methods can also look natural, more attractive and informative, and can even reduce the noise level that may have been in the image (Kundu et al., 2017a, b; Ma et al., 2015; Rovid et al., 2007; Varkonyi-Koczy et al., 2008).
The development of HDR technologies will certainly require a special image quality assessment (IQA) method that is tailored to the characteristics of the HDR images. HDR technologies place more challenges on quality measurement methods due to the very high sensitivity of the HVS to errors and distortions on the images. IQA algorithm usually plays an important role in the image processing pipeline (Opozda and Sochan, 2014; Zhu et al., 2018a, b). It also aims that the quality measured consistently reflects the perceived quality of the image by the HVS.
There are two broad categories of image quality measurement methods, namely subjective and objective measurement methods. Subjective image quality measurement is considered the most reliable method because it directly involves human viewers in carrying out the quality evaluation of the images displayed. This method can represent how human visual systems’ perception responds to given visual stimuli. Unfortunately, there are major drawbacks for subjective methods: it is quite expensive to be done consistently, and it requires a lot of time to implement. Therefore, objective image quality measurement methods that do not involve human viewers have increased quite rapidly.
Based on the availability of original images used as a reference for quality measurements, objective image quality assessment can be classified into three categories: full-reference (FR), no-reference (NR), and reduced-reference (RR) methods. For conventional LDR/SDR images, a wide variety of FR, RR, and NR objective measurement methods have been around over the past few years. For HDR images, however, many have developed FR/NR methods but very few or even less have done the same thing for the RR method.
On the contrary, the use of the RR method to measure the quality of visual services by utilizing reduced information, under current conditions when video streaming services are on the rise, for example, can be very useful for service providers such as telcos or ISPs in monitoring the quality of their products. Or on the other hand, clients can ensure that the quality of service they receive is really as promised by the content provider.
Considering the various explanations that we have given above, this paper will provide a review of the objective quality evaluation method for HDR images. The presentation of this paper will be organized as follows. In the following sections, we will briefly describe the HDR image processing flow in general. Subsequently, an explanation about the image quality assessment method will be given in the third section, which will be followed in the fourth section by a further explanation of some of the HDR image quality measurement models found in the literature. Our concept of quality assessment for HDR images in a reduced-reference fashion is outlined in the fifth section. Finally, this paper will conclude with some closing remarks in the sixth section.
HDR imaging
HDR imaging pipeline
An illustration of HDR image formation and processing is given in Figure 1. In this illustration, it shows how HDR images are acquired from the source, processed by encoding/decoding methods involving data compression techniques, and then displayed and evaluated for their quality (Artusi et al., 2017; Mantiuk et al., 2016). First of all, HDR images can be produced either by a camera capturing objects from the real world or by computer graphics that create a model-based image. After that, the HDR images can be compressed and encoded so that they can be stored or transmitted more efficiently, by converting the image data format so that it requires less storage capacity or less bandwidth for transmission. Subsequently, the images can be displayed in various types of display devices, either natively or using conventional LDR/SDR display devices.
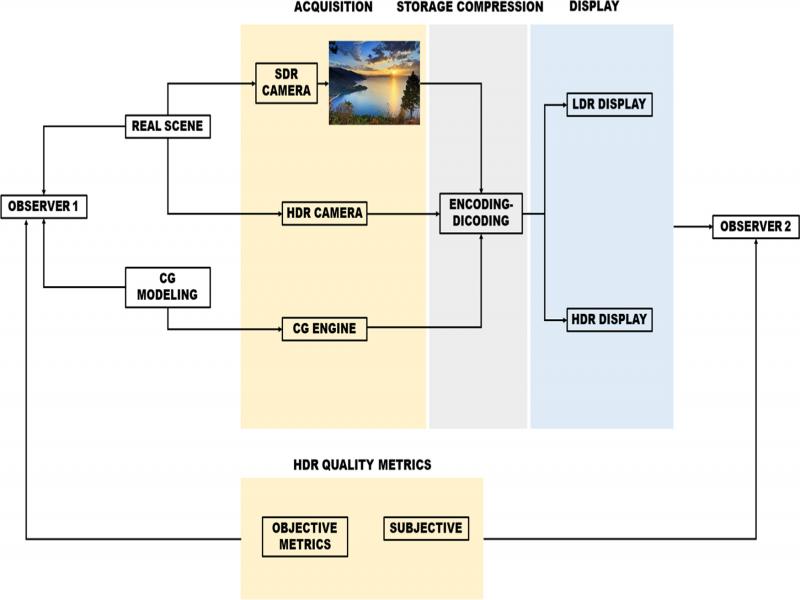
Figure 1:
HDR imaging pipeline; redrawn from Artusi et al. (2017) and Mantiuk et al. (2016).
The display of HDR image content is still largely limited by the capabilities of the display device used. For devices with lower specifications to display HDR images properly, a tone mapping method that can capture the wider dynamic range of HDR images and convert them into a narrower dynamic range on conventional devices is needed. The color correction method can also be employed to resolve any mismatch between HDR content and the capabilities of the display devices. On the other hand, there is also an inverse tone mapping algorithm which can be used to reconstruct HDR content from a single SDR image or the multi-exposure image fusion (MEF) method which is able to produce HDR content from a combination of several SDR images with different exposure.
Last but not least, HDR image quality assessment is performed with the main objective to assess the various algorithms used in the pipeline.
HDR creation
Methods of constructing HDR images using MEF and ITMO have been widely described in previous studies that can be found in the literature.
MEF can be categorized as a method of combining images that has been introduced since the 1980s, but recently it has received more attention for further research (Gu et al., 2012; Li et al., 2012; Song et al., 2012; Zhang and Cham, 2012). Since humans act as users for most applications that apply MEF methods, these methods require an easy and simple but reliable quality assessment (Shen et al., 2013; Song et al., 2012; Zeng et al., 2014). A list of MEF-based methods that are relevant to the HDR image construction is given in Table 1.
Table 1.
Summary of MEF-based HDR images.
| Paper | Method | Strength | Weakness |
|---|---|---|---|
| Ma et al. (2015) | Multi-exposure fusion algorithm | Well correlates with subjective judgments and significantly outperforms the existing IQA models for general image fusion | Cannot apply on a various image content |
| Rovid et al. (2007) | Gradient-based synthesized multiple exposure | Produces good quality HDR images from a series of poor quality photos taken by various exposures | Cannot apply on a colored image |
| Varkonyi-Koczy et al. (2008) | New multiple exposure time image synthesization technique | High-quality color HDR image which contains the maximum level of details and RGB color information | The current implementation of the proposed method is limited to process static scenes |
| Gu et al. (2012) | Fused gradient field | This method is efficient and effective | Existing algorithms can only be used for small movements |
| Li et al. (2012) | New quadratic optimization | Can enhance fine detail to produce sharper images as existing high dynamic range imaging schemes | Saturation images sometimes reduced by using both proposed exposure fusion schemes |
| Song et al. (2012) | New probabilistic exposure fusion scheme | New approach is advantageous compared with representative existing tone mapping operators | Rating and ranking are not suitable because both are too complex for an observer |
| Shen et al. (2013) | A novel fusion algorithm based on perceptual quality measures | Experiments demonstrated better performance of proposed algorithm compared to other methods | It is relatively difficult to extend these metrics to cases with several image sources |
| Goshtasby (2005) | Fuse multi-exposure images of a static scene taken by a stationary camera | It has no side effect and the local color and contrast in the input will not change | Select images to be mixed, the right size must be used to fuse the image |
| Mertens et al. (2009) | Fuse a bracket exposure sequence | Comparable to the existing tone mapping operator | Unoptimized implementation of software performs fusion of exposure within seconds |
| Yun et al. (2012) | Single exposure-based image fusion using multi-transformation | Shows a more visually pleasing output with the perceptually increased dynamic range | – |
| Huang et al. (2018a, b) | A new color multi-exposure image fusion | Successfully producing a better color display from the image blends and more texture details than other existing exposure fusion techniques | Based on the proposed approach, MEF cannot yet combine dynamic multi-exposure images and eliminate them |
| Kinoshita et al. (2018) | A new multi-exposure image fusion method based on exposure compensation | Better than other methods in terms of TMQI, statistical naturalness and discrete entropy | It is unclear how to determine appropriate exposure values, which are difficult to set at the time of photography |
| Paper | Method | Strength | Weakness |
|---|---|---|---|
| Larson et al. (1997) | Tone reproduction curves (TRC) | Performs well on a wide category of images | Produced a visual accurate images but not enhanced images |
| Reinhard et al. (2002) | Zone system and Automatic dodging and burning | Well-suited on a across-the-board of HDR images | This method only brought textured areas within range which is categorized simple |
| Durand and Dorsey (2000) | Extended version of Ferwerda et al. (1996) | Solve interesting problem in TMO | This system is slower than its state-of-the-art method |
| Fattal et al. (2002) | A gradient-based tone mapping operator | Able to compress a very wide dynamic range, present every details and less common noise or artifacts | Does not enhance global features |
| Mantiuk et al. (2006) | Contrast mapping and contrast equalization | Provide a high visual quality output with appealing brighness and contrast even no artifacts | Does not run in real-time application and does not include color in information |
| Qiu et al. (2006) | Optimized tone reproduction curve (TRC) | More simple than the previous, faster in time consuming and easier to implement | Weak at destroying spatial details |
| Eilertsen et al. (2015) | A real-time noise TMO | Minimize the contrast disortions, control the perceptibility of noises and adjust to a provide and shifting light, also can be apply in real-time | Lack in scenery creation and best subjective score |
| Rana et al. (2019) | SVR | Gained a consistent result under complex real-world ilumination transitions | The execution time are the longest among the-state-of-the-art |
| El Mezeni and Saranovac (2018) | Local tone mapping | Present details and good local and global contrast of proceed images also better result in overall image quality | Produce a little amount of noise |
| Paper | Method | Advantage | Drawback |
|---|---|---|---|
| Huang et al. (2018a, b) | False contour candidate in HEVC | Detecting very noticeable, remove and preseving texture and details | false remove false contour in larger sized |
| Ahn and Kim (2005) | Flat-region and bit-depth extension | Removes false contour effectively and preserving sharpness | Cannot remove the local holelike pattern effectively |
| Lokmanwar and Bhalchandra (2019) | Gaussian filter and spectral clustering | Enhancing peak level and smoothing direction | Contour detection only generates only around a strong boundary |
| Manno-Kovacs (2019) | MHEC (Harris for edge and corners) point set | Handle complex contour, ability for multiple object detection | Iterative active contour still slower than other method |
| Chua and Shen (2017) | CNN patch-level measurement | No need precisely predict boundary pixel | At large texture regions still erroneous |
| Paper | Method | Description | |
|---|---|---|---|
| van Dijk et al. (1995) | Category scaling | Numerical category scaling techniques provide an efficient and valid way to get a compression ratio versus a quality curve and to assess the image quality perceived in a much smaller way | |
| Th. Alpert (CCETT) and J.-P. Evain (EBU) (Alpert and Evain, 1997) | SSCQE and DSCQE | SSCQE to evaluate subjective quality, while the DCSQE is used to maintain image quality and information transmitted | |
| Sheikh et al. (2006) | Double stimulus | The experiment used a double-stimulus methodology to measure quality more accurately for realignment purposes | |
| Redi et al. (2010) | SS and QR | Single stimulus (SS) method presents several weaknesses. Quality ruler (QR) method is worth implementing efforts from the point of view of consistency and repetition of scores | |
| Mantiuk et al. (2012) | Force-choice pairwise comparison | The forced-choice pairwise comparison method results in the smallest measurement variance and thus produces the most accurate results. This method is also the most time-efficient, assuming a moderate number of compared conditions | |
| Persson (2014) | QR | The difference in assessment in the study seemed to be significantly dependent on the perceived similarity between the ruler image and the test image | |
| Nuutinen et al. (2016) | Dynamic reference | The DR method is very suitable for experiments that require very accurate results in a short time because the DR method is more accurate than the ACR method and faster than the PC method | |
| Zhu et al. (2018a, b) | AIT inspired MOS and PC | Using arrow’s impossibility theorem (AIT) proves that the meeting between unanimity and independence of irrelevant alternatives (IIA) will produce an ‘important subject’, which in fact determines the final rating of image quality |
| Authors | Methods | Databases | Metrics |
|---|---|---|---|
| Mantiuk et al. (2011) | Full-reference error metrics | LIVE, TID2008 | HDR-VDP-2 |
| Yeganeh and Wang (2013) | Full-reference, tone-mapped images, multi-scale SSIM | Own dataset (Yeganeh and Wang, 2013) | TMQI |
| Ma et al. (2015) | Full-reference, MEF images | Own dataset (Ma et al., 2015) | MEF-IQA |
| Kundu et al. (2017a, b) | No-reference, natural scene statistics | ESPL-LIVE | HIGRADE |
| Jia et al. (2017) | No-reference, DL, convolutional neural networks with saliency maps | LIVE and CSIQ (SDR) | DL-NRIQA |
| Guan et al. (2018) | No-reference, tensor space, image manifold | Publicly available dataset | TDML with SVR-based |
| Ravuri et al. (2019) | Convolutional neural nets, SVM, tone mapping, deep no-reference tone-mapped image quality assessment, NRIQA | ESPL-LIVE and Yeganeh | RcNet |
| Yue et al. (2020) | Feature extraction; support vector machines; tone-mapped HDR; multi-exposure fused images; no-reference (NR); colorfulness, exposure, naturalness | Publicly available dataset | SVM-based features |
| Duan et al. (2020) | Local dimming algorithms, image contrast ratio, subjective, objective | Fairchild’s | BLD algorithms |
| Fang et al. (2020) | MEF algorithms; objective quality model; reduced ghosting artifacts; Heuristic algorithms; structural similarity | Own dataset and Mantiuk’s MEF deghosting images | MEF-SSIM_d |
| Kim and Kim (2020) | Convolutional neural nets; learning-based RTM scheme; low-complexity reverse tone mapping | Own dataset | RTM Scheme, HDR-VQM |
| Jiang et al. (2020) | Entropy; feature extraction; support vector machines; colorfulness index; tone mapping operators; luminance partition; NRIQA | TMID and ESPL-LIVE | SVR-based |
| Ellahi et al. (2020) | HMM, TMO, FR | ETHyma | HMM-based similarity measure |
| Krasula et al. (2020) | TMO, FR, NR, feature naturalness, structural similarity, and feature similarity | Yeganeh, Cadik, and TMIQD | FFTMI, based on SS-II, FN, and FSITM |
| Wang et al. (2021) | NRIQA, tone-mapped images | TMID and ESPL-LIVE | SVR-based with RBF kernel |
| Fang et al. (2021) | NRIQA, tone-mapped images, gradient, chromatics, statistics | ESPL-LIVE | VQGC |
Full-reference model
There are several FR (full-reference) models for HDR image quality assessment; for example Duan et al., (2020), Krasula et al. (2020), Ma et al. (2015), Mantiuk et al. (2011), Yeganeh and Wang (2013).
HDR visual difference predictor (HDR-VDP) and HDR-VDP-2, proposed by Mantiuk et al. (2005) and its successor, (Mantiuk et al., 2011), are FR methods based on error metric. The metric uses various visual models based on contrast sensitivity in diverse lighting conditions. The models were also tested against psychophysical measurements to select the best parameters that can be adjusted with the data. Some feature invariant metrics based on structural similarity was also employed by this model.
Tone-mapped quality index (TMQI), proposed by Yeganeh and Wang (2013), is an objective quality evaluation on tone-mapped images in an FR framework. This method combined multi-scale capability of structural similarity measure (SSIM) (Wang et al., 2003) with a measure of naturalness. The SSIM in TMQI is used to evaluate the structural weaknesses across images, based on contrast, lighting, and local structure. Naturalness is based on statistics of thousand images portraying various types of natural scenery. These two parameters are then combined in a certain ways similar to a weighted sum of each parameter by taking into account sensitivity of each parameter to the overall quality.
MEF-IQA, proposed by Ma et al. (2015), is an FR method specialized for MEF-based images. It also uses multi-scale structural similarity, but now combined with structural consistency. It works by adapting HVS to extract structural information from natural images. MEF algorithms can use MEF-IQA to tune the parameters for the MEF. MEF-IQA also came with its own subjective data for their evaluation. The dataset consists of 17 original pictures that are subjected to various exposure levels. There are classical and sophisticated MEF algorithms being used to create the resulting MEF images.
Another FR model of HDR image quality assessment is local dimming algorithms (Duan et al., 2020). This method is a full-reference quality assessment technique that is applied to a number of backlight local dimming (BLD) algorithms. BLD algorithms are usually used to improve image contrast ratio and provide power efficiency for modern displays. The paper also offers a subjective evaluation procedure on each BLD generated images in which subjects must submit rank of these images based on their most natural looking.
Features fusion for natural tone-mapped images quality evaluation (FFTMI) (Krasula et al., 2020) is another method of tone-mapped HDR image quality assessment based on carefully selected perceptual relevant features. The features are combined in a linear fashion to avoid over fitting of the model when combined using a machine learning technique. Features are grouped into several categories, based on the availability of the reference image/feature. From an FR model, they used contrast/structure similarity and locally weighted mean phase angle (LWMPA) similarity measures. On the hand, from an NR model they took contrast, colorfulness, sharpness, aesthetics, saliency, and any other estimators not belonging to any previous categories. Based on their selection procedure, they came up with FFTMI metrics derived from FR TMQI-II structural similarity, FR feature similarity index for tone-mapped image (FSITM), and NR feature naturalness.
In the study of Ellahi et al. (2020), the hidden Markov model (HMM) as a test of similarity to assess TMO perceived quality is proposed. The findings suggest that the proposed HMM-based method that emphasizes temporal information yields better evaluation metrics than traditional approaches based solely on visual-spatial information.
No-reference model
As can be seen from Table 5, there are more NR models than FR models available in the literature; for example Guan et al. (2018), Kundu et al. (2017a, b), Ravuri et al. (2019), Yue et al. (2020), among others.
Blind high dynamic range image quality assessment using deep learning (DL-NRIQA), proposed by Jia et al. (2017), is a no-reference image quality assessment (NRIQA) method by combining deep convolutional neural networks (CNNs) with saliency maps on high dynamic range (HDR) images. Similarly, the HDR image GRADient evaluator (HIGRADE) is an NR model proposed by Kundu et al. (2017a, b). It is based on bandpass standard measurement in addition to natural scene statistics (NSS). NSS descriptors are employed to construct features. It works by an assumption that HDR process usually alters the image gradient NSS feature. The discrepancy can be used by the model to infer quality predictions.
In the study of Ravuri et al. (2019), a no-reference quality assessment technique for tone-mapped images was proposed. The method consists of two stages. In the first one, it uses convolutional neural network (CNN) to produce a distortion map from the tone-mapped images. In the second stage, the distortion map is modeled using an asymmetric generalized Gaussian distribution (AGGD). The quality score is then estimated based on the AGGD parameters with a help from SVR (support vector regression) method. The distortion map can also be used as features to estimate the quality index of tone-mapped images.
The method presented in the study of Yue et al. (2020) is proposed to use multiple quality-sensitive features for both MEF and ITMO-based HDR images. The features are based on colorfulness, exposure, and naturalness. The metrics is developed in the absence of any reference images. SVR is used to bridge the extracted features and the associated subjective ratings for the quality model.
In the study of Fang et al. (2021), a robust visual blind quality evaluation method for analyzing the visual characteristics of TMI using gradient and chromatic statistics (VQGC) is proposed. The method is motivated by the perception mechanism that the human visual system (HVS) is sensitive to image structures variation. They used the magnitude of the gradient to predict structural distortion accurately, the orientation to measure the variation of the image structure, and the magnitude and orientation of the relative gradients to capture microstructural changes. They also used color invariant descriptors to capture visual degradation of colors with local binary patterns (LBP) on four colored feature maps. Subsequently, the final quality conscious feature vector is obtained from the amalgamation of gradient and chromatic features, which is applied to assess the perceived quality of TMI by supporting vector regression (SVR).
Proposed method framework
Motivation
We can see from the previous section that for HDR imaging, there are numerous FR/NR methods, whilst none so far for RR. On the contrary, for LDR/SDR images there have been plenty of FR/NR/RR methods for quite some time, such as illustrated in the research roadmap in Figure 2. Therefore, our present study will focus on the investigation of the reduced-reference objective quality evaluation for HDR image. In particular, we are interested in the investigation of usable features for the RR model.
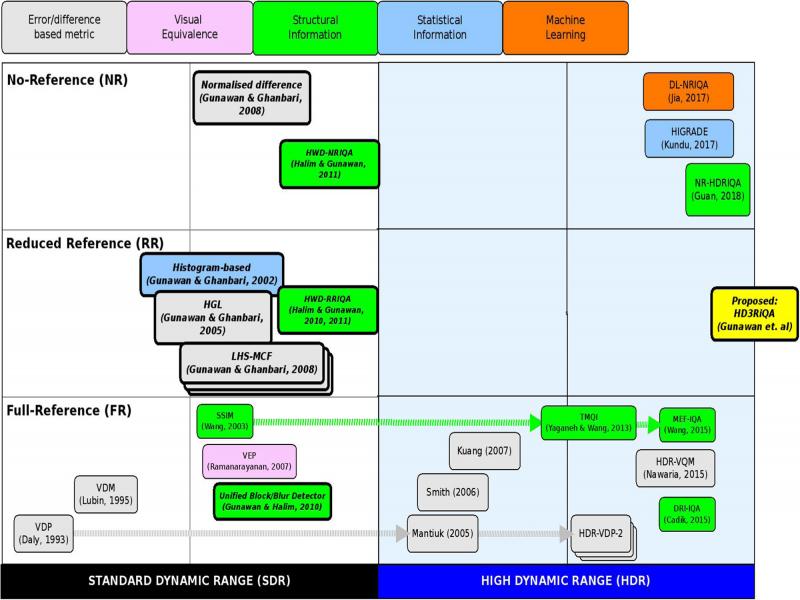
Figure 2:
Our proposed research road map.
Based on the research roadmap, we use a framework like the one given in Figure 3. Our proposed method uses a simple feature based on some derivatives of gradient image (for example, edges, false edges, or contour) for the RR feature. Features made with the framework as described in Figure 3 can be built not only by utilizing edge strength, but also can use false contour/edge map information, histograms, or local features in the desired image area (region of interest, ROI) with certain criteria. As part of the RR feature, we may use false edge/contour map which is extracted from the luminance image. Therefore, the color image that is used in the process must first be converted into a gray scale image before subsequent steps.
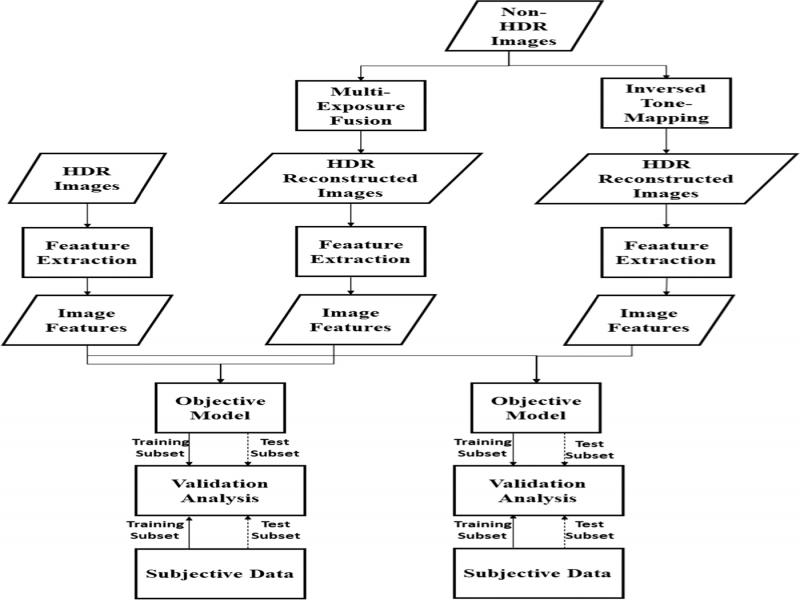
Figure 3:
Research framework for current proposed method.
We noted that similar features based on gradient have been used in previous works on HDR-related quality evaluation reported by others, but only in a full-reference or no-reference framework. In our present study, we would like to investigate how this simple feature can be adopted for RR feature in an HDR-related quality assessment framework.
We are interested in this feature because we noted that there are notable changes on the edges of the generated HDR image based on MEF and ITMO. This, for example, is illustrated in Figures 4 and 5, where we have an original image in HDR format and its associated global-adjusted MEF-based processed image, taken from the dataset (The University of Texas at Austin, 2006). By comparing these figures we can see that global brightness of the processed image is shifted compared to that of the original one. This is also reflected in the global shift of their histograms. The gradient images also show that there are differences between that of the original and the processed one in terms of strength and thickness. Histograms of gradient, on the other hand, exhibit little differences; they only demonstrate some minor changes.
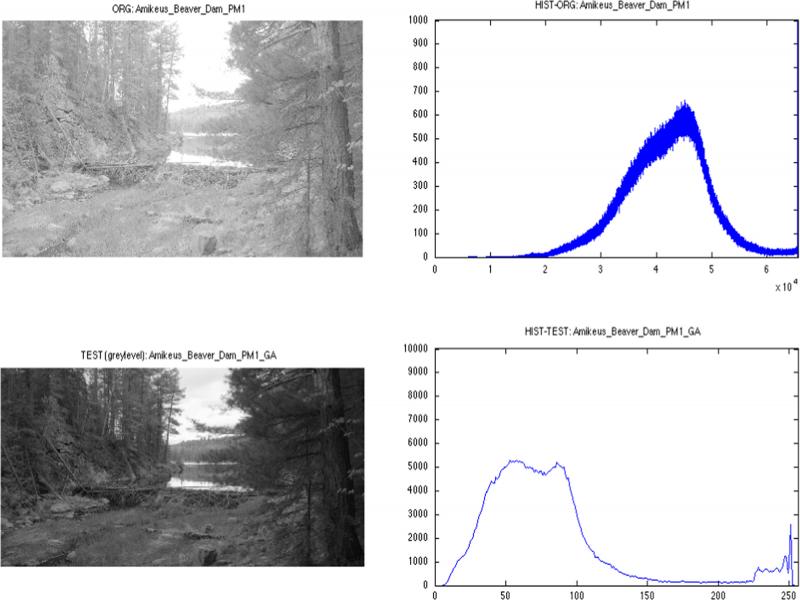
Figure 4:
Original and test/processed images and their histograms from the dataset. The test images were processed using global adjustment method.
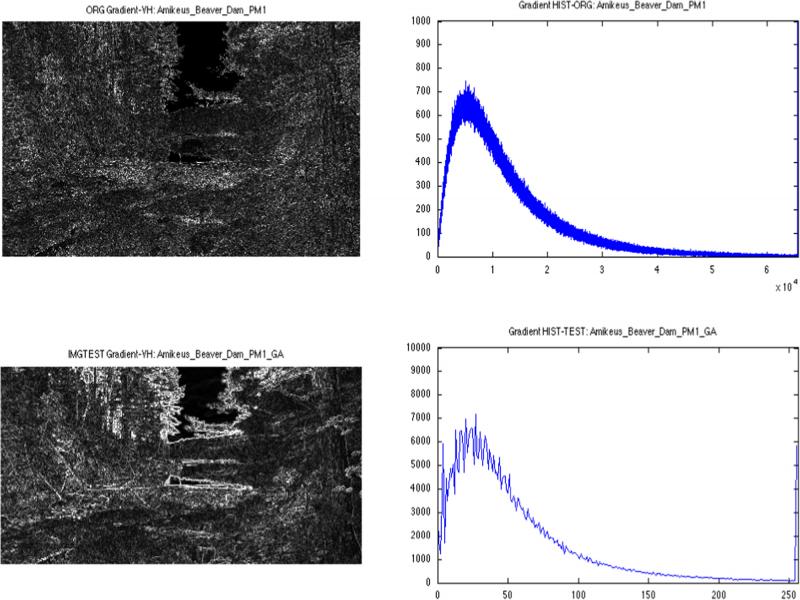
Figure 5:
The gradient of the original and test/processed images and their histograms. The test images were processed using global adjustment method.
Therefore, it is reasonable that the reduced-reference approach presented in this paper makes use of relative comparison of the derivatives of gradient images. For example, by comparing the false edge/contour map (FCEM) of a processed image (due to MEF or ITMO, for example) with the gradient image derived from the reference image that we assume contains no artifacts or distortions, one may be able to estimate the quality of the processed image relative to the reference image. Any discrepancy in the processed image will be shown by an increase or decrease in FCEM strength/magnitude.
Conclusions
We have reviewed various HDR image quality assessment methods in the literature and found that many have focused on the development of the FR and NR models. From these models, there are several perceptual attributes that can be beneficial for quality assessment purposes: contrast, details, color, and artifacts. Many algorithms also use natural statistics descriptor, feature naturalness, and feature similarity, which lend themselves to the use of no-reference method. However, we believe that RR model is also useful for several application scenarios, notably for monitoring purposes. Therefore, development of RR model is still considered necessary. In line with that argument, we have initiated research on the development of RR model for HDR IQA, using a research roadmap presented in Figure 2. Some of our preliminary results using feature based on a simple calculation on the images were also given in the previous section, and the result shows that the proposed method is promising although there is still room for further improvement.
Acknowledgements
The author would like to thank the Indonesian Ministry of Research and Higher Education for the funding of the research presented in this paper under the contracts No. 225/SP2H/AMD/LT/DRPM/2020 and No. 83.ADD/LL3/PG/2020, and Universitas Bakrie, Indonesia, under the contracts No. 087/SPK/LPP-UB/III/2020 and No. 107/SPK/LPP-UB/III/2020.