
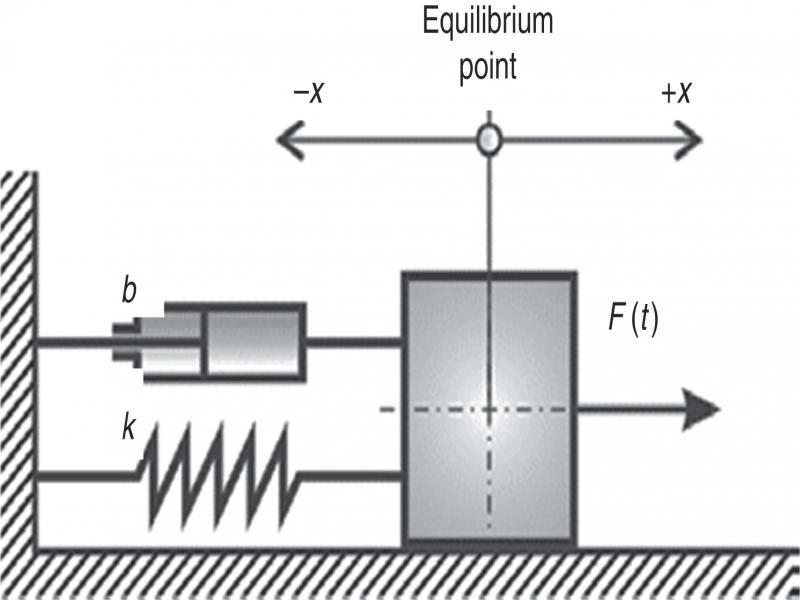
Figure 1:
SDOF mechanical system.
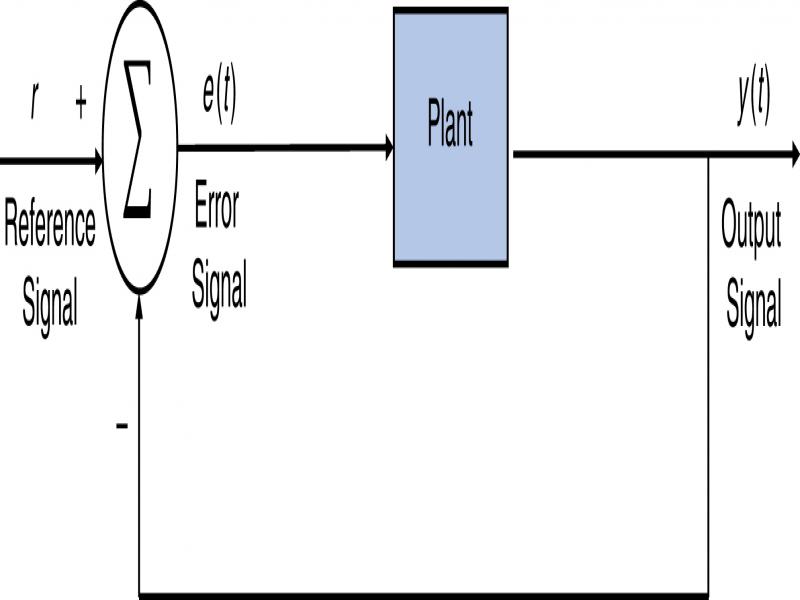
Figure 2:
MSDS without controller.
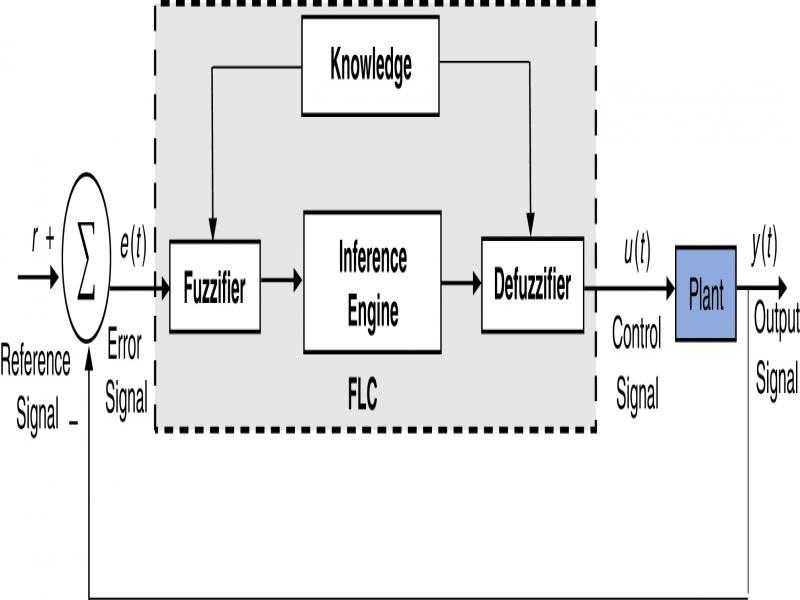
Figure 3:
MSDS with FLC.
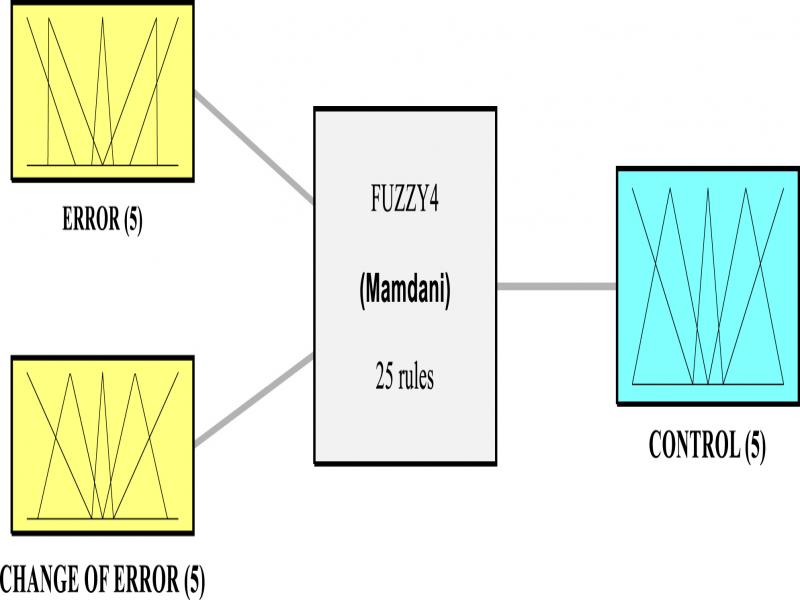
Figure 7:
Output variable.
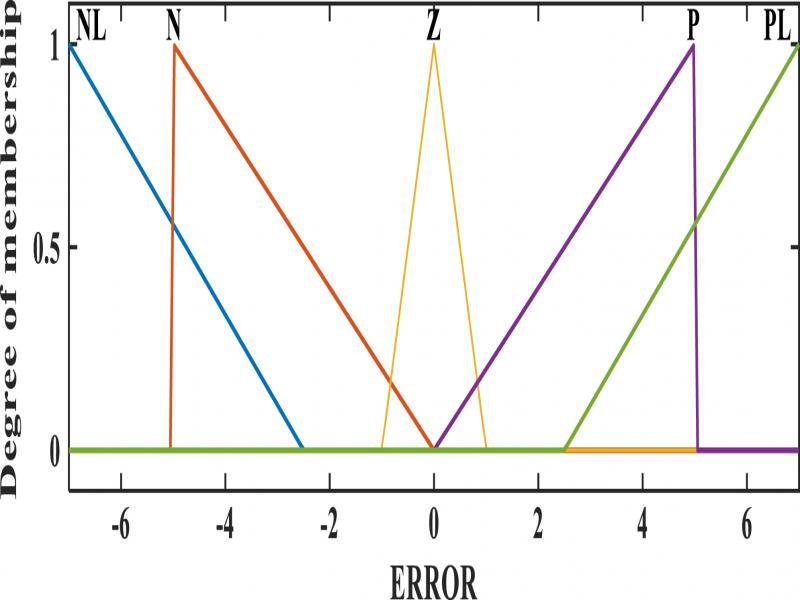
Figure 4:
FIS (fuzzy inference system).
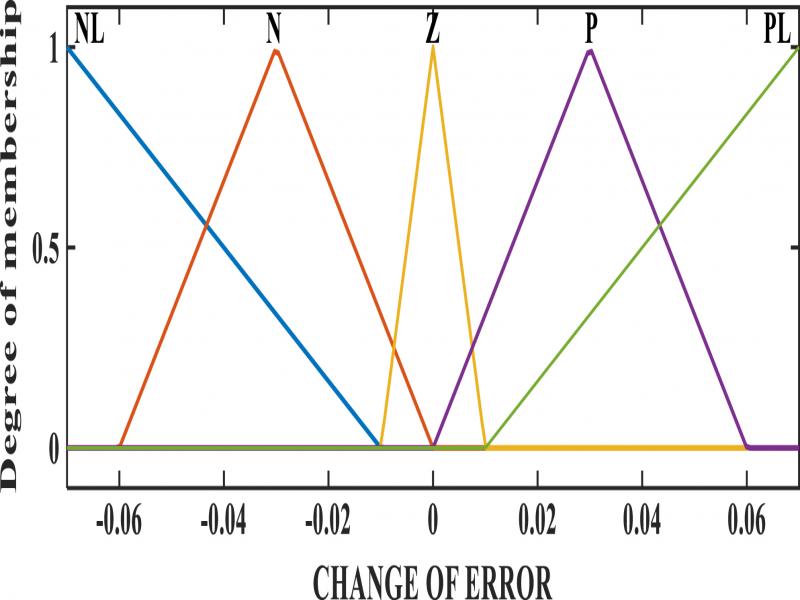
Figure 5:
1st input displacement (error) variable.
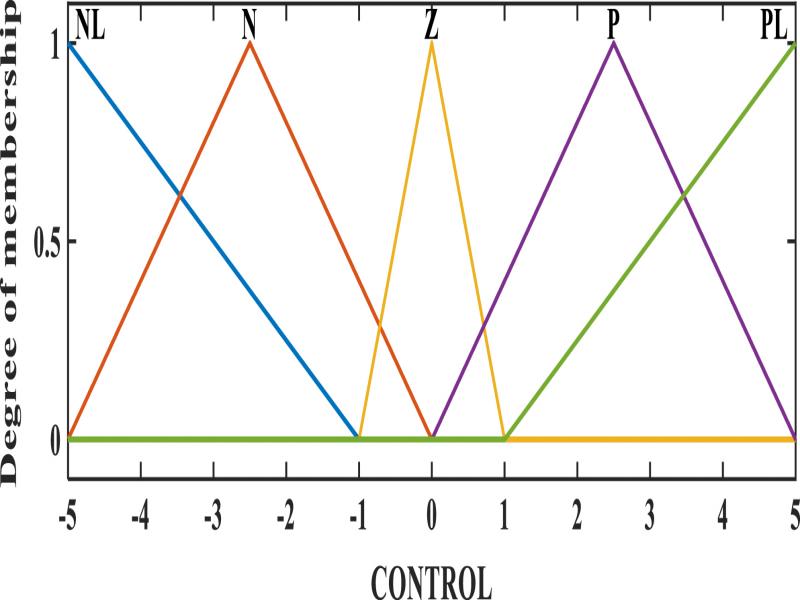
Figure 6:
2nd input velocity (change in error) variable.
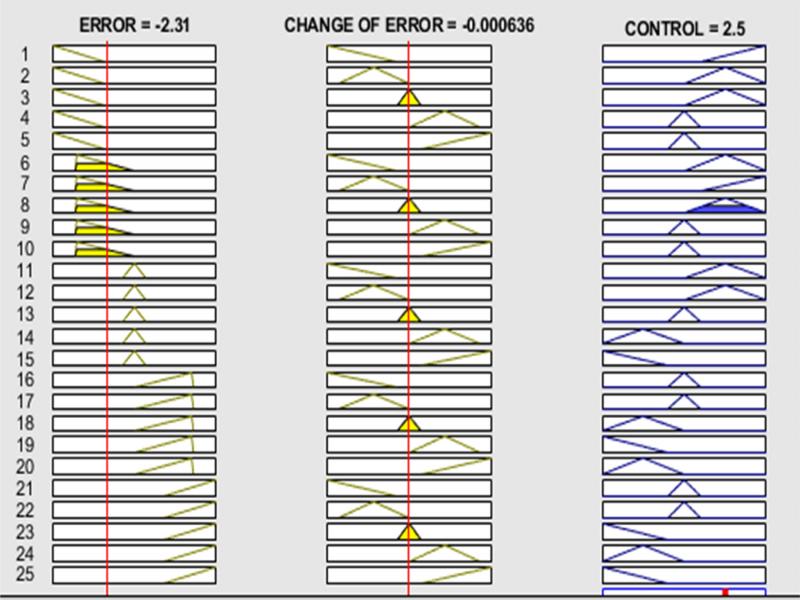
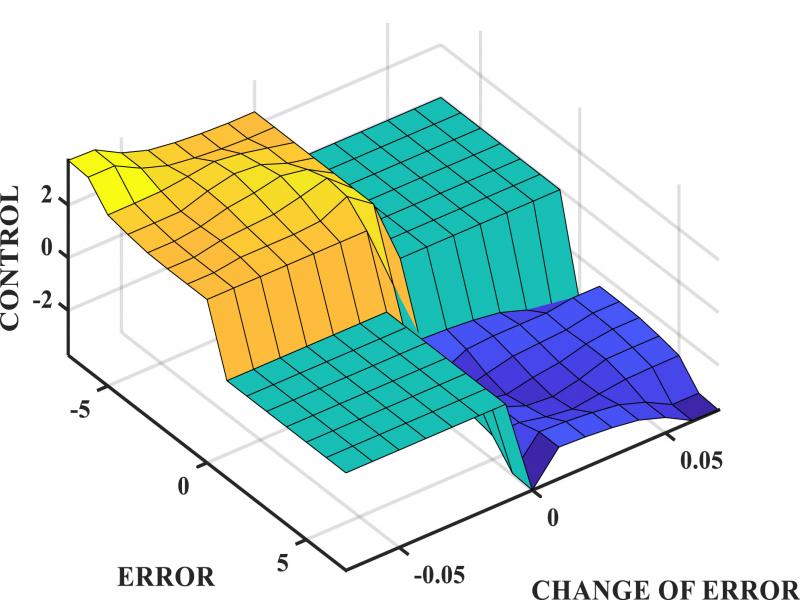
Figure 8:
FIS in rule viewer.
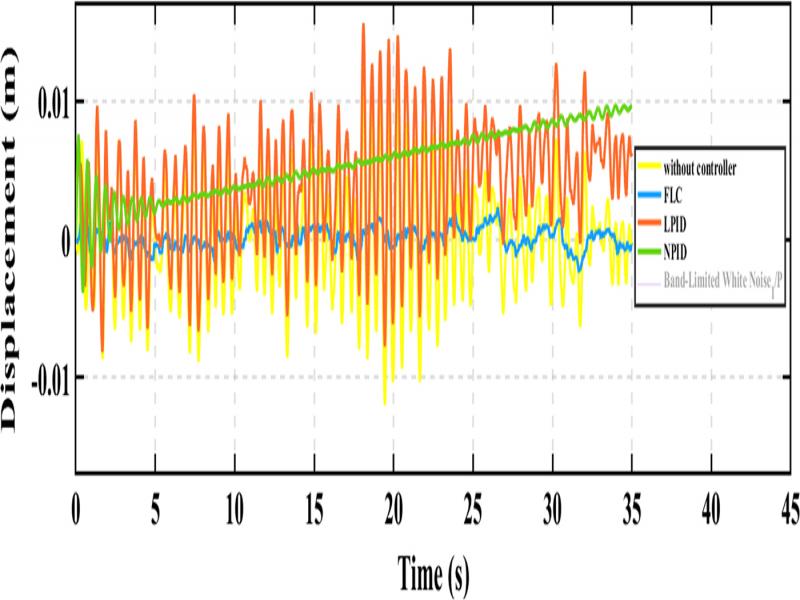
Figure 9:
Surface viewer for error vs. change of error.
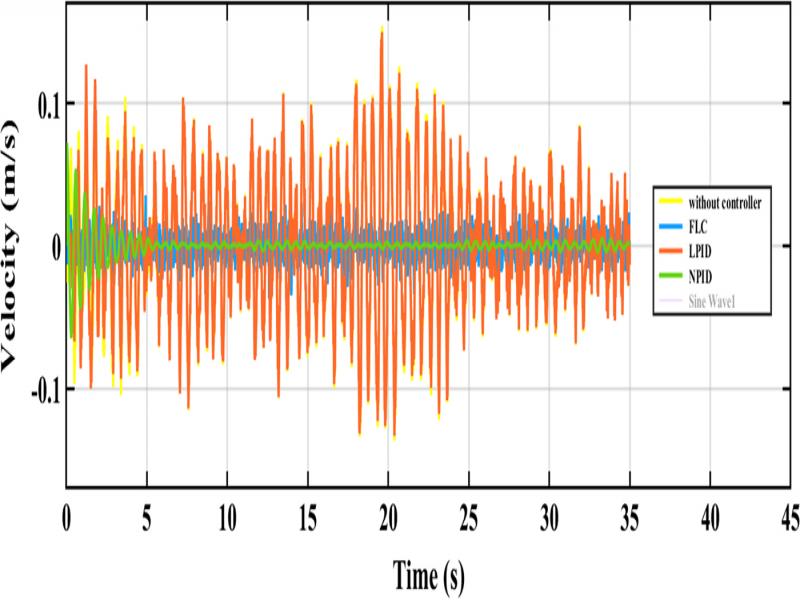
Figure 10:
Displacement without controlled and with controlled.
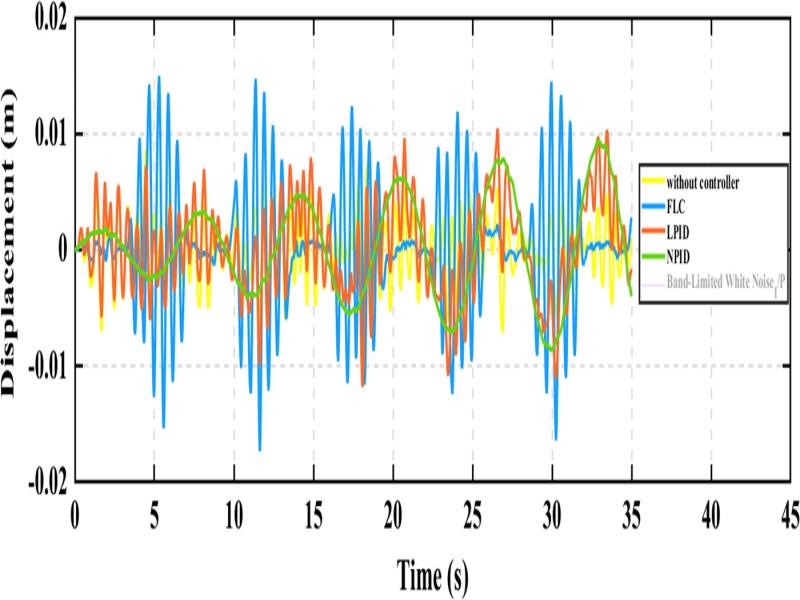
Figure 11:
Velocity without controlled and with controlled.
Table 3.
Response of SDOF system and percentage reduction in response output.
| Case 1 | ||||
|---|---|---|---|---|
| Type | Absolute maximum displacement (m) | Reduction (%) | Absolute maximum velocity (m/s) | Reduction (%) |
| Without controller | 1.213 × 10⁻² | – | 1.544 × 10⁻¹ | – |
| With controller | ||||
| FLC | 2.280 × 10⁻³ | 81.203% | 4.493 × 10⁻² | 70.900% |
| LPID | 1.564 × 10⁻² | 28.936% | 1.501 × 10⁻¹ | 2.784% |
| NPID | 9.680 × 10⁻³ | 20.197% | 7.245 × 10⁻² | 53.076% |
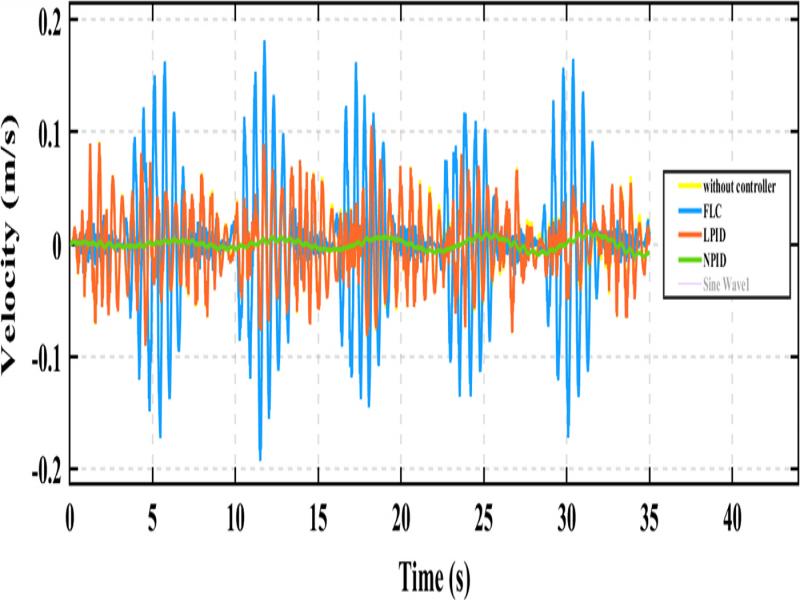
Figure 12:
Displacement without controlled and with controlled.
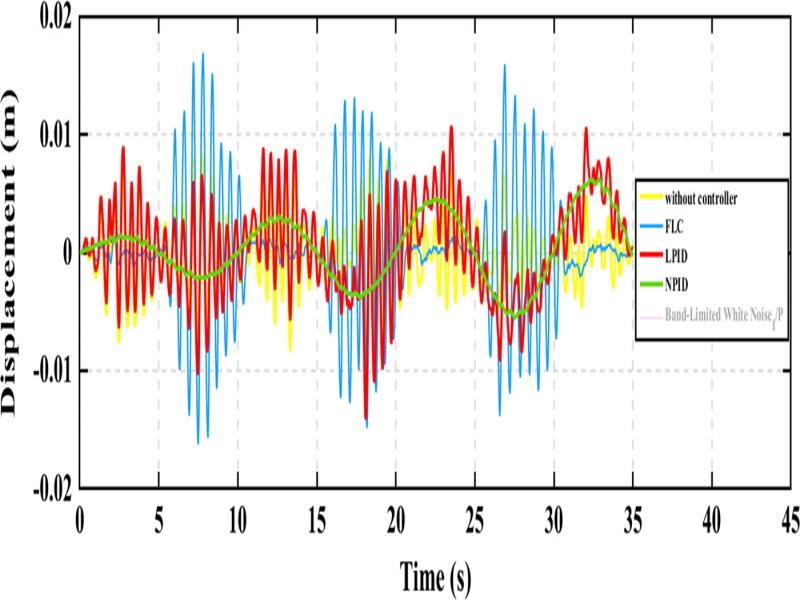
Figure 13:
Velocity without controlled and with controlled.
Table 4.
Response of SDOF system and percentage reduction in response output.
| Case 2 | ||||
|---|---|---|---|---|
| Type | Absolute maximum displacement (m) | Reduction (%) | Absolute maximum velocity (m/s) | Reduction (%) |
| Without controller | 8.594 × 10⁻³ | – | 1.023 × 10⁻¹ | – |
| With controller | ||||
| FLC | 1.499 × 10⁻² | 42.668% | 1.816 × 10⁻¹ | 43.667% |
| LPID | 1.048 × 10⁻² | 17.996% | 1.059 × 10⁻¹ | 3.399% |
| NPID | 9.369 × 10⁻³ | 8.271% | 1.099 × 10⁻² | 89.2570% |
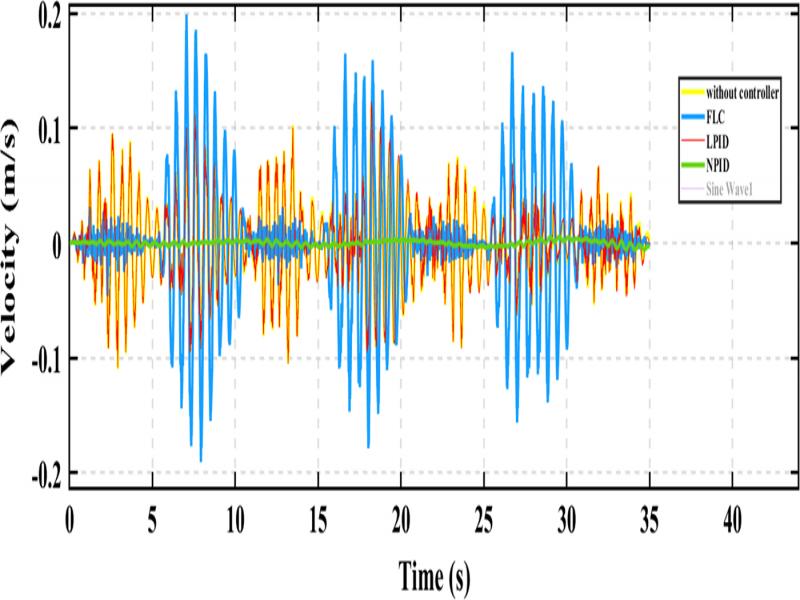
Figure 14:
Displacement without controlled and with controlled.
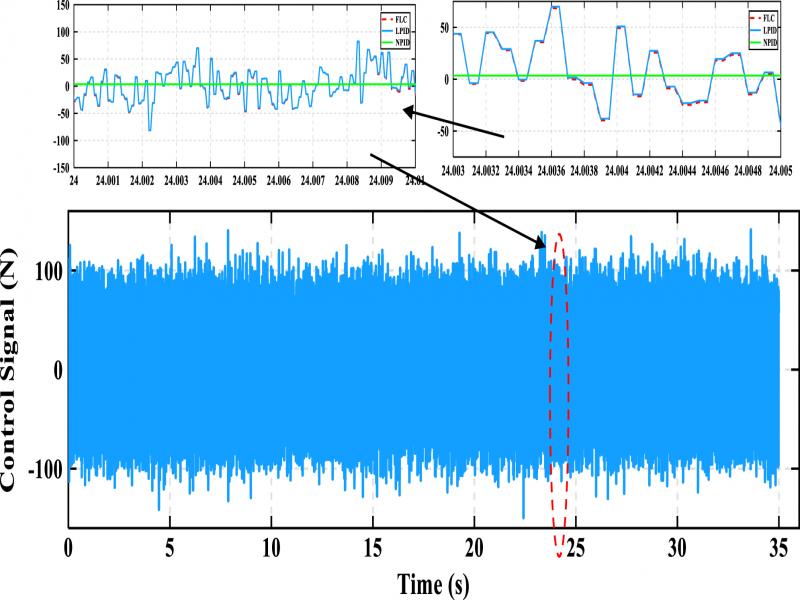
Figure 15:
Velocity without controlled and with controlled.
Table 5.
Response of SDOF system and percentage reduction in response output.
| Case 3 | ||||
|---|---|---|---|---|
| Type | Absolute maximum displacement (m) | Reduction (%) | Absolute maximum velocity (m/s) | Reduction (%) |
| Without controller | 8.465 × 10⁻³ | – | 1.206 × 10⁻¹ | – |
| With controller | ||||
| FLC | 1.689 × 10⁻² | 99.527% | 1.99 × 10⁻¹ | 65.008% |
| LPID | 1.070 × 10⁻² | 26.402% | 1.229 × 10⁻¹ | 1.907% |
| NPID | 6.205 × 10⁻³ | 26.698% | 5.640 × 10⁻³ | 95.323% |
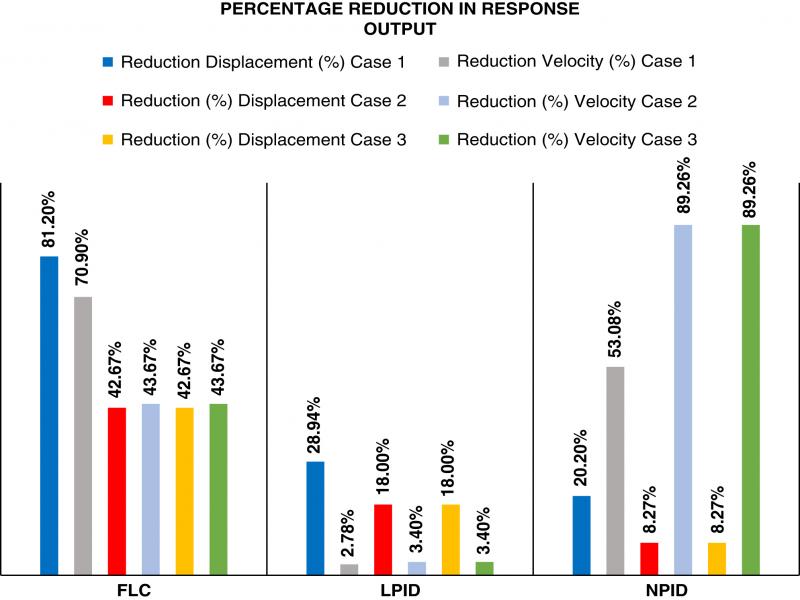
Figure 16:
Control signal.
Figure 17:
Chart of percentage reduction in response.