
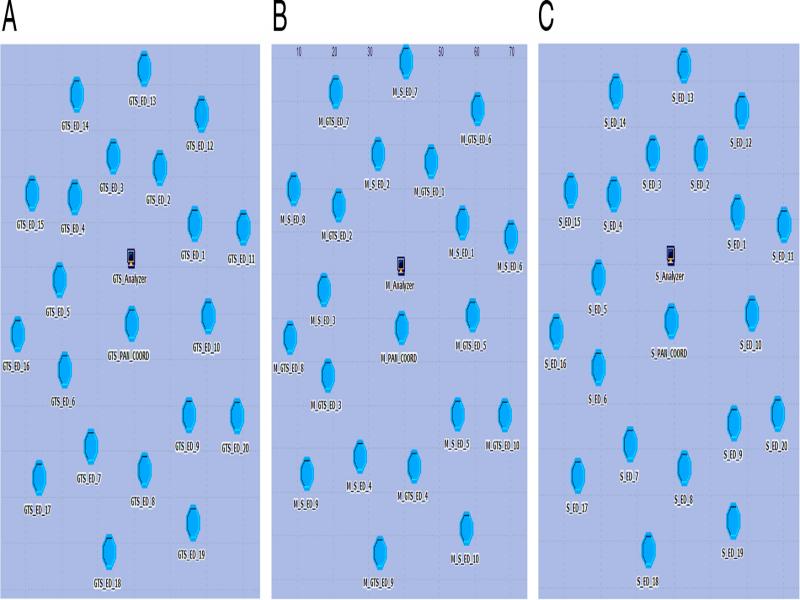
Figure 1:
Networks – (A) With GTS, (B) mixed, (C) without GTS.
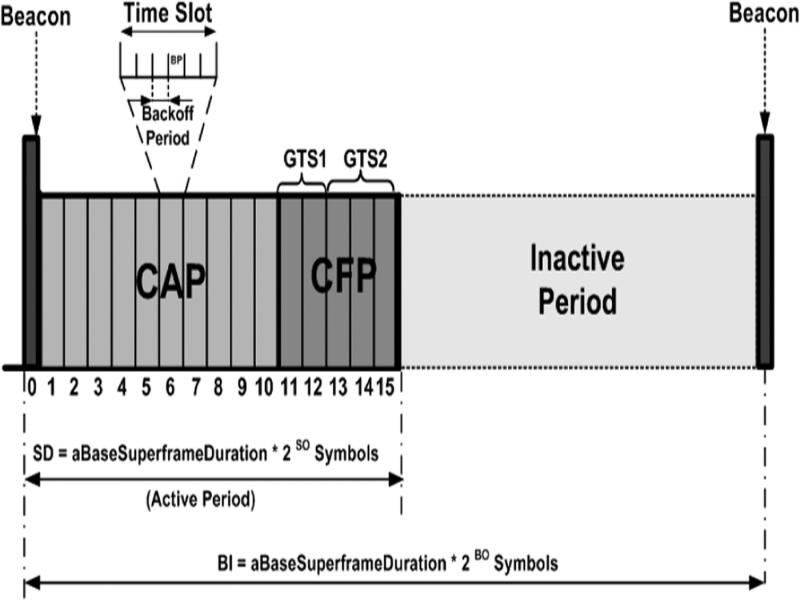
Figure 2:
Superframe structure (Koubaa et al., 2007).
Table 1.
Parametric values for PAN coordinator and end devices in three different networks.
| PAN coordinator | End device | |||||||
|---|---|---|---|---|---|---|---|---|
| Device type | Mixed | Mixed | ||||||
| Parameter/network | With GTS | With GTS | Without GTS | Without GTS | With GTS | With GTS | Without GTS | Without GTS |
| Acknowledged traffic parameters | ||||||||
| MSDU interarrival time (sec) | Exponential (2) | |||||||
| MSDU size (bits) | Exponential (912) | |||||||
| Start time (sec) | 0.1 | |||||||
| Stop time (sec) | 180 | |||||||
| Destination MAC address | Broadcast | PAN coordinator | ||||||
| Unacknowledged traffic parameters | ||||||||
| MSDU interarrival time (sec) | Exponential (2) | |||||||
| MSDU size (bits) | Exponential (912) | |||||||
| Start time (sec) | 0.1 | |||||||
| Stop time (sec) | 180 | |||||||
| CSMA parameters | ||||||||
| Maximum backoff number | 4 | |||||||
| Minimum backoff exponent | 3 | |||||||
| IEEE 802.15.4 | ||||||||
| Device mode | PAN coordinator | End device | ||||||
| MAC address | Auto assigned | |||||||
| WPAN settings | ||||||||
| Beacon order | 3 | |||||||
| Superframe order | 2 | |||||||
| PAN ID | 0 | |||||||
| Logging | ||||||||
| Enable logging | Enabled | |||||||
| GTS settings | ||||||||
| GTS permit | Enabled | Disabled | Enabled | Disabled | ||||
| Start time (sec) | 0.1 | Infinity | 0.1 | Infinity | ||||
| Stop time (sec) | 180 | Infinity | 180 | Infinity | ||||
| Length (slots) | 2 | 0 | 2 | 0 | ||||
| Direction | Receive | Transmit | Transmit | Transmit | ||||
| Buffer capacity (bits) | 10,000 | 1000 | 1000 | 1000 | ||||
| GTS traffic parameters | ||||||||
| MSDU interarrival time (sec) | Exponential (2) | Constant (1.0) | Exponential (2) | Constant (1.0) | ||||
| MSDU size (bits) | Exponential (912) | Constant (0.0) | Exponential (912) | Constant (0.0) | ||||
| Acknowledgment | Enabled | Disabled | Enabled | Disabled | ||||
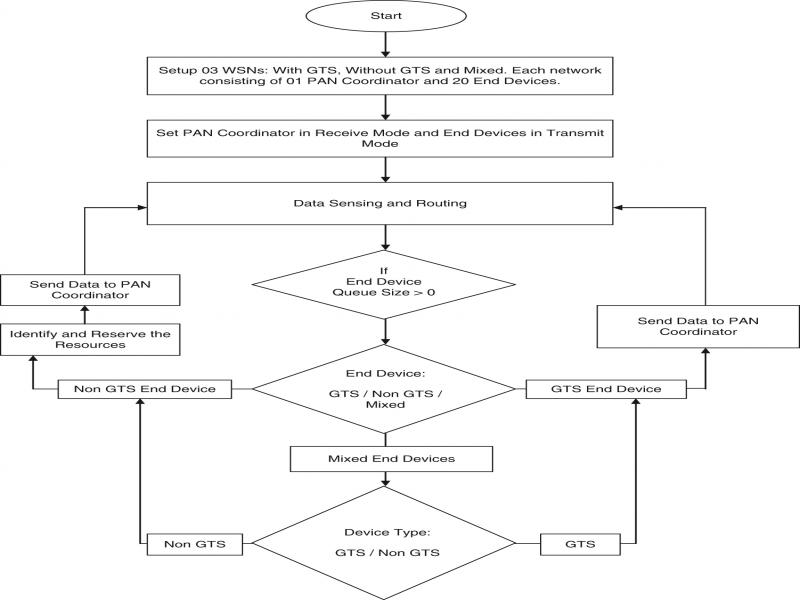
Figure 3:
Flow Chart: Working of GTS, non-GTS, and mixed sensor networks.
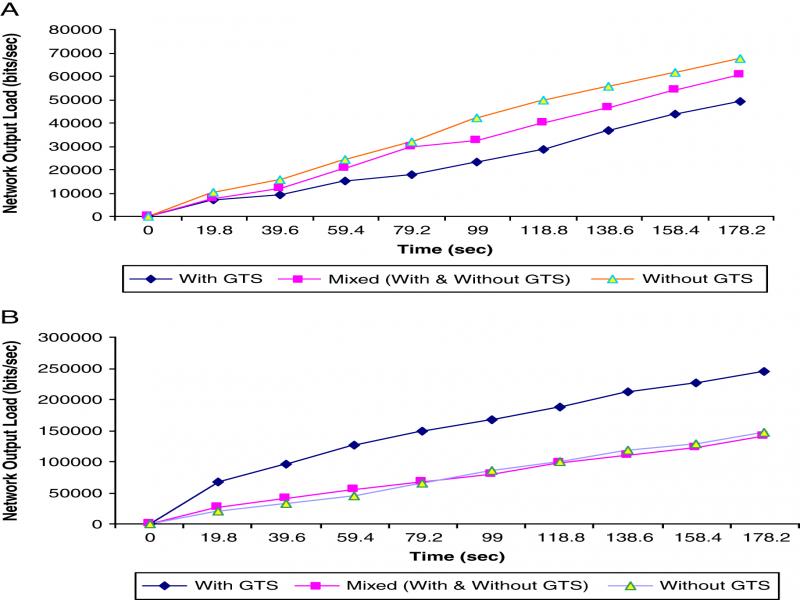
Figure 4:
Network output load: (A) PAN coordinator (B) End device.
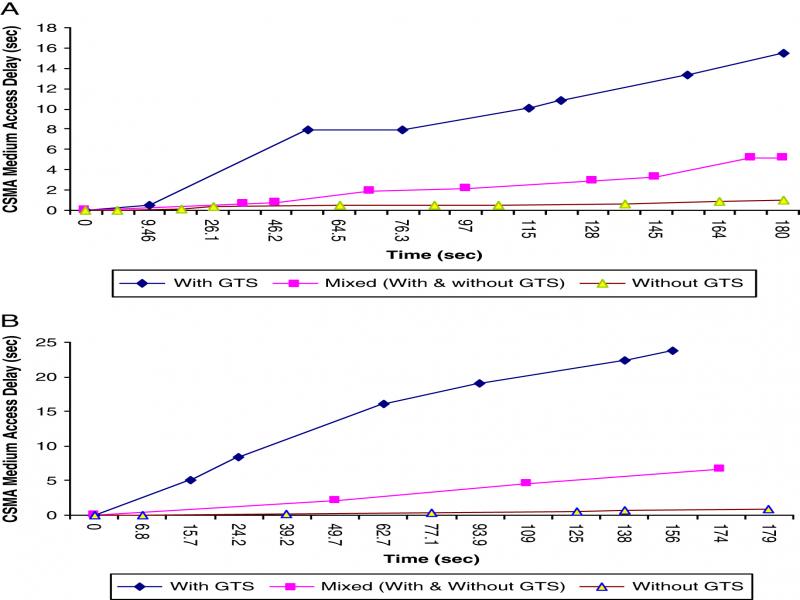
Figure 5:
CSMA medium access delay: (A) PAN coordinator (B) End device.
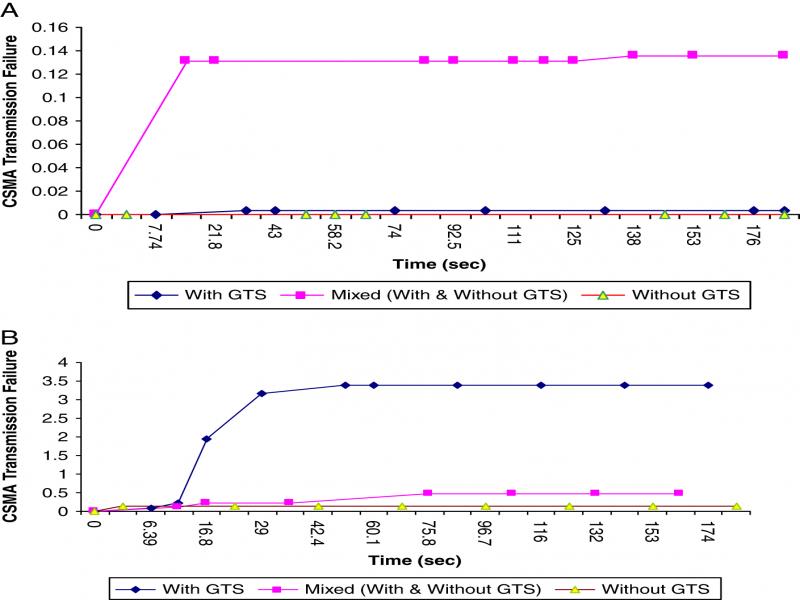
Figure 6:
CSMA transmission failure (A) PAN coordinator (B) GTS end device.
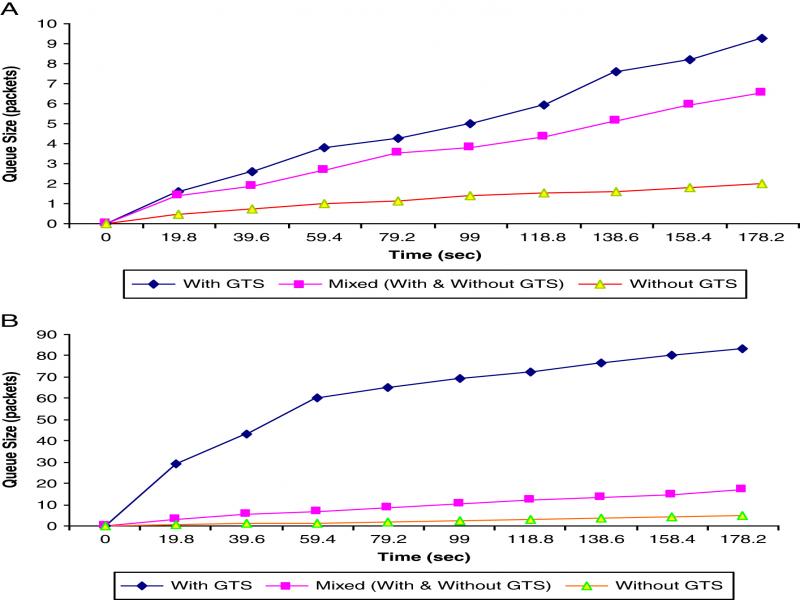
Figure 7:
Queue size (A) PAN coordinator (B) End device.
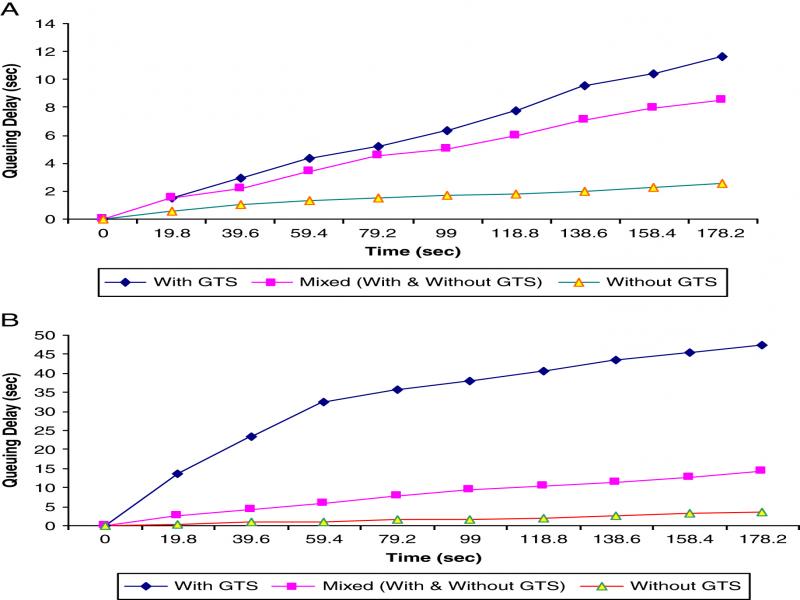
Figure 8:
Queuing delay (A) PAN coordinator (B) End device.