
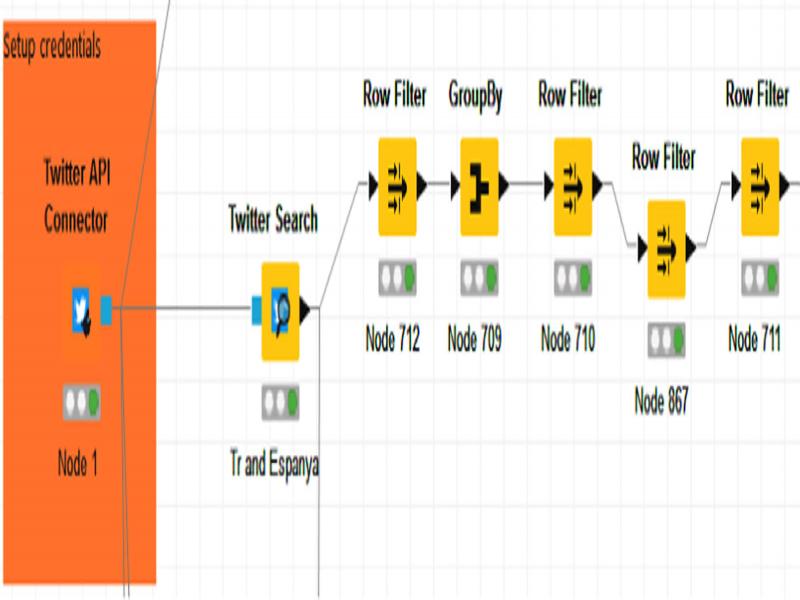
Figure 1:
A series of KNIME nodes that used in our data gathering and analyzing processes.
Table 1.
The used words in each country.
| Country | Sample keyword for search |
|---|---|
| USA | ‘USA’, ‘health’ |
| Spain | ‘Spain’, ‘moda’ |
| Turkey | ‘Turkey’, ‘moda’ |
| France | ‘France’, ‘paris’ |
| Saudi Arabia | ‘ ’, ‘ ’, ‘ ’ ’ |
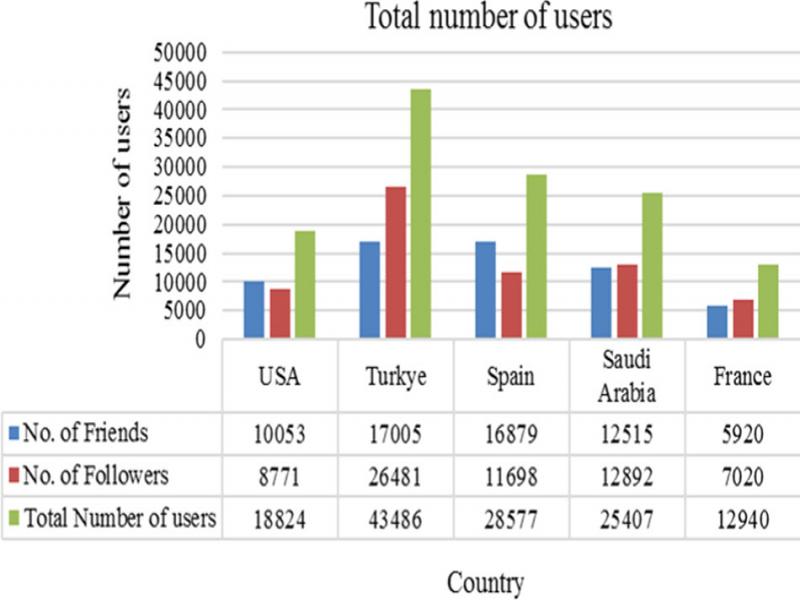
Figure 2:
The total number of users.
Table 2.
Samples of location keywords that used to classify the countries of Twitter users.
| Country | Sample keywords |
|---|---|
| USA | USA – Miami – Los Angeles – California – Chicago – Houston |
| France | France – Landau –Melnibone – Bordeaux – Tours – Lyon – Paris – Nice |
| Saudi Arabia | Saudi Arabia – Dammam – – – – – – – - -
|
| Turkey | Turkey – Istanbul – Izmir – Samsun – Adana – Antalya – Ankara |
| Spain | Spain – Barcelona – Madrid – Agitando – Granada – Barna |
Table 3.
Example for determining the best predicted country using proposed algorithm.
| Country | FrLoc | FLLoc | FrLG | FLLG | Sum |
|---|---|---|---|---|---|
| Turkey | 0.4 | 0.3 | 0.5 | 0.4 | 1.6 |
| USA | 0.2 | 0.3 | 0.3 | 0.4 | 1.2 |
| Spain | 0.1 | 0.2 | 0.2 | 0.1 | 0.6 |
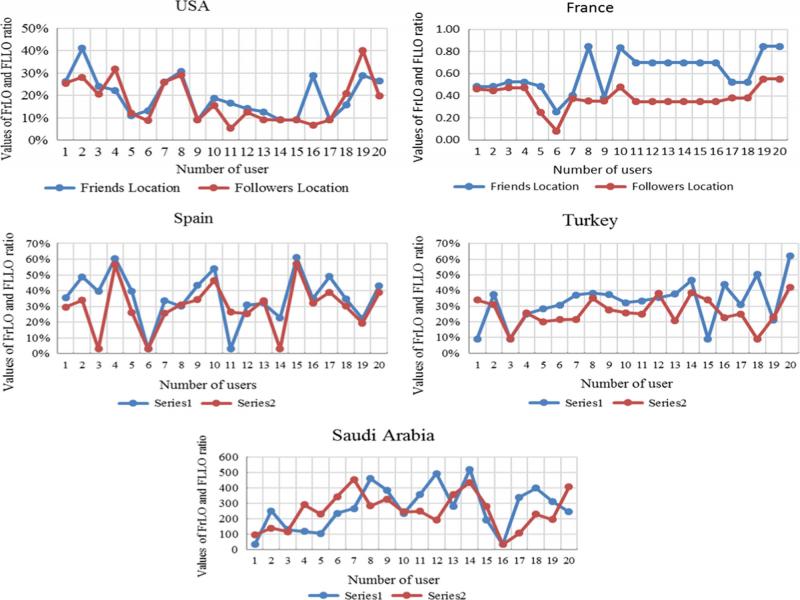
Figure 3:
Samples of values for FrLoc (friends location) and FLLoc (followers location) of the friends and followers of 20 randomly Twitter users from five different countries.
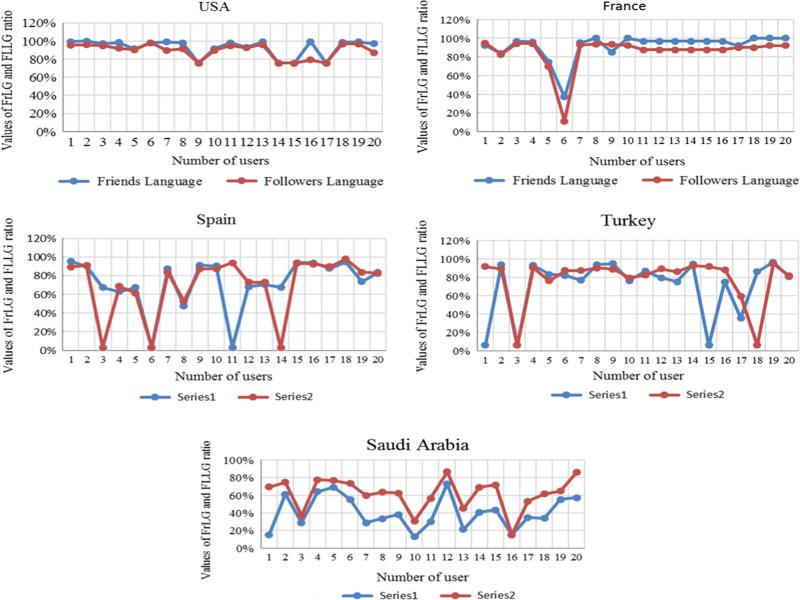
Figure 4:
Samples of values for FrLG (friends language) and FLLG (followers language) of the friends and followers of 20 randomly Twitter users from five different countries.
Table 4.
Comparison between the accuracy of the proposed algorithm in different countries.
| Country | Accuracy |
|---|---|
| USA | 90% |
| Turkey | 98% |
| Spain | 94% |
| Saudi Arabia | 86% |
| France | 96% |
Table 5.
Comparison between the accuracy of the proposed algorithm and previous algorithms.
| Algorithm | No. of country | Accuracy |
|---|---|---|
| Huang et al. (2014) | 1 | 83.8% |
| Culotta et al. (2015) | 1 | 90% |
| Abbas et al. (2017) | 4 | 90% |
| Proposed | 5 | 92.8% |