
I. THE PROBLEM BACKGROUND
With the rapid development of mobile communication network, various mobile terminal devices and applications affect every aspect of people’s life. However, the current network information construction faces some problems: the acceleration of urban construction makes the urban environment more and more complex, which leads to the formation of many wireless signal black spots and weak coverage areas in densely populated urban areas; Some urban residents misunderstand the construction of base stations, believing that the harm of base stations into the community is serious, which makes the deployment of base stations significantly more difficult, and the phenomenon of station demolition is also increasing. Due to the difficulties in property coordination in many communities, the arrival rate of the last kilometer of transmission fiber deployment is low.
In literature [1], the deployment principles, coverage characteristics, station type selection and comparison with conventional micro-base stations are studied, and the actual deployment scheme of Relay micro-base station is proposed, and the effectiveness of the scheme is verified. Literature [2] focuses on analyzing the principle and characteristics of Relay technology, and deeply studies the deep coverage of urban areas and the wide coverage of rural areas and roads. Literature [3] studies the impact of Relay technology on the wireless network structure, wireless network planning and the development of wireless network planning tools. Literature [4] discussed whether the broadband wireless communication system can be deployed under the condition of non-line-of-sight NLOS. Can you provide reliable high bandwidth connections? Is there a reliable high bandwidth NLOS solution available? The above literature mainly starts from the theory, while this paper mainly studies the base station deployment plan from the actual situation, establishes the model and conducts the feasibility verification, and finally achieves the goal of low cost and small path loss to improve the user experience.
II. MATHEMATICAL MODEL
A. The known conditions
The location distribution of candidate sites in this paper is known, and there are 1000 sites. Only the mutual location and topological relationship between sites are considered, that is, only the distance between the host station and the sub-station is considered. The integrated cost of various station types, including the integrated cost of the host station, the integrated cost of the sub-station, and the cost of satellite equipment are also known.
Total cost = host station cost * number of host stations + substation cost * number of substations + satellite cost * number of satellites
Average cost = total cost/number of sites in the region
The topological relationship between sites meets the following conditions:
1) The distance between the host station and the first-level sub-station is no more than 20km, and the distance between sub-stations is no more than 10km.
2) The site is divided into two types: RuraStar (one sector) and butterfly station (two sectors).
3) If it is the host station, the maximum number of sub-stations at level 1 in each sector is 4, and the total number of sub-stations does not exceed 6.
4) Regardless of the coverage direction of butterfly station sector;
5) The limit of microwave communication distance between host stations is 50km.
6) Wireless return connection is adopted between host station and sub-station and between sub-stations;
7) Each sub-station can only have two wireless back links at most, that is, the upstream and downstream links are unique;
8) The relation diagram between host station and substation is similar to the tree diagram.
9) There is only one path between any substation and the host station, and the number of hops is less than 3.
10) There is a one-to-many relationship between the satellite and the host station. A host station group with less than 8 satellites can share a satellite.
The wireless back propagation is affected by the NLOS scene, and the free space propagation is adopted to simplify the calculation.
The model estimates the path loss between sites, and the formula is as follows:
Where, PL stands for path loss, D is the distance between the two stations, the unit is km, F is the transmission frequency, the default is a constant, 900MHZ.
Average system loss = sum of all wireless return connection losses/number of wireless return connections
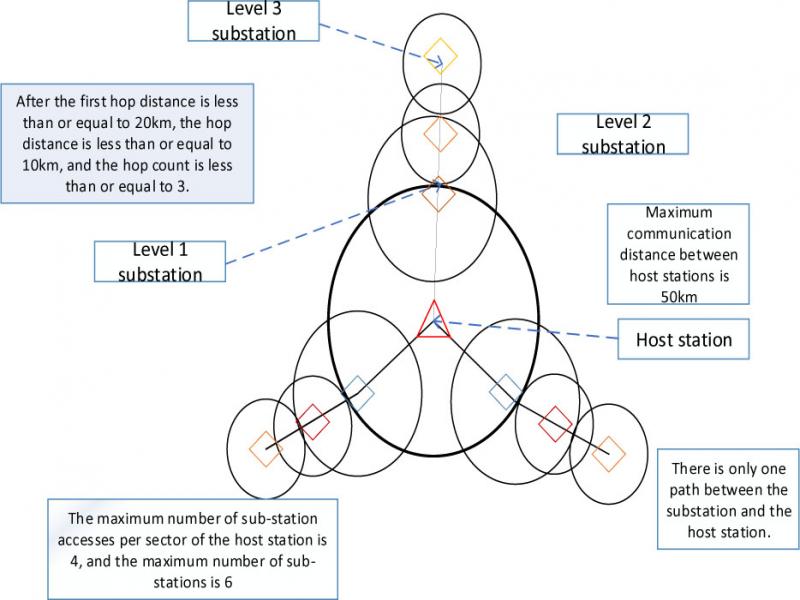
Figure 1.
Schematic diagram of connections between sites
B. Question assumptions
1) Suppose RRN (eRelay Remote Node) wireless transmission device as a substation;
2) It is assumed that DeNB, as the host station, can be divided into 1 to 3 host cells, covering different directions.
3) It is assumed that the effects of terrain blocking and ordinary mobile phone access blocking on the back transmission quality are not considered.
4) It was assumed that ReBTS interference was not considered.
5) The interference of adjacent base stations is not considered.
6) It is assumed that the first jump of cascade between base stations is not greater than 20km, and then it is not greater than 10km.
7) Assuming that the sector coverage direction of butterfly station is not taken into account, the maximum number of sub-stations is 12.
8) It is assumed that the maximum number of RuralStar stations is 4.
9) It is assumed that the host stations are connected by microwave and the maximum communication distance is 50KM.
10) Suppose that the host station and the sub-station and the sub-station are connected by wireless back transmission.
11) It is assumed that a substation can only have one host station, and there is only one path to the host station, and the path contains no more than 3 hops.
12) It is assumed that there can be no more than 2 wireless return connections between each substation.
13) Assuming that only one satellite of any host station is responsible for the back transmission, host stations connected by slices can share one satellite, and each satellite can only bear the back transmission data of 8 host stations.
14) It is assumed that the total number of host stations is unlimited.
15) Assuming that the maintenance costs of the host station, substation and satellite are not taken into account.
16) Assuming that other factors are not considered, the spherical model is transformed into a plane model.
17) It is assumed that the path consumption is estimated by the free space model without considering the influence of NLOS.
C. Meaning of the symbols
TABLE I.
NOTATION TABLE
| symbols | Meaning | |||
|---|---|---|---|---|
| LOS | Line-of-sight transmission capability | |||
| ROI | Return on investment | |||
| NLOS | Non-line-of-sight transmission capability | |||
| RRN | The infinite return device of the infinite return scheme | |||
| RN | Relay station | |||
| UE | Ordinary mobile phone | |||
| PL | Path to the consumption | |||
| APL | Average path consumption | |||
| D | Site spacing | |||
| F | Transmission frequency | |||
| R | Radius of the earth | |||
| S | The distance between the spheres | |||
| αi | I point longitude | |||
| β i | I point the dimension | |||
| i | Base station identification | |||
| Xi | The host site | |||
| Yi | The child site | |||
| Zi | Satellite point | |||
| C | The overall cost | |||
| FD | The first jump distance | |||
| ND | After each jump distance | |||
| FXi | Butterfly host station | |||
| RXi | Star host station | |||
| WL | Microwave connections between host stations | |||
| WBL | Wireless return connection between host station and sub-station and between sub-stations | |||
| JS | The number of hops from a substation to a host station | |||
| Ceil | The function that rounds up |
| transport | cost | |||
|---|---|---|---|---|
| host station | 10 | |||
| child station | 5 | |||
| satellite | 50 |
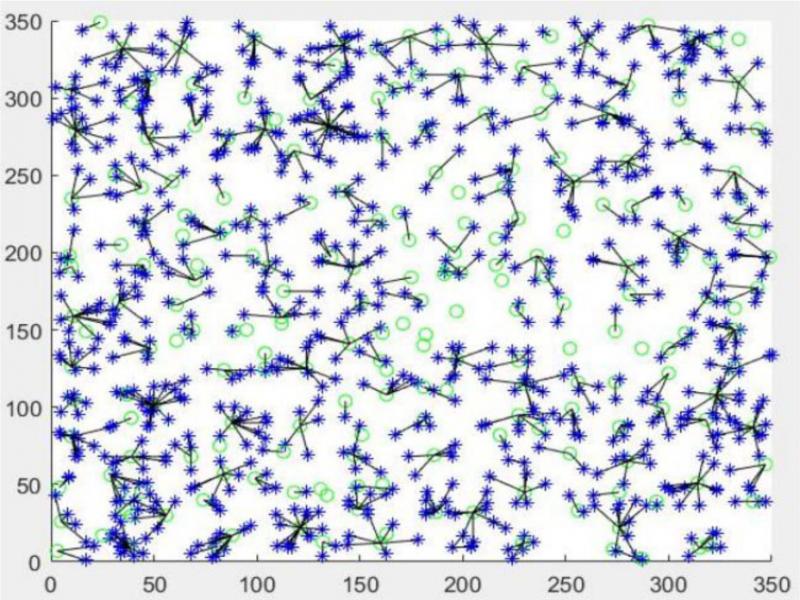

| Radius (km) | Host station | child station | satellite | Overall cost (WUSD) |
|---|---|---|---|---|
| 20 | 222 | 778 | 28 | 7510 |
| 25 | 136 | 858 | 17 | 6500 |
| 30 | 110 | 871 | 14 | 6155 |