
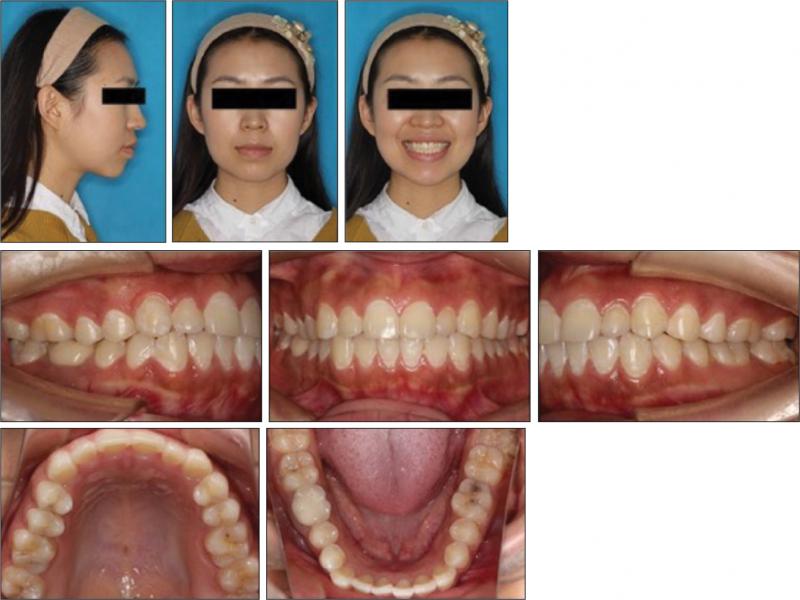
Figure 1.
Pretreatment facial and intraoral photographs.
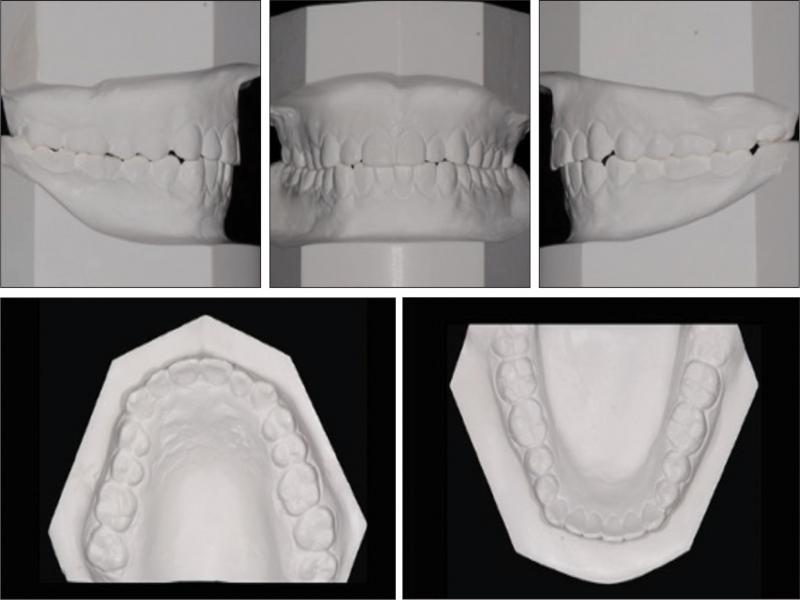
Figure 2.
Pretreatment dental casts.
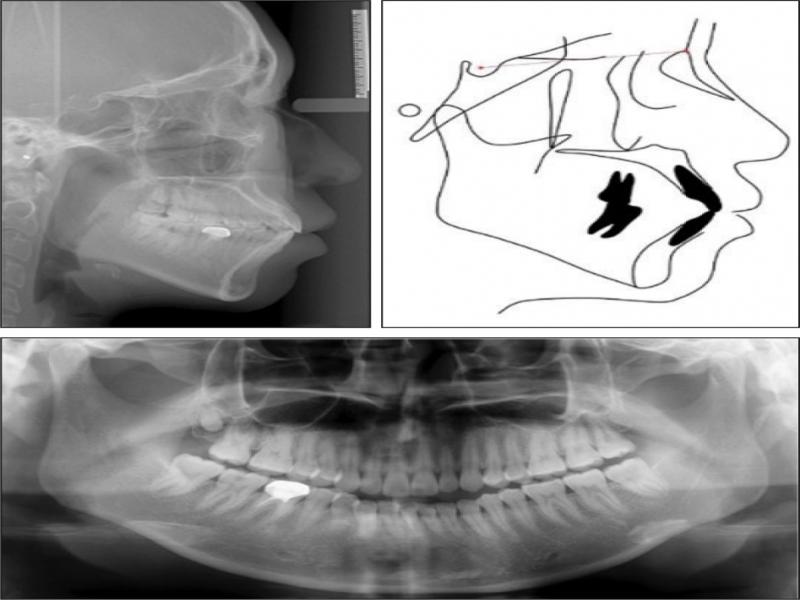
Figure 3.
Pretreatment cephalometric radiograph (top left) and tracing (top right) and panoramic radiograph (bottom).
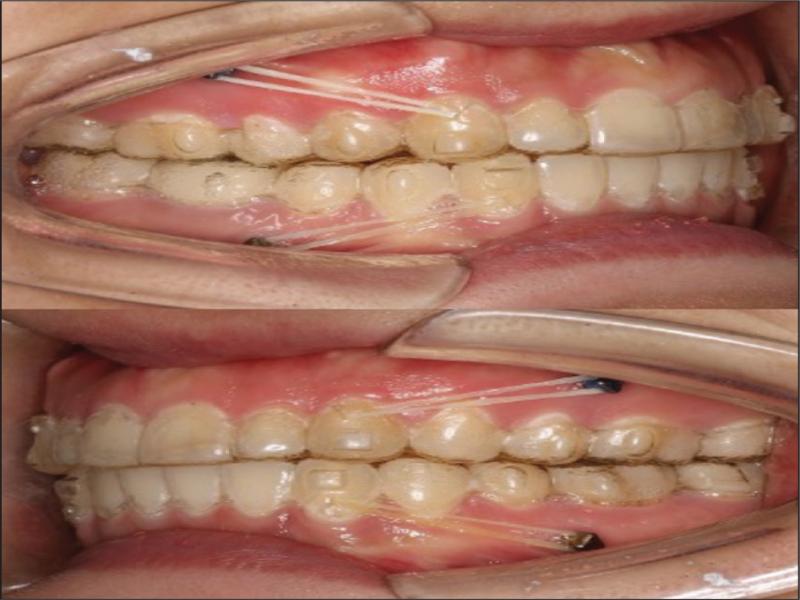
Figure 4.
Intraoral photographs showing the elastics running from the precision-cuts to the miniscrews.
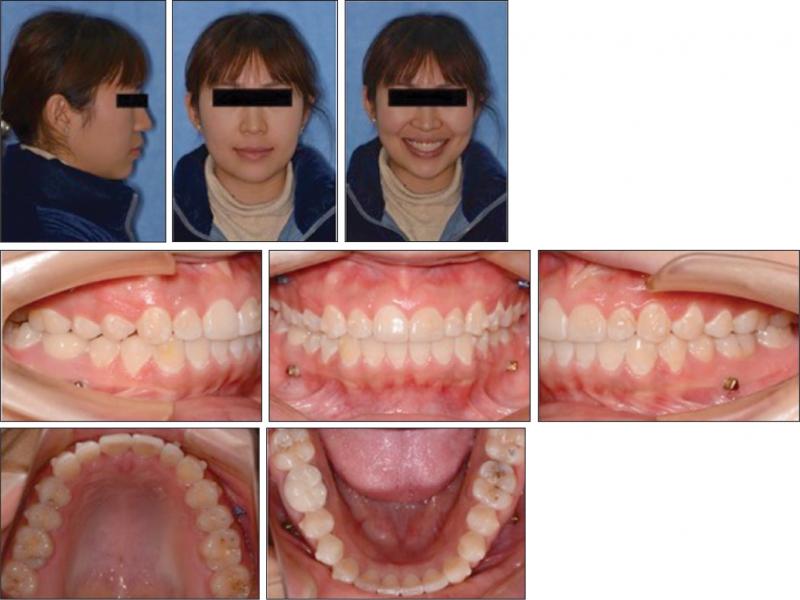
Figure 5.
Facial and intraoral photographs before the first refinement during treatment.
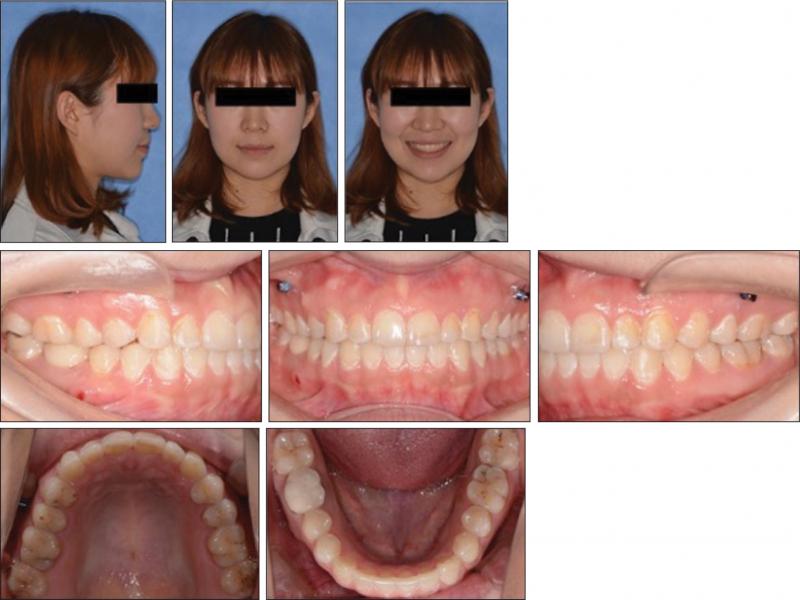
Figure 6.
Post-treatment facial and intraoral photographs.
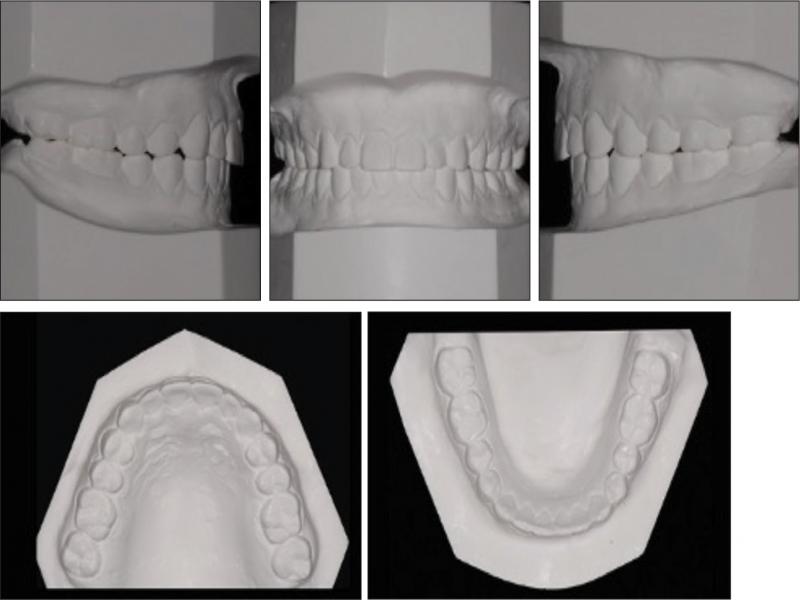
Figure 7.
Post-treatment dental casts.
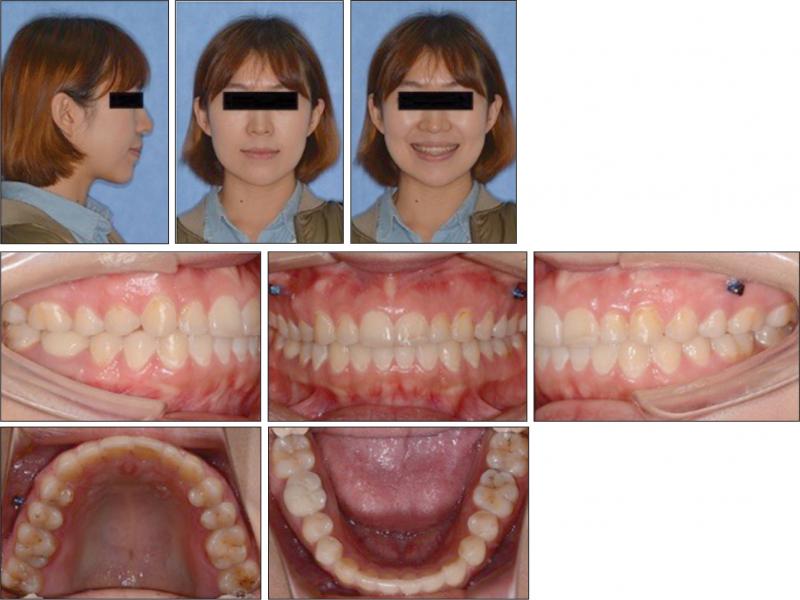
Figure 8.
Facial and intraoral photographs after 1.5 years retention. The upper two miniscrews remained in the oral cavity for retention (elastics from the cuts in the retainer to the miniscrews).
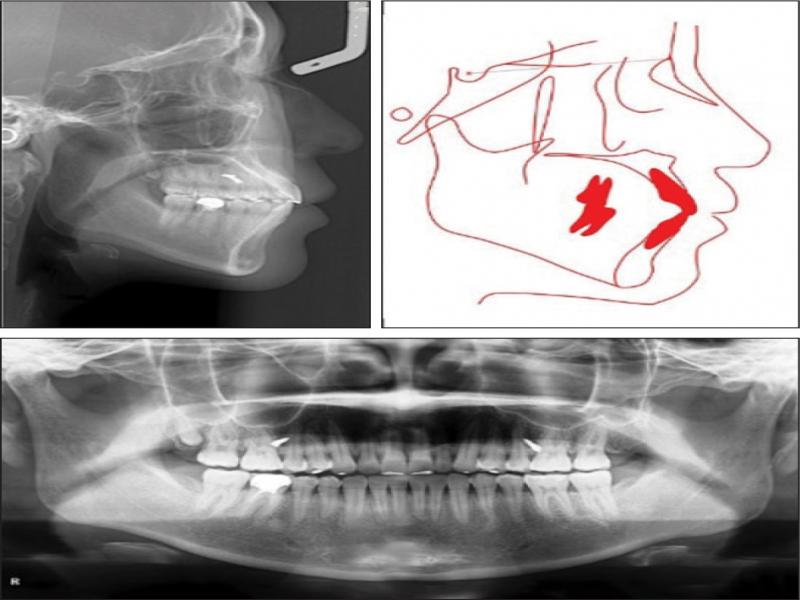
Figure 9.
Post-treatment cephalometric radiograph (top left) and tracing (top right) and panoramic radiograph (bottom).
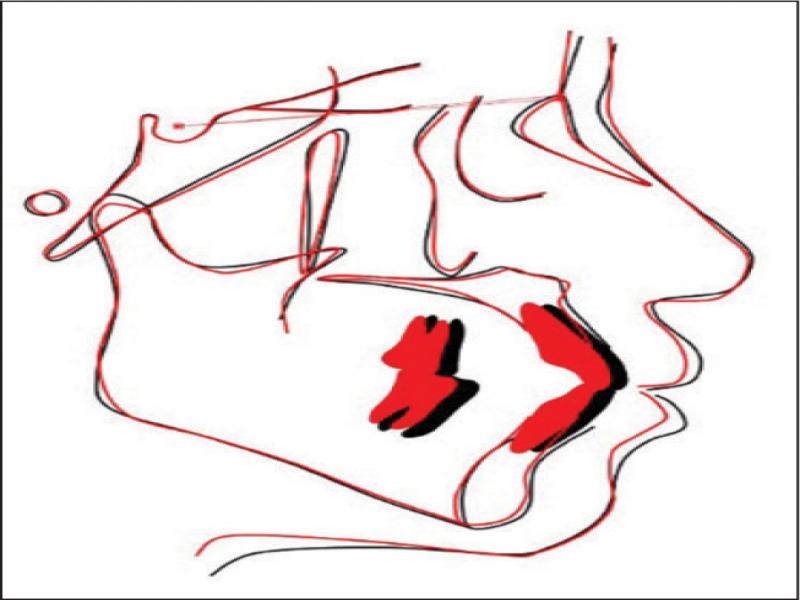
Figure 10.
Superimposition of the pretreatment (black line) and post-treatment (red line) cephalometric radiographs.
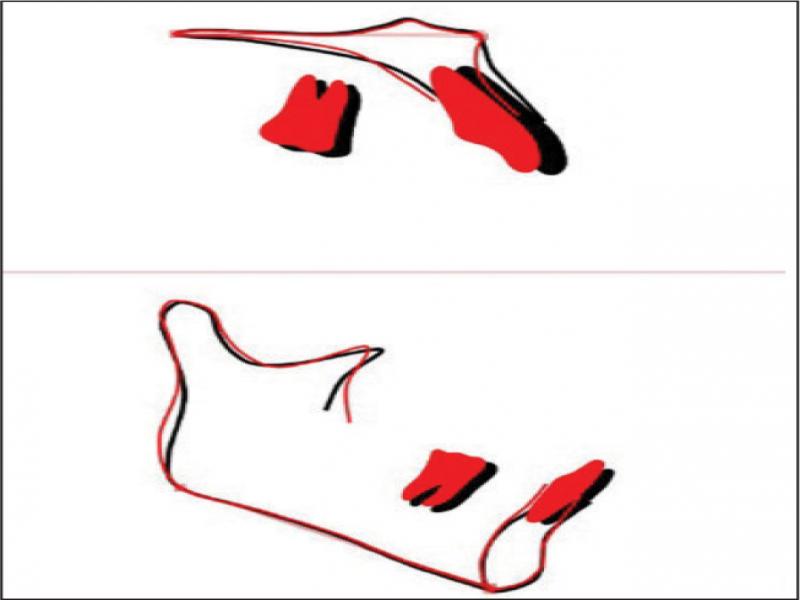
Figure 11.
Superimposition of the pretreatment (black line) and post-treatment (red line) cephalometric radiographs (maxilla and mandible alone).
Table I.
Cephalometric analyses before and after the treatment.
| Measurement | Normal43, 44 | Before | After | Changes* |
|---|---|---|---|---|
| Skeletal | ||||
| SNA (Sella-Nasion-point A, °) | 83.6 ± 3.6 | 84.8 | 83.2 | -1.6 |
| SNB (Sella-Nasion-point B, °) | 79.7 ± 3.6 | 81.5 | 79.3 | -2.2 |
| ANB (Point A-Nasion-point B, °) | 3.9 ± 1.8 | 3.0 | 3.9 | -0.9 |
| SN-MP (SN plane-mandibular plane, °) | 32.9 ± 4.0 | 34.4 | 35.9 | 1.5 |
| S-Go/N-Me (Sella-gonion/nasion-menton, %) | 65.9 ± 4.0 | 67.3 | 66.1 | -1.2 |
| Dental | ||||
| U1-L1 (Axial inclination of upper and lower incisors, °) | 117.6 ± 8.8 | 116.7 | 115.8 | -0.9 |
| U1-SN (U1-sella nasion, °) | 65.0 ± 7.5 | 67.9 | 66.9 | -1.0 |
| U1-AP (Protrusion of maxillary incisors, mm) | 6.7 ± 2.0 | 10.8 | 8.6 | -2.2 |
| L1-AP (Protrusion of mandibular incisors, mm) | 3.0 ± 2.0 | 8.3 | 5.1 | -3.2 |
| FMIA (Frankfort horizontal plane-L1, °) | 57.0 ± 7.0 | 57.5 | 61.6 | 4.1 |
| U1-PP (U1-palatal plane, mm) | 27.5 ± 2.0 | 30.5 | 29.7 | -0.8 |
| U6-PP (U6-palatal plane, mm) | 21.5 ± 2.0 | 26.6 | 25.6 | -1.0 |
| Ptv-U6 (Pterygomaxillary fissure-U6, mm) | 18.0 ± 3.0 | 22.8 | 19.8 | -3.0 |
| Profile | ||||
| Upper lip to E-plane (mm) | -1.5 ± 2.4 | 1.0 | -1.1 | -2.1 |
| Lower lip to E-plane (mm) | 0.9 ± 2.5 | 4.5 | 1.6 | -2.9 |
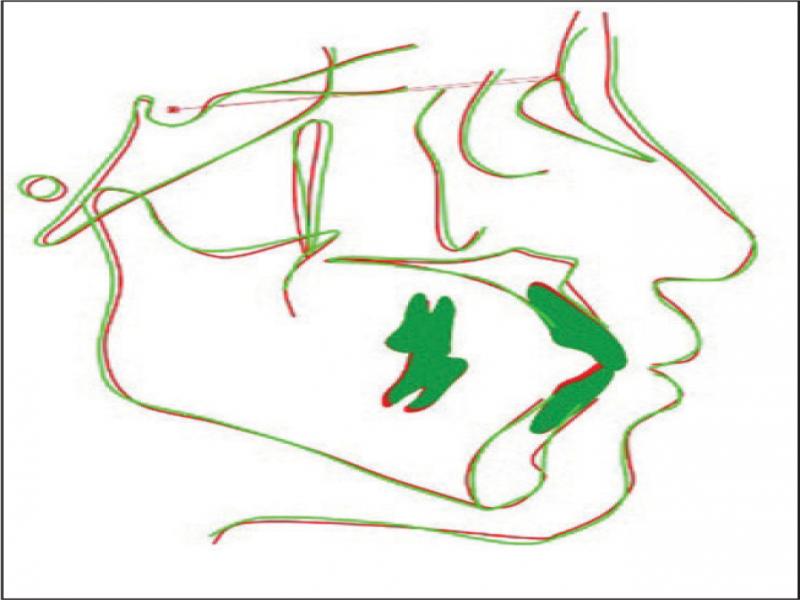
Figure 12.
Superimposition of the post-treatment (red line) and the 1.5-year retention (green line) cephalometric radiographs.