
Table 1.
Chloride content of individual street and sidewalk cleaning samples after summer and winter
| Location | Chloride content in street cleaning wastewater [mg/dm3] after summer | Chloride content in street cleaning wastewater [mg/dm3] after winter | ||||
|---|---|---|---|---|---|---|
| Average | Value min. | Value of max. | Average | Value min. | Value of max. | |
| Streets 1 | 35.42 | 29.3 | 41.4 | 362.75 | 321.6 | 399.8 |
| Streets 2 (sewage wells) | 59.8255 | 45.6 | 71.9 | 1467.93 | 1201.4 | 1732.8 |
| Streets 3 (washing the streets) | 43.886 | 38.3 | 49.3 | 421.73 | 436.3 | 468.5 |
| Pedestrian walkway | 36.42 | 25.8 | 46.2 | 53.13 | 45.9 | 59.2 |
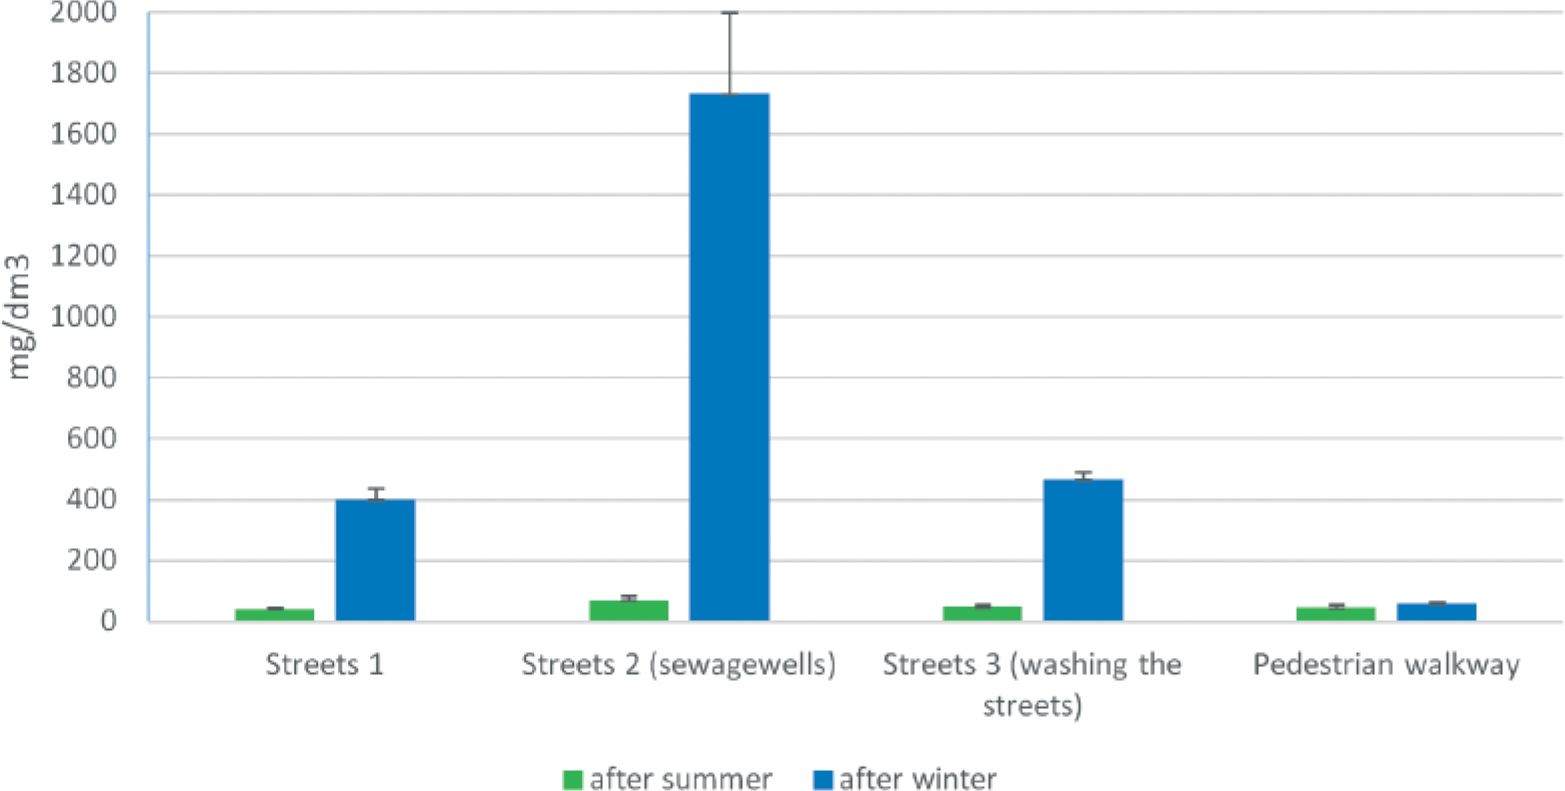
Figure 1.
Comparison of chloride content [mg/dm3] on selected streets in cleaning sweepings collected after summer and winter, including standard deviation
Table 2.
Comparison of selected parameters of environmental pollution tested on streets in Krakow during street cleaning processes with parameters determined on other streets as a result of similar activities
| Location | Length of surveyed section [m]. | Chloride content of street cleaning wastewater [mg/dm3] | ||
|---|---|---|---|---|
| Average | Value min. | Value of max. | ||
| Access street | 700 (One-way, 2-day left/right experiment), | 500 | 965 | 34,1 |
| Pedestrian walkway, 700 (One-way, 2-day left/right experiment), | 118 | 210 | 25 | |
| Alley Krasińskiego | 1020 (two-way, three-day experiment full width) | 394 | 762 | 25.6 |
| Street Porucznika Halszki | 770 (two-way, three-day experiment full width) | 385 | 749 | 25 |
| Street Bulwarowa | 550 (two-way, three-day experiment full width) | 34 | 52,9 | 15 |