
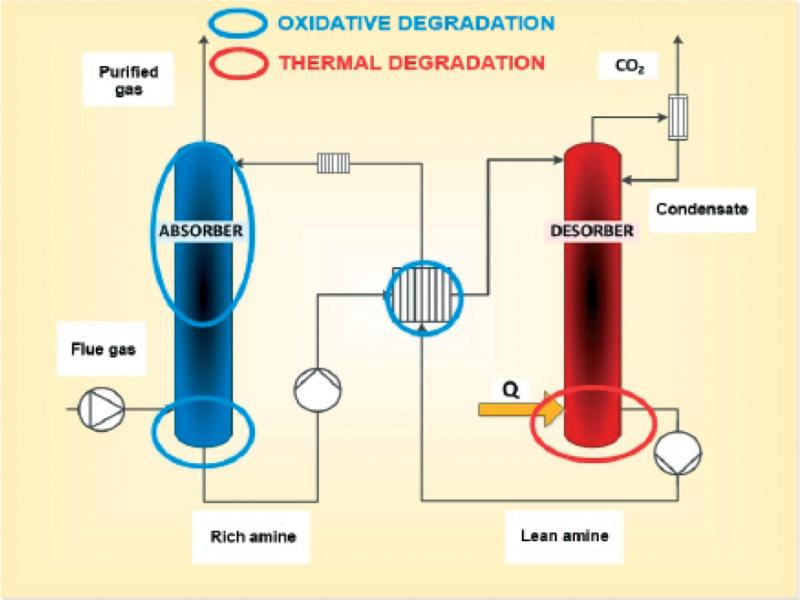
Figure 1.
Main points of degradation process occurrence in the amine scrubbing systems
Table 1.
Degradation products of MEA determined in this work
| Abbr. | Name | Formula | Molar mass g/mol | CAS |
|---|---|---|---|---|
| HEI | 1-(2-hydroxyethyl)imidazole |

| 112 | 1615-14-1 |
| HEIA | N-(2-hydroxyethyl)-2-imidazolidinone |

| 130 | 3699-54-5 |
| HEEDA | N-(2-hydroxyethyl)ethylenediamine |

| 104 | 111-4-1 |
| HEA | N-(2-hydroxyethyl)acetamide |

| 103 | 142-26-7 |
| OZD | 2-oxazolidinone |

| 87 | 497-25-6 |
Table 2.
The parameters of chromatographic analysis
| Parameter | Value |
|---|---|
| Dispenser temperature | 250°C |
| Initial oven temperature | 40°C |
| Final oven temperature | 250°C |
| Oven temperature increase | 6°C/min |
| Carrier gas flow rate | 1.0 ml/min |
| Split ratio | 10 |
| Transfer line temperature | 250°C |
| MSD working mode | SIM/FULL SCAN |
| Ionization Type | Electron (EI) |
Table 3.
Average retention time and average response factor for measured compounds
| Determined compound | Mean retention time for 10 repetitions, min | Mean response factor for 5 repetitions |
|---|---|---|
| OZD | 17.25 | 0.505 |
| HEDDA | 14.10 | 0.627 |
| HEIA | 24.84 | 0.728 |
| HEA | 16.56 | 0.569 |
| HEI | 19.96 | 0.496 |
Table 4.
Repeatability and precision for all determined compounds, expressed as the variation coefficient
| Determined compound | Repeatability [%] | Intermediate precision [%] |
|---|---|---|
| OZD | 4.99 | 5.76 |
| HEDDA | 3.78 | 4.15 |
| HEIA | 4.20 | 5.06 |
| HEA | 5.49 | 6.45 |
| HEI | 6.79 | 7.24 |
Table 5.
The results of analyzed samples
| No. sample | OZD | HEEDA | HEIA | HEA | HEI |
|---|---|---|---|---|---|
| mol/dm3 | |||||
| A3.1 | 0.008 | 0.002 | 0.010 | 0.025 | 0.045 |
| A4.1 | 0.015 | 0.012 | 0.021 | 0.018 | 0.021 |
| A3.2 | 0.012 | 0.008 | 0.018 | 0.033 | 0.068 |
| A4.2 | 0.021 | 0.011 | 0.029 | 0.024 | 0.037 |
| A3.3 | 0.026 | 0.016 | 0.033 | 0.041 | 0.087 |
| A4.3 | 0.048 | 0.024 | 0.048 | 0.028 | 0.074 |
| A3.4 | 0.035 | 0.021 | 0.040 | 0.087 | 0.099 |
| A4.4 | 0.052 | 0.048 | 0.064 | 0.034 | 0.076 |
| A3.5 | 0.037 | 0.029 | 0.054 | 0.067 | 0.084 |
| A4.5 | 0.058 | 0.048 | 0.073 | 0.052 | 0.070 |
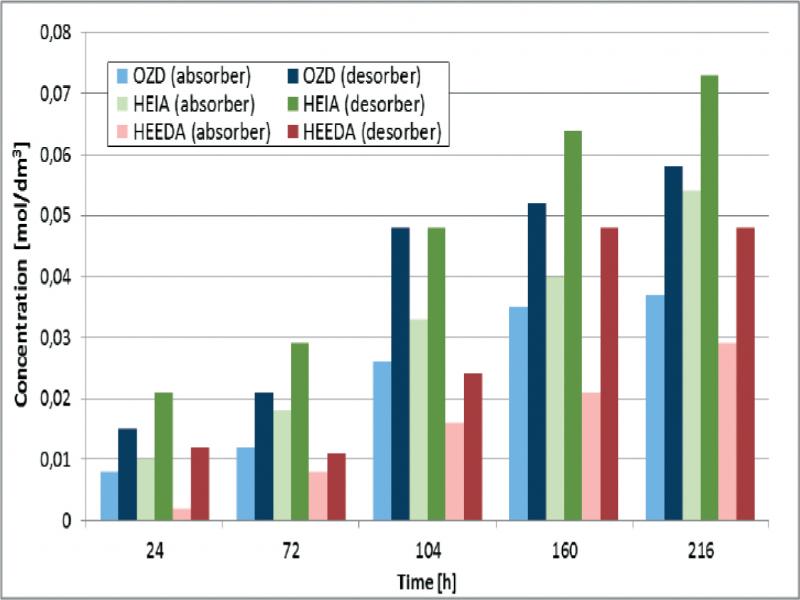
Figure 2.
Major degradation products of MEA formed in absorption and desorption columns
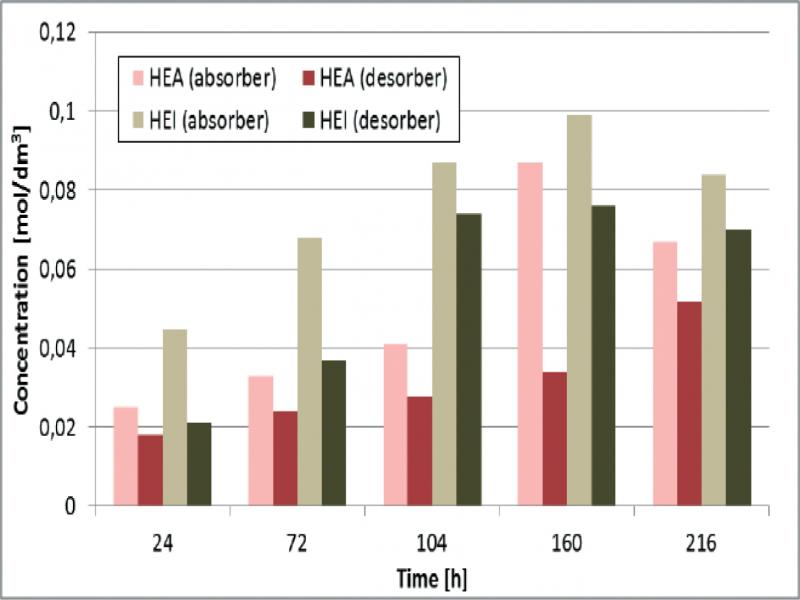
Figure 3.
Comparison of high molecular oxidative degradation products of MEA formed in absorption and desorption columns
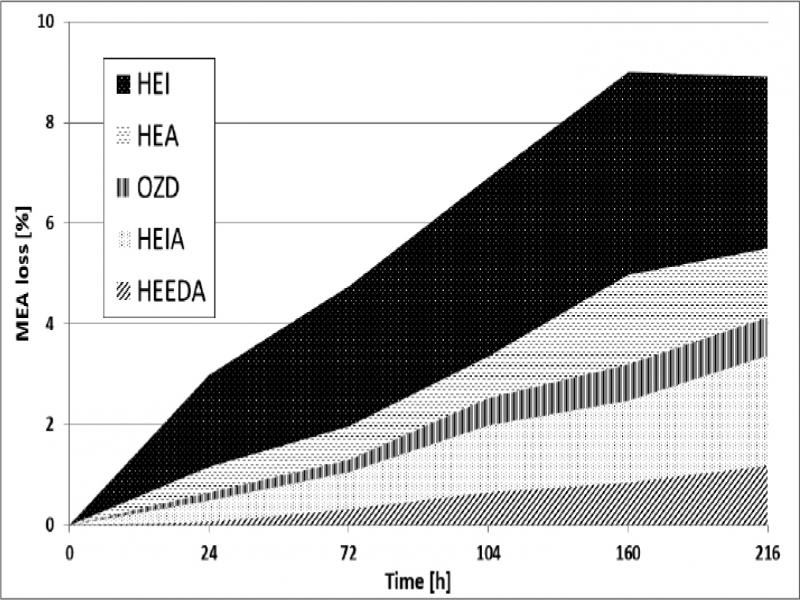
Figure 4.
The calculated loss of MEA in the lean solvent (in the desorber)
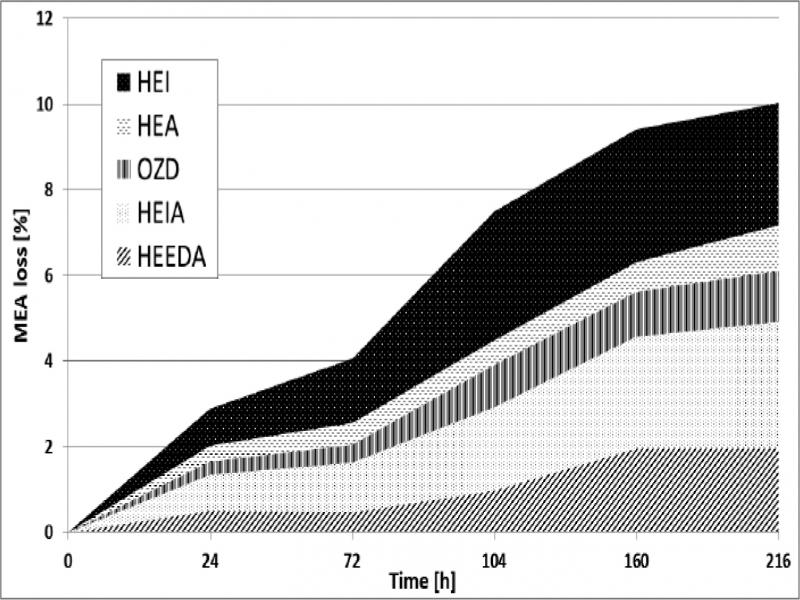
Figure 5.
The calculated loss of MEA in the rich solvent (in the absorber)