
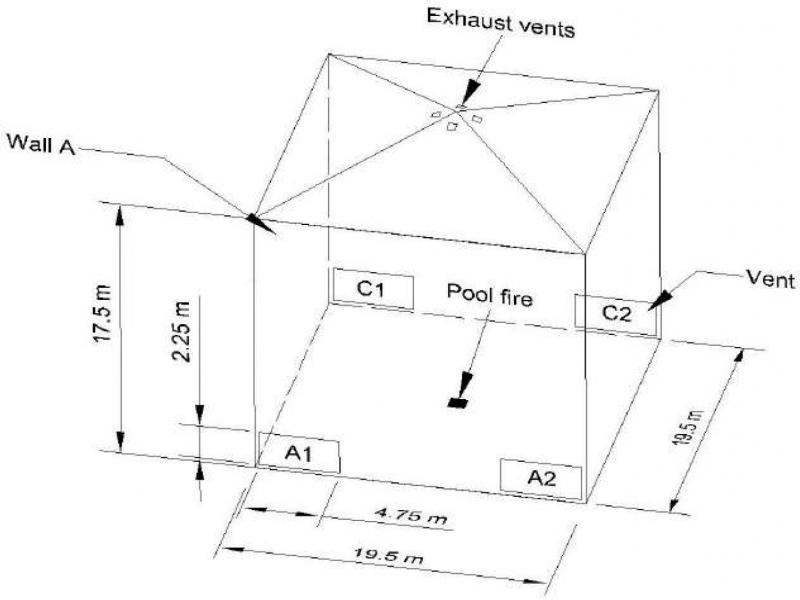
Figure 1.
Layout and main dimensions of the model
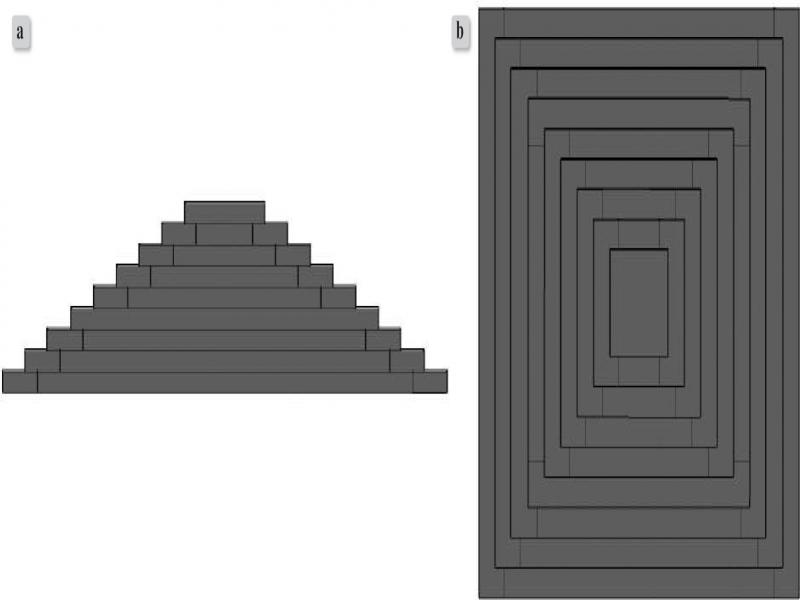
Figure 2.
The construction of the atrium roof: a) front view, b) view from above
Table 1.
Summary of the three considered cases.
| Case | Heat release rate | Burning time | Dimensions of the computational domain | Dimensions of the mesh cells | Number of cells in each direction |
|---|---|---|---|---|---|
| 1 | 2.34 MW | 900 s | 25×25×25 m | 0.25×0.25×0.25 m | X,Y,Z: 100 |
| 2 | 22×22×24 m | 0.2×0.2×0.2 m | X,Y: 110 Z: 120 | ||
| 3 | 25×25×25 m | 5 m around plume region: 0.125×0.125×0.125 m Remaining part of the model: 0.25×0.25×0.25 m | Near the plume region: X,Y: 40 Z: 200 Remaining part of the model: X,Y,Z: 100 |
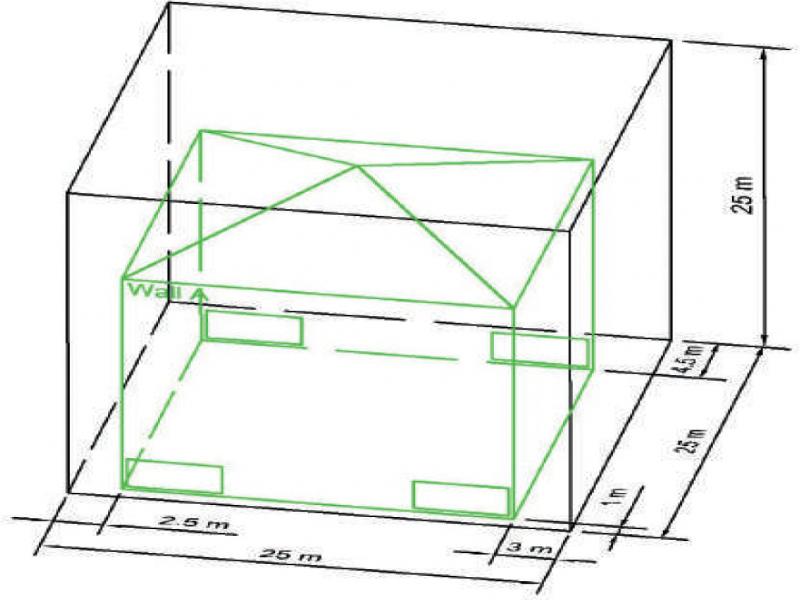
Figure 3.
Model situation in the computational domain in case 1
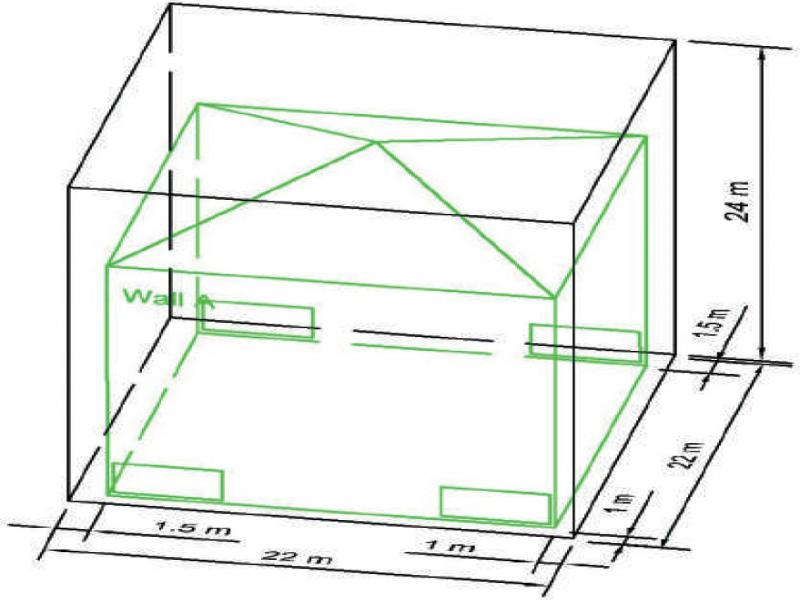
Figure 4.
Model situation in the computational domain in case 2
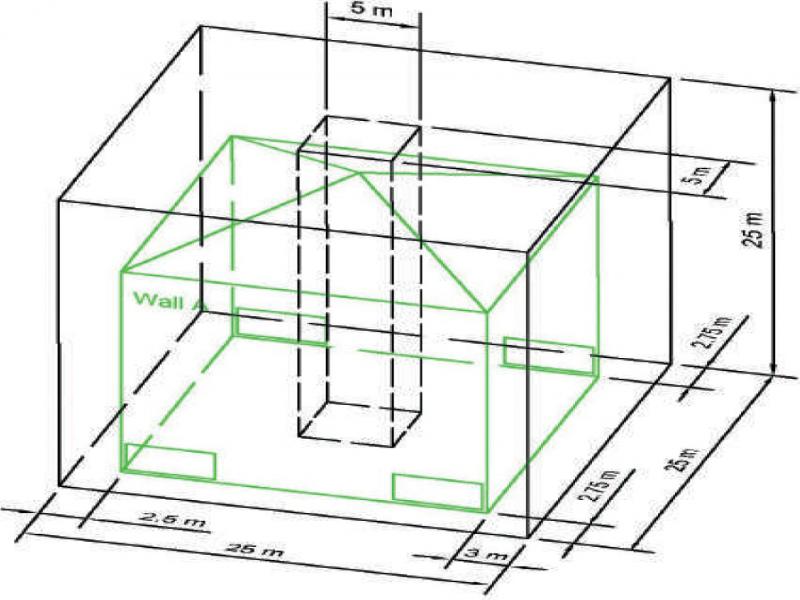
Figure 5.
Model situation in the computational domain in case 3
Table 2.
Relationship between D* and δx
| Case | Cell size, m δx | Heat Release Rate, kW | Characteristic fire diameter, m D* | D*/ δx |
|---|---|---|---|---|
| 1 | 0.25 | 2600 | 1.35 | 5.40 |
| 2 | 0.20 | 6.75 | ||
| 3 | 0.125 | 10.80 | ||
| 0.25 | 5.40 |
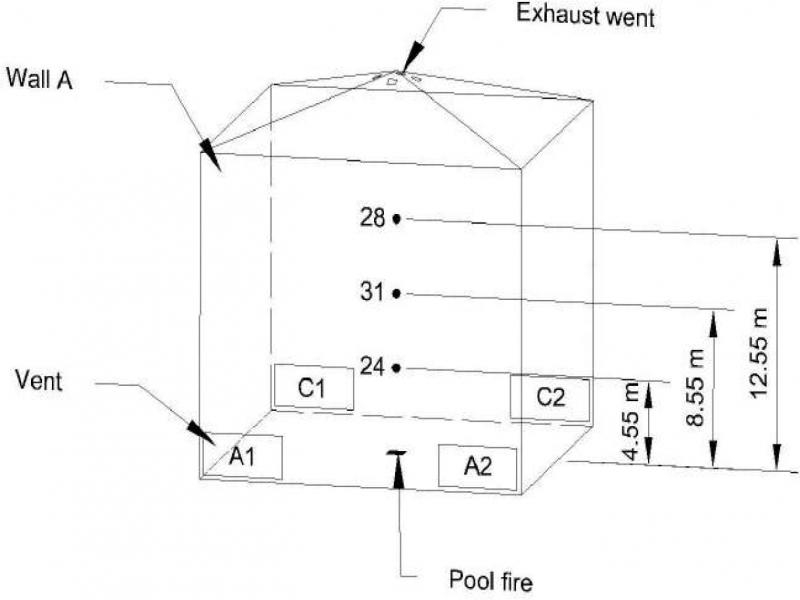
Figure 6.
Layout of the sensors in the plume region
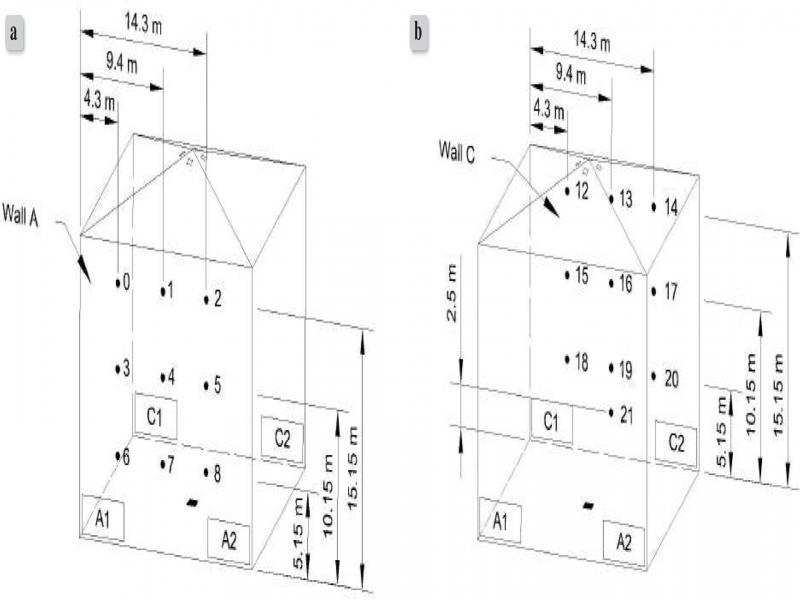
Figure 7.
Layout of the sensors near the wall: a) wall A, b) wall C
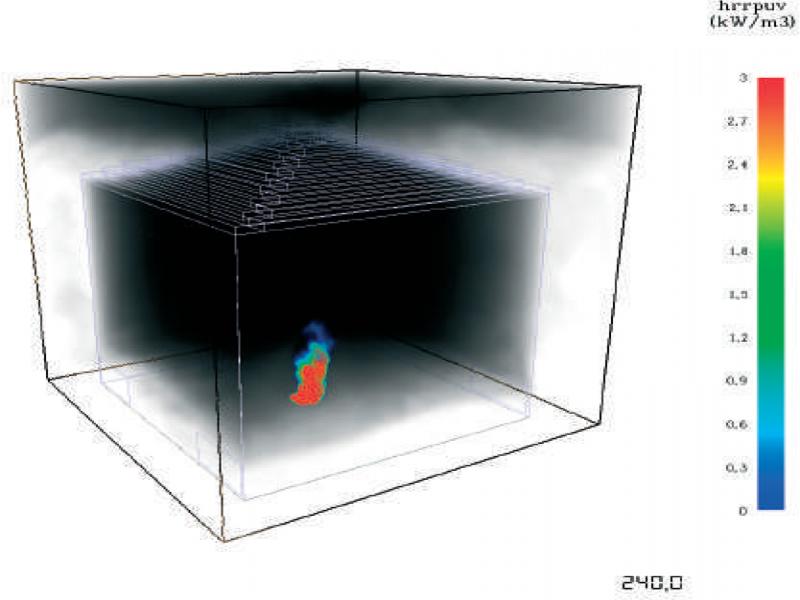
Figure 8.
FDS results. Case 3: soot density at fire time 240s
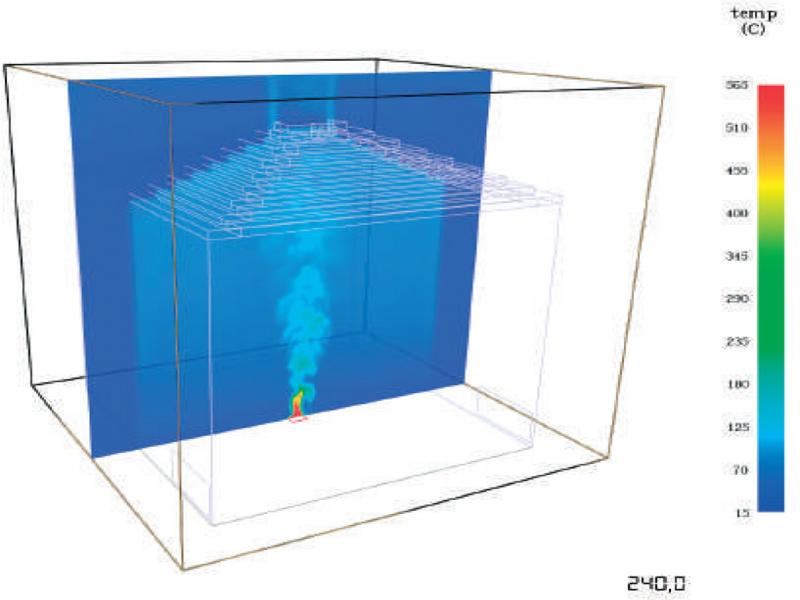
Figure 9.
FDS results. Case 3: temperature at time 240s in the section plane of a pool fire
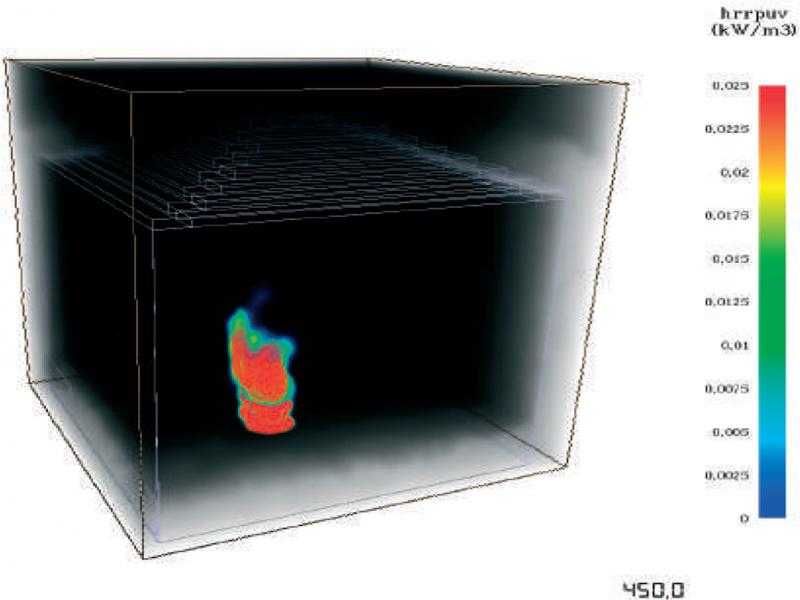
Figure 10.
FDS results. Case 2: soot density at fire time 450s
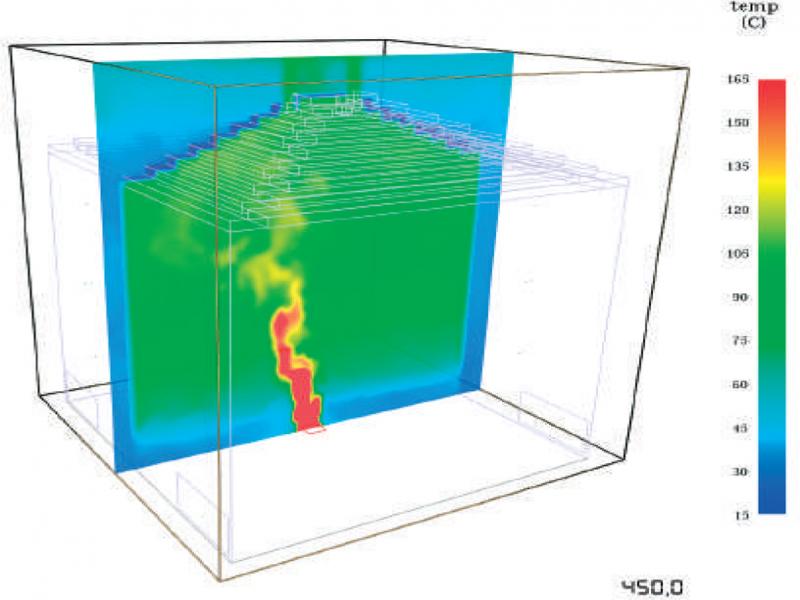
Figure 11.
FDS results. Case 2: temperature at time 450s in the section plane of a pool fire
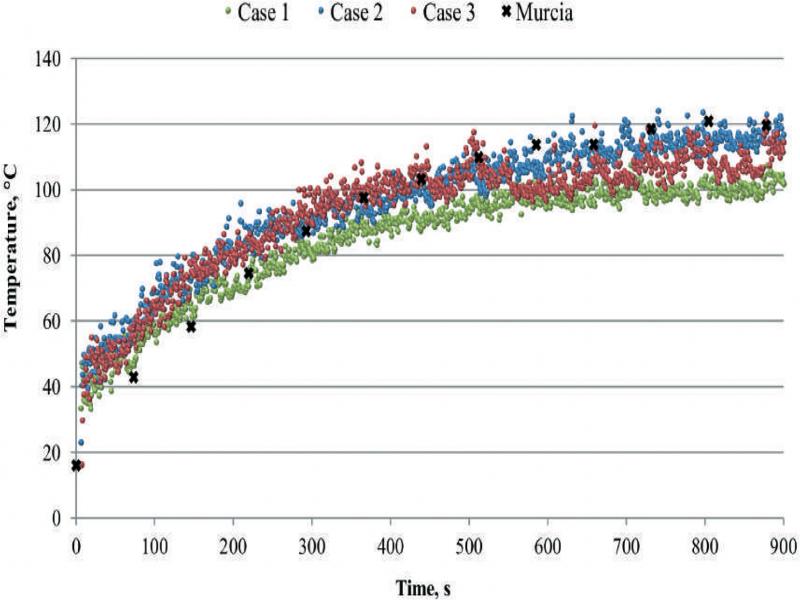
Figure 12.
Temperature predictions in the exhaust vent
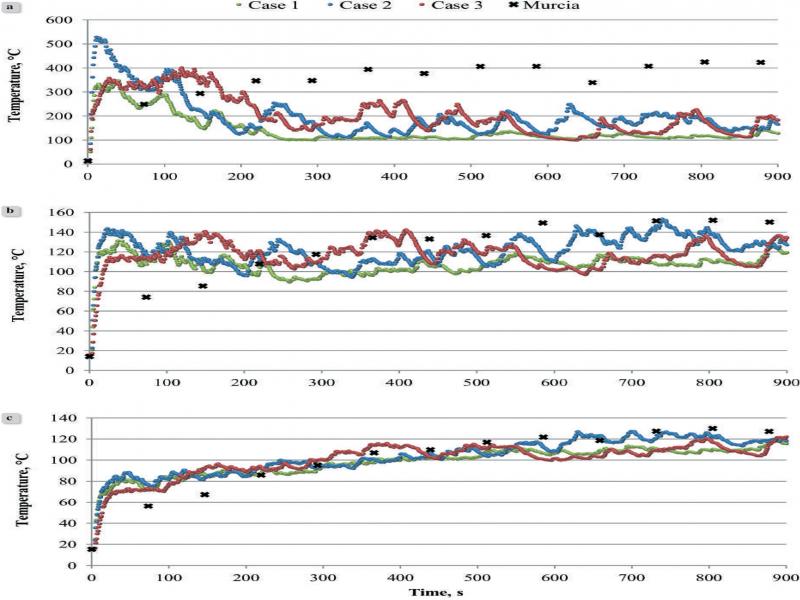
Figure 13.
Temperature predictions in the plume: a) 4.55 m above the pool fire, b) 8.55 m above pool fire, c)12.55 m above pool fire
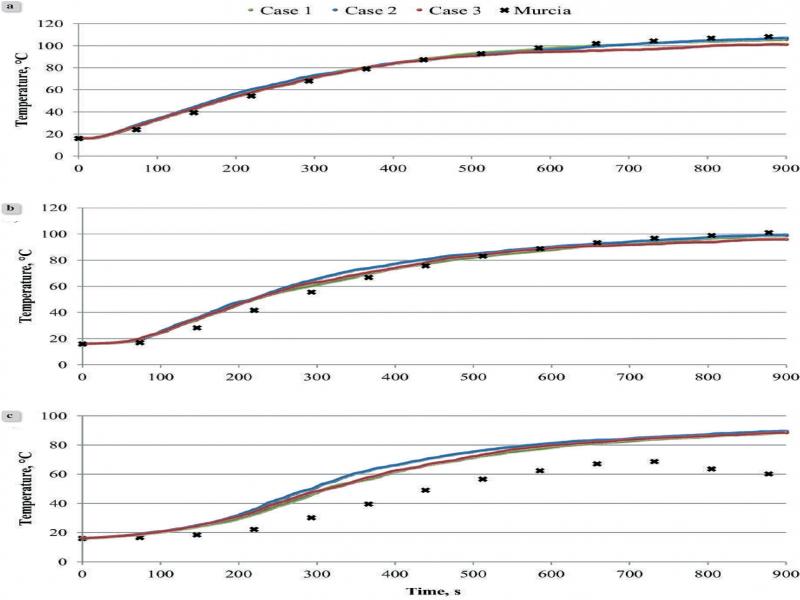
Figure 14.
Air temperature predictions close to wall A: a) h = 15.15 m, b) h = 10.15 m, c) h = 5.15 m