1. INTRODUCTION
Nitrogen is a chemical element commonly occurring in natural environment. Its main source is gaseous nitrogen making up to 80% of the earth’s atmosphere and chemically bounded nitrogen being the component of vegetable and animal proteins. The fact that nitrogen undergoes fast and multidirectional transformations is one of its main features (Fig. 1). Such transformation occurs especially in the processes of atrophy and decomposition of organisms and the products of their metabolism (R). Ammonification results in forming of ammonia nitrogen according to the reaction [1]:
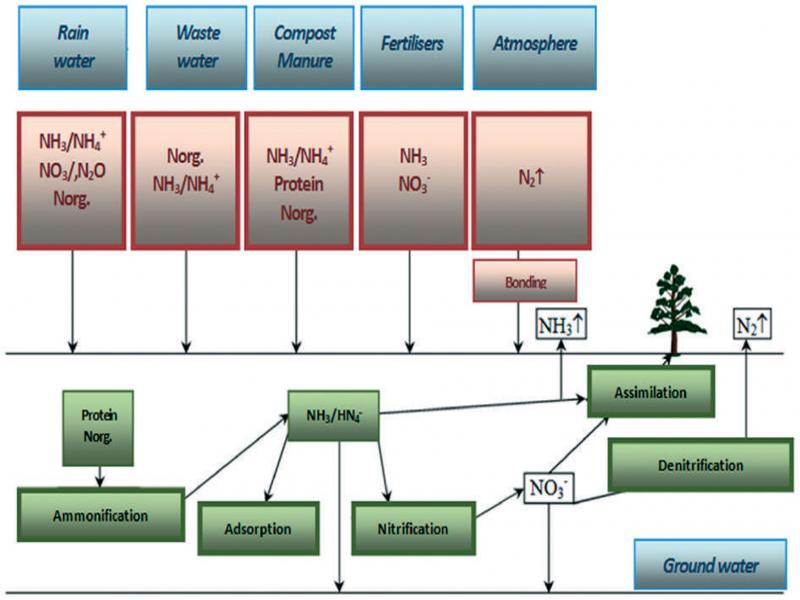
Figure 1.
Nitrogen cycle in the environment [3]
Ammonia nitrogen can be assimilated by plants and microorganisms. Then, it is changed into nitrate nitrogen at favourable conditions biological decomposition is a commonly used method to remove inorganic nitrogen compounds from wastewater. Ammonia nitrogen occurring in wastewater is partly used to build new microorganism cells and part of it is removed in the gaseous form. In the initial phase nitrogen compounds are transformed to ammonia. Next, ammonia compounds are oxidized to nitrite and nitrate in aerobic conditions in the process of nitrification. In the following phase they are reduced to molecular nitrogen in anaerobic conditions in the process of denitrification [2, 3].
Nitrogen being a biogenic element is also essential for living organisms. Its deficiency results in growth and metabolism processes disorders. Its excess in the environment, however, is even more dangerous since it could contribute to environmental contamination. High amounts of nitrogen discharged into surface water in various forms including ammonia nitrogen lead to reduction of oxygen concentration in the rivers. It also disrupts the water environment balance resulting in oxygen deficiency which inhibits the self-purification of water. Moreover, ground water resources, used for water supply, could also be contaminated by anthropogenic nitrogen compounds [4].
Therefore, it is commonly agreed that the wastewater treatment plants should be supplied with highly effective technologies of nitrogen removal [5]. The innovative technologies to remove ammonia nitrogen, coming from sludge dewatering and thickening processes, in the sidestream processes are applied to increase efficiency of total nitrogen removal and to reduce its concentration in the treated wastewater discharged into the rivers.
The main application of deammonification is in the nitrogen removal in wastewaters with high NH4 + and low COD concentrations (i.e. low COD/N ratio). These types of wastewaters are produced notably in the anaerobic digestion process as reject water [6, 7]. In addition to the anaerobic sludge digester liquors, the sidestream systems may also be applied for the treatment of other warm and high-strength ammonia wastewater with low C:N ratios, such as landfill leachate or some industrial wastewater [8, 9, 10, 11].
Conventional nitrogen removal by denitrification is unsuitable for the treatment of these wastewater streams, because significant amounts of external carbon source (e.g. methanol) will have to be added to increase the COD/N ratio. Deammonification however enables the nitrogen removal of such wastewaters without external carbon source. In wastewater treatment plants (WWTPs), deammonification is widely applied in the separate treatment of reject water from anaerobic digestion of sludge [12]. The typical sidestream deammonification (SD) application in reject water treatment is illustrated in Figure 2.
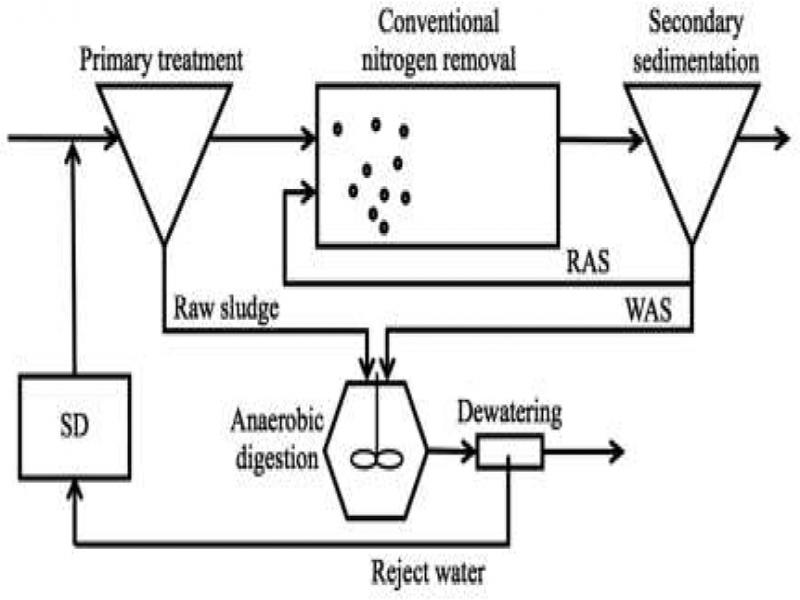
Figure 2.
Typical side stream deammonification (SD) application in a WWTP with activated sludge process [13]. SD: sidestream deammonification; RAS: return activated sludge; WAS: waste activated sludge
Normally, reject water is led to the WWTP mainstream without separate treatment. Deammonification in sidestream can remove up to 90% of the internal nitrogen load in reject water. This way, nitrogen removal process in the WWTP mainstream has more effectiveness removal of nitrogen loads in the influent. Deammonification in sidestream is implemented in full-scale since 2002, when the first application started operation in the Netherlands. This technology is now considered as the most innovative technology for reject water treatment [12]. In the presented paper the operating problems in “Śródmieście” WWTP, resulting from ammonia nitrogen load are described.
Some efforts to find a proper, contemporary solution to this problem are also described and discussed. One of the tested solutions is application of deammonification technology based on DEMON® reactor, applied in the technical scale. The main idea of the applied technology is to treat nitrogen riched effluent before it comes to a mainstream [14, 15, 16].
These innovative methods based on activated sludge are widely applied in such the process, e.g. SHARON®, BABE®, SHARON®-ANAMMOX® and also DEMON®. These methods clearly show better and better results to enable its wide application all over Europe (Austria, Switzerland, Germany) and also in Poland (since 2015, a DEMON® system, WWTP “Kujawy”, Krakow, south of Poland) [15].
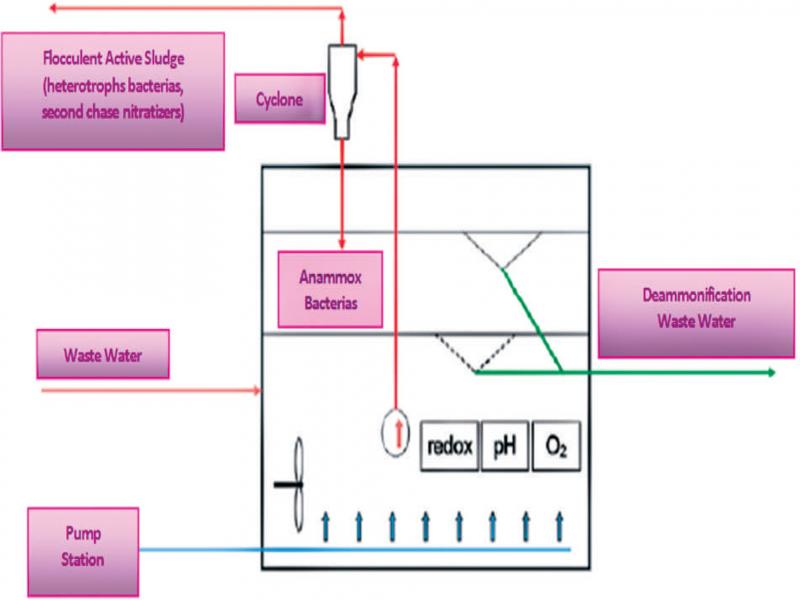
Nowadays DEMON technology seems to be the most widely applied technology due to simplicity of its SCADA system applied in an SBR type reactor, at strictly controlled pH, and high efficiency of nitrogen removal. Low oxygen demand attributed to a short denitrification phase and application of hydrocyclones, resulted in easily and efficient retention of “anammox” bacteria, are clear advantages of the process.
2. WASTEWATER TREATMENT PLANT IN ZABRZE
This plant is situated in the central part of sewer agglomeration of more than 100.000 PE. The inflow wastewater consists of high load of carbon and biogenic substances. On the other hand, the main flow is supplied with the effluents coming from sludge thickening and dewatering. The current hydraulic load is equal to 50% of the designed capacity. Thus, the efficiency of biological removal of nitrogen compounds is strongly reduced.
2.1. Short description of applied technology
The technology is based of multiphase activated sludge process, with a simultaneous removal of organic carbon, nitrogen and phosphorous compounds, well known as a Johannesburg process (JHB) [17]. The current flow capacity is 33 400 m3/d. The inflowing wastewater flows through preliminary screens and next through three operating simultaneously steps creens and two-chamber aerated sand trapper. In the next phase wastewater is pumped into a primary settling tank where the suspension solids are sedimented and form volatile fatty acids (VFAs) to increase the efficiency of the denitrification process. Then, the flow from the primary settling tank is directed into the biological reactors, through the sequence of chambers, i.e. dephosphatation, denitrification and nitrification. After that wastewater flows into secondary decanters to be clarified and then it is discharged in to the river and partly used as a technological water, taken by a local district heating plant. The sludge formed in the secondary decanters is returned to the pre-denitrification chamber which is located before the dephosphorization chamber. The residual amounts of nitrates are reduced there to increase the efficiency of biological dephosphatation. Moreover, the biological process of phosphorous removal is supported by a chemical precipitation using polyaluminium chloride.
The sludge separated in the primary settling tank is directed to fermenters where VFAs are generated. VFAs, being a rich source of organic carbon, are fed into denitrification chambers. The remaining part of sludge collected in fermenters becomes a part of batch for the closed and heated up fermentation chambers. Excess sludge from secondary decanters is also directed there. A mixture of raw and excess sludge undergoes mesophile fermentation for about 30 days of anaerobic decomposition. The fermented sludge is dehydrated in centrifuges and then processed with addition of lime. The main product of the fermentation process is biogas containing minimum of 62% of methane which is used as fuel in cogenerator units. The WWTP in Zabrze illustrated in Figure 3.
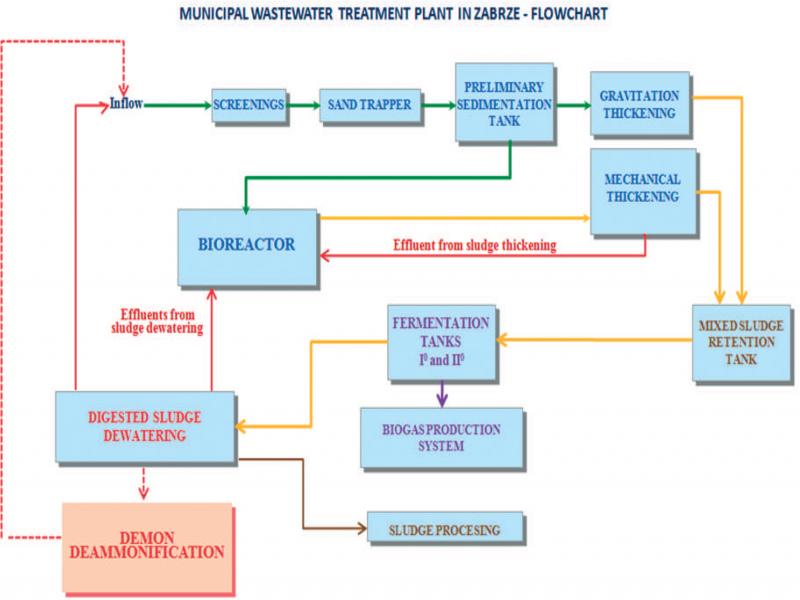
Figure 3.
Municipal “Śródmieście” WWTP in Zabrze – flowchart
2.2. Concentrations and loads of ammonia nitrogen in the years of 2017–2018
Loads and concentrations of ammonium nitrogen in the years of 2017 and 2018 at various technological stages of the process are described in Tables 1 and 2. Ammonium nitrogen concentration in the inflow show typical values for municipal wastewater – at the level of 60 g/m3. The value is by 8% lower than after a preliminary sedimentation tank, as expected. The average annual value of ammonium nitrogen in the out let is at the level of 0.4 g/m3 to confirm the correct operating results.
Table 1.
Comparison of N-NH4 + concentrations at the corresponding points of the technological cycle
| 2017 | 2018 | 2017 | 2018 | 2017 | 2018 | 2017 | 2018 | 2017 | 2018 | |
|---|---|---|---|---|---|---|---|---|---|---|
| Raw wastewater | Wastewater after sedimentation tank | Treated wastewater | Wastewater after sludge thickener | Effluent after centrifuge | ||||||
| Ammonium nitrogen [g N-NH4 +/m3] | ||||||||||
| January | 64.1 | 57.9 | 62.6 | 63.0 | 0.5 | 0.4 | 0.8 | 1.2 | 1006.0 | 1368.5 |
| February | 44.0 | 55.1 | 43.0 | 53.2 | 0.5 | 0.3 | 0.8 | 0.8 | 1079.5 | 1376.5 |
| March | 45.5 | 64.9 | 45.0 | 62.5 | 0.4 | 0.8 | 0.8 | 0.7 | 1153.0 | 1586.0 |
| April | 42.0 | 70.2 | 43.5 | 57.6 | 0.3 | 0.3 | 1.0 | 0.2 | 1189.5 | 1596.0 |
| May | 41.8 | 64.6 | 41.4 | 43.6 | 0.4 | 0.3 | 1.9 | 0.9 | 1093.0 | 1004.0 |
| June | 59.8 | 60.6 | 56.6 | 55.2 | 0.4 | 0.3 | 1.1 | 0.1 | 1187.5 | 988.0 |
| July | 59.4 | 62.7 | 46.7 | 58.3 | 0.3 | 0.5 | 1.8 | 1.2 | 1016.0 | 905.5 |
| August | 64.9 | 55.6 | 70.1 | 58.3 | 0.6 | 0.3 | 1.5 | 1.4 | 1013.0 | 937.0 |
| September | 54.5 | 68.1 | 41.5 | 60.8 | 0.2 | 0.3 | 0.9 | 0.3 | 1011.0 | 934.0 |
| October | 50.5 | 71.1 | 48.9 | 41.4 | 0.2 | 0.1 | 0.5 | 1.5 | 1054.5 | 910.0 |
| November | 55.8 | 69.9 | 48.5 | 70.1 | 0.4 | 0.0 | 1.2 | 0.2 | 1166.5 | 918.0 |
| December | 50.9 | 69.5 | 46.8 | 64.0 | 0.5 | 0.2 | 2.1 | 1.6 | 1306.5 | 602.0 |
| Average | 52.8 | 64.2 | 49.5 | 57.3 | 0.4 | 0.3 | 1.1 | 0.8 | 1106.3 | 1093.8 |
| Min. | 41.8 | 55.1 | 41.4 | 41.4 | 0.2 | 0.0 | 0.5 | 0.1 | 1006.0 | 602.0 |
| Max | 64.9 | 71.1 | 70.1 | 70.1 | 0.6 | 0.8 | 2.1 | 1.6 | 1306.5 | 1596.0 |
| 2017 | 2018 | 2017 | 2018 | 2017 | 2018 | 2017 | 2018 | 2017 | 2018 | |
|---|---|---|---|---|---|---|---|---|---|---|
| Raw wastewater | Wastewater after sedimentation tank | Treated wastewater | Wastewater after sludge thickener | Effluent after centrifuge | ||||||
| Ammonium nitrogen [g N-NH4 +/d] | ||||||||||
| January | 1086.4 | 1159.5 | 1060.1 | 1262.7 | 8.1 | 8.3 | 20.9 | 36.9 | 206.7 | 265.3 |
| February | 861.7 | 986.7 | 842.1 | 951.8 | 8.8 | 6.0 | 15.9 | 19.5 | 218.5 | 246.5 |
| March | 1024.2 | 1156.2 | 990.4 | 1113.4 | 8.7 | 13.9 | 16.4 | 21.5 | 230.3 | 279.9 |
| April | 1064.7 | 1294.4 | 1102.7 | 1062.1 | 6.2 | 4.7 | 22.0 | 4.6 | 190.2 | 349.5 |
| May | 956.7 | 1251.8 | 947.5 | 844.6 | 9.9 | 6.5 | 36.5 | 25.9 | 187.2 | 187.9 |
| June | 1172.6 | 1081.8 | 1109.9 | 986.2 | 8.0 | 4.9 | 19.5 | 3.0 | 140.2 | 151.6 |
| July | 1104.9 | 1227.7 | 867.8 | 1142.4 | 4.6 | 9.8 | 51.5 | 32.1 | 210.8 | 157.9 |
| August | 1175.7 | 928.1 | 1269.9 | 972.5 | 9.9 | 4.2 | 54.7 | 38.2 | 230.5 | 183.3 |
| September | 1433.1 | 1275.1 | 1089.9 | 1137.5 | 5.7 | 4.8 | 37.3 | 8.3 | 226.3 | 161.1 |
| October | 1219.2 | 1264.6 | 1180.6 | 738.8 | 5.4 | 1.4 | 18.9 | 50.7 | 232.7 | 173.1 |
| November | 1264.8 | 1208.8 | 1100.3 | 1211.4 | 9.8 | 0.3 | 47.9 | 5.1 | 204.8 | 176.2 |
| December | 1178.7 | 1433.2 | 1083.7 | 1319.7 | 10.6 | 4.9 | 86.4 | 25.7 | 226.6 | 97.19 |
| Average | 1128.6 | 1188.9 | 1053.6 | 1061.9 | 7.9 | 5.8 | 35.7 | 22.6 | 208.7 | 202.5 |
| Min. | 861.7 | 928.1 | 842.1 | 738.8 | 4.6 | 0.3 | 15.9 | 3.0 | 140.2 | 97.2 |
| Max | 1433.1 | 1433.2 | 1269.9 | 1319.7 | 10.6 | 13.9 | 86.4 | 50.7 | 232.7 | 349.5 |
| 2017 | 2018 | 2017 | 2018 | 2017 | 2018 | 2017 | 2018 | 2017 | 2018 | |
|---|---|---|---|---|---|---|---|---|---|---|
| Raw wastewater | Effluent after centrifuge | Treated wastewater | % of N- NH4 + in total nitrogen | % of N- NH4 + reduction | ||||||
| Ammonium nitrogen [g N-NH4 +/d] | ||||||||||
| January | 1086.4 | 1159.5 | 206.7 | 265.3 | 8.1 | 8.3 | 19.0 | 22.9 | 99.3 | 99.3 |
| February | 861.7 | 986.7 | 218.5 | 246.5 | 8.8 | 6.0 | 25.4 | 24.9 | 98.9 | 99.4 |
| March | 1024.2 | 1156.2 | 230.3 | 279.9 | 8.7 | 13.9 | 22.5 | 24.2 | 99.2 | 98.8 |
| April | 1064.7 | 1294.4 | 190.2 | 349.5 | 6.2 | 4.7 | 17.9 | 27.0 | 99.4 | 99.6 |
| May | 956.7 | 1251.8 | 187.2 | 187.9 | 9.9 | 6.5 | 19.6 | 15.0 | 98.9 | 99.5 |
| June | 1172.6 | 1081.8 | 140.2 | 151.6 | 8.0 | 4.9 | 11.9 | 14.0 | 99.3 | 99.5 |
| July | 1104.9 | 1227.7 | 210.8 | 157.9 | 4.6 | 9.8 | 19.1 | 12.9 | 99.6 | 99.2 |
| August | 1175.7 | 928.1 | 230.5 | 183.3 | 9.9 | 4.2 | 19.6 | 19.8 | 99.2 | 99.5 |
| September | 1433.1 | 1275.1 | 226.3 | 161.1 | 5.7 | 4.8 | 15.8 | 12.6 | 99.6 | 99.6 |
| October | 1219.2 | 1264.6 | 232.7 | 173.1 | 5.4 | 1.4 | 19.1 | 13.7 | 99.6 | 99.9 |
| November | 1264.8 | 1208.8 | 204.8 | 176.2 | 9.7 | 0.3 | 16.2 | 14.6 | 99.2 | 99.9 |
| December | 1178.7 | 1433.2 | 226.6 | 97.2 | 10.6 | 4.9 | 19.2 | 6.8 | 99.1 | 99.7 |
| Average | 1128.6 | 1188.9 | 208.7 | 202.5 | 7.99 | 5.8 | 18.8 | 17.4 | 99.3 | 99.5 |
| Min. | 861.7 | 928.1 | 140.2 | 97.2 | 4.6 | 0.3 | 11.9 | 6.8 | 98.9 | 98.8 |
| Max | 1433.1 | 1433.2 | 232.7 | 349.3 | 10.6 | 13.9 | 25.4 | 27.0 | 99.6 | 99.9 |