
Table 1.
The physico-chemical characteristics of effluent from wastewater treatment plant
| Indicator | Unit | Value |
|---|---|---|
| pH | - | 7.41 |
| Color | mgPt/L | 90.00 |
| Turbidity | NTU | 0.86 |
| Conductivity | μS/cm | 1031.20 |
| Absorbance in UV254 | 1/cm | 0.234 |
| Total hardness | mgCaCO3/L | 358.00 |
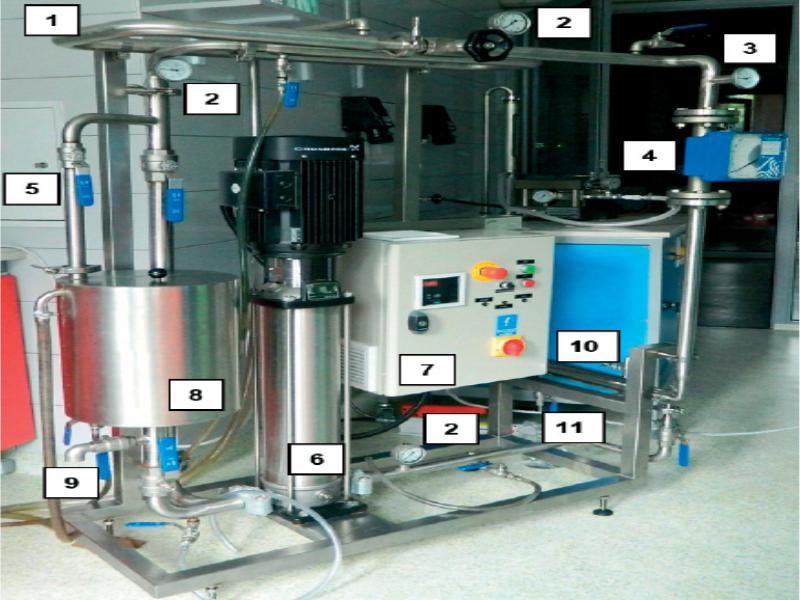
Figure 1.
The installation TMI 14 (1 – water coat, 2 – manometer, 3 – thermometer, 4 – flowmeter, 5 – regulating valves, 6 – high-pressure pump, 7 – control box with inverter, 8 – tank, 9 – drain from the tank, 10 – membrane module, 11 – permeate outlet)
Table 2.
Characteristics of the membranes (manufacturer data)
| Process | Membrane symbol | Membrane chemistry | Molecular weight cut-off (MWCO) [Da] | Max operating pressure [MPa] | pH range | Max temperature [ºC] | Salt retention coefficient [%] |
|---|---|---|---|---|---|---|---|
| Nanofiltration | AFC-30 | composite | 200 | 6.0 | 1.5-9.5 | 60 | 75.0 CaCl2 |
| Reverse osmosis | AFC-80 | - | 1.5-10.5 | 70 | 80.0 NaCl |
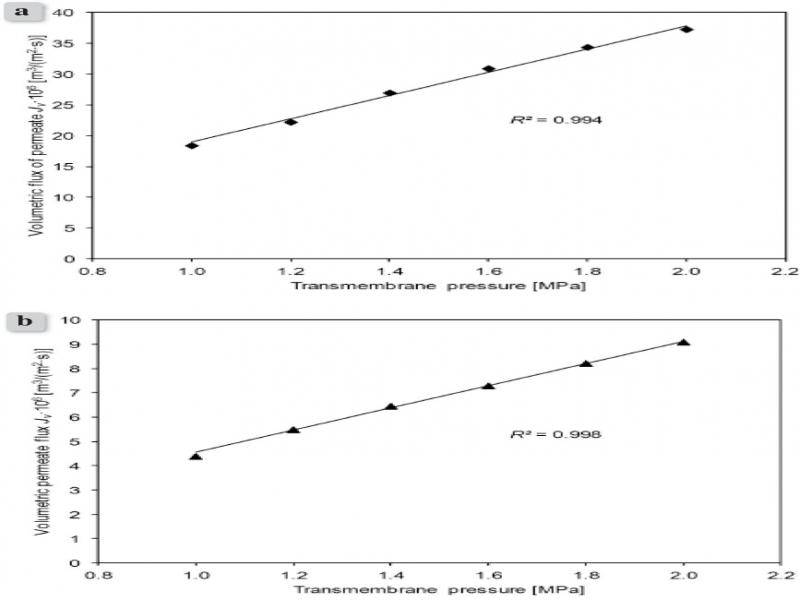
Figure 2.
Effect of transmembrane pressure on volumetric permeate flux of the membrane: a) nanofiltration, b) reverse osmosis
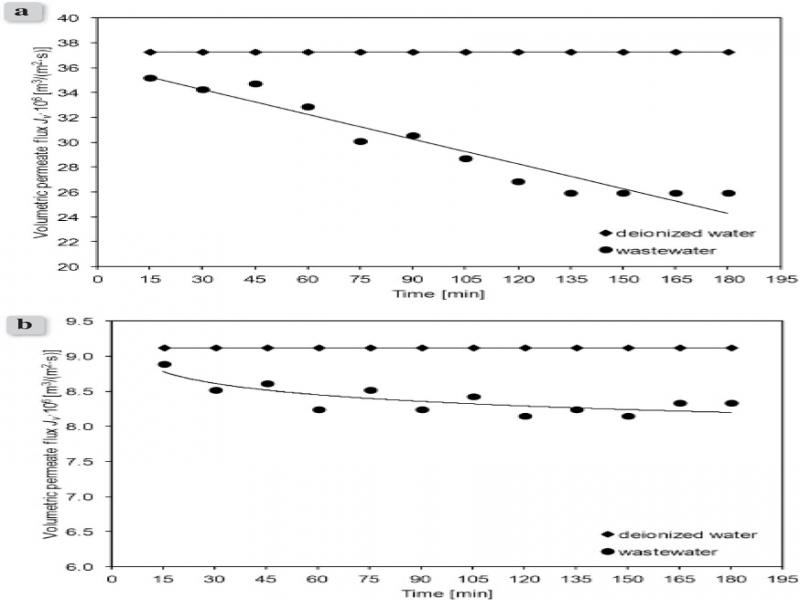
Figure 3.
Change of volumetric permeate flux of membrane during deionized water and wastewater filtration: a) nanofiltration, b) reverse osmosis
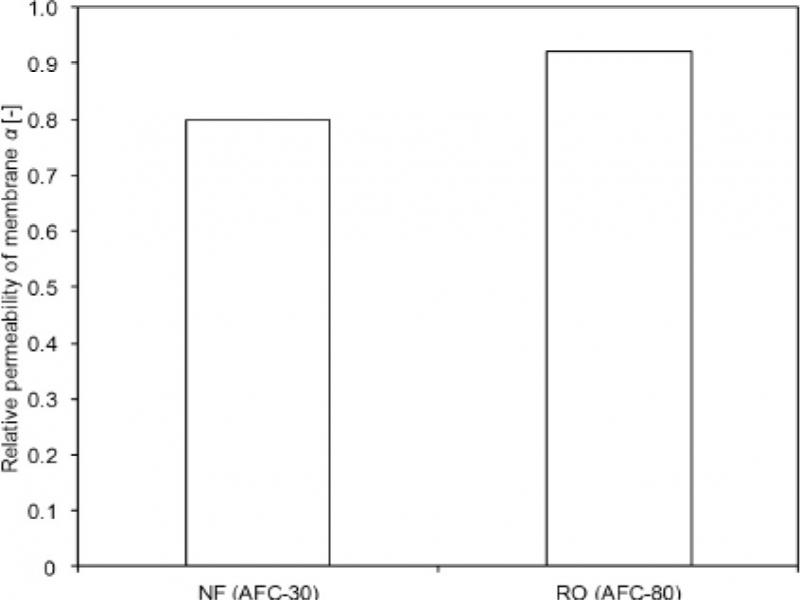
Figure 4.
Relative permeability of membranes α
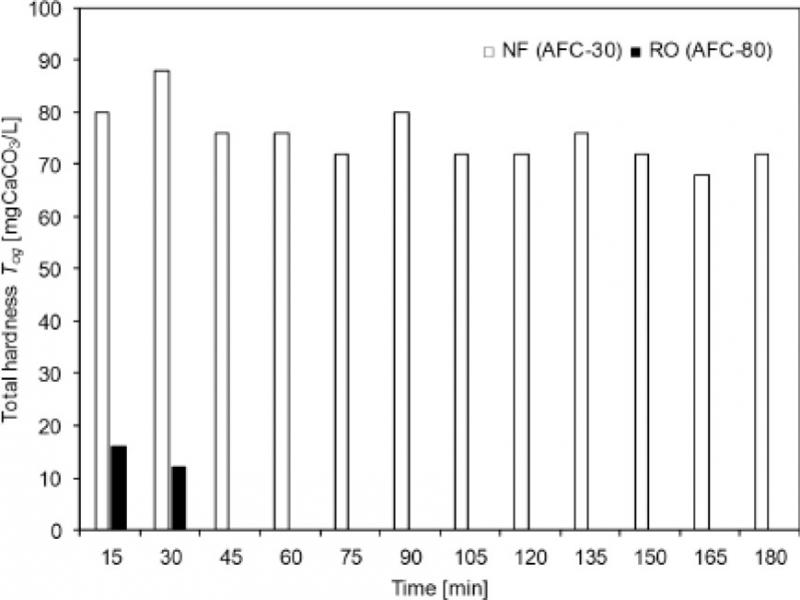
Figure 5.
The level of hardness of wastewater in permeate during membrane filtration