
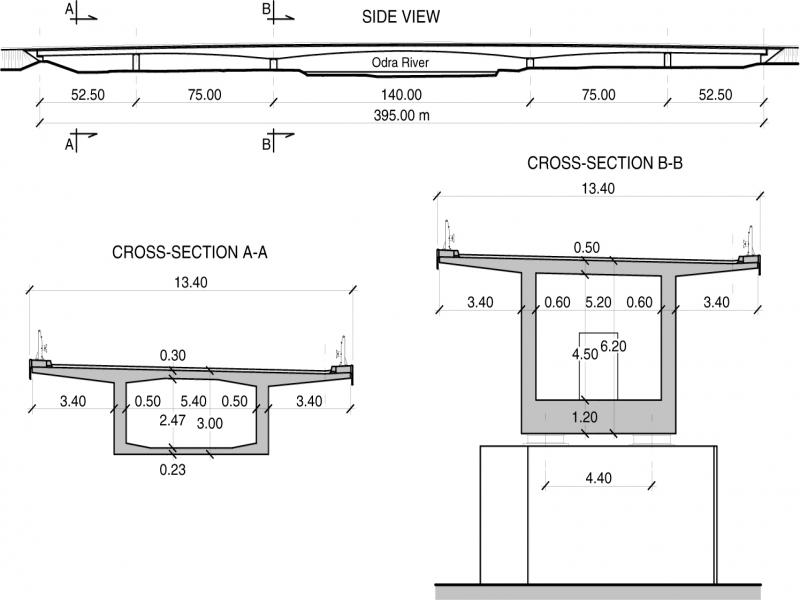
Figure 1
Geometry of Kedzierzyn-Kozle Bridge (Poland)
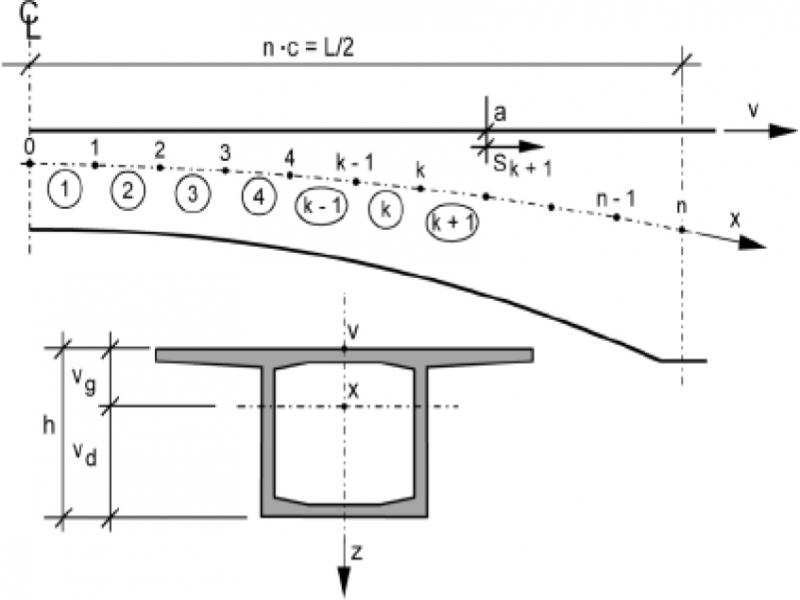
Figure 2.
Scheme of a cantilever bridge section
Table 1.
Geometric characteristics of cantilever concreting bridges built in Poland
| No | Location | G [m] | ω [‰] | L [m] |
|---|---|---|---|---|
| 1 | Grudziądz | 1174 | 0.848 | 180 |
| 2 | Płock - projekt | 1297 | 0.937 | 148.6* |
| 3 | Brzeg Dolny | 1189 | 0.859 | 140 |
| 4 | Kędzierzyn-Koźle | 1796 | 1.297 | 140 |
| 5 | Kraków | 1583 | 1.143 | 132 |
| 6 | Łany k. Wrocławia | 1187 | 0.857 | 120 |
| 7 | Milówka k. Wisły | 1059 | 0.765 | 82 |
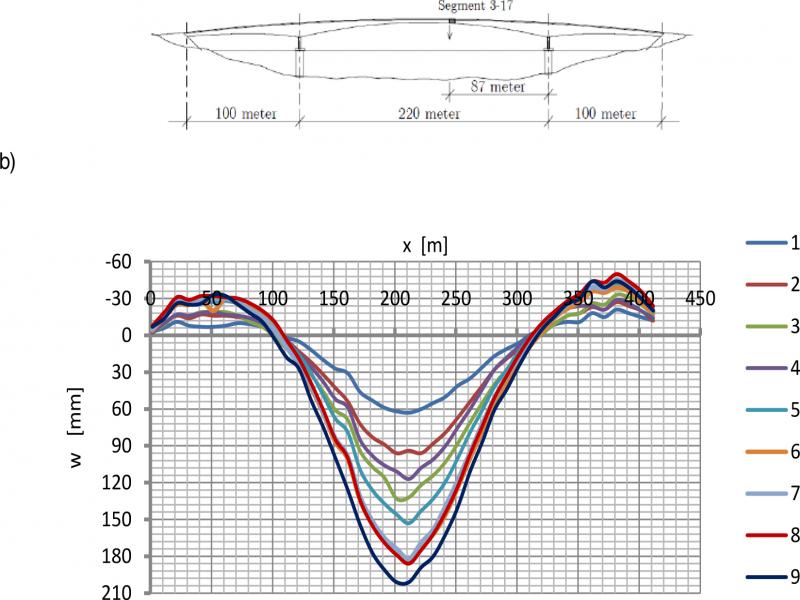
Figure 3.
Scheme of Støvset Bridge and the increase of deflections during its operation [9]
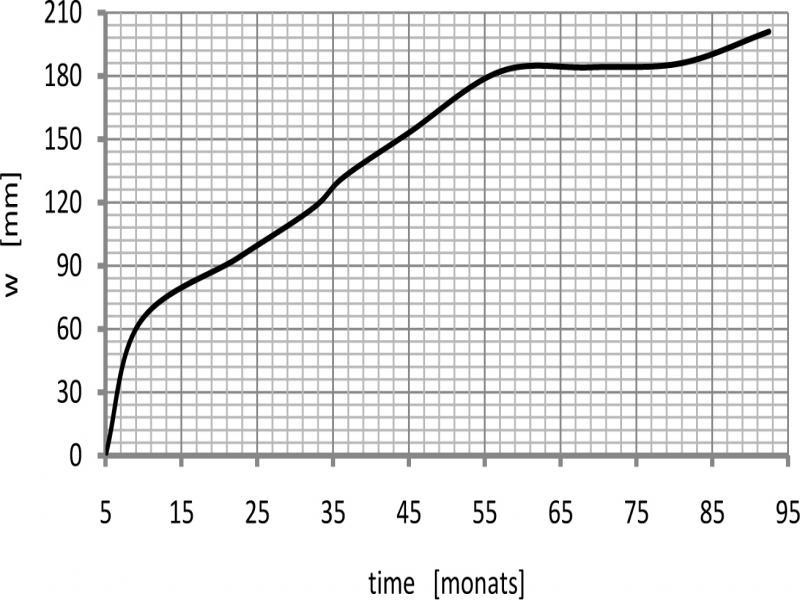
Figure 4.
Maximum deflections of the Støvset Bridge span as a function of time [9]
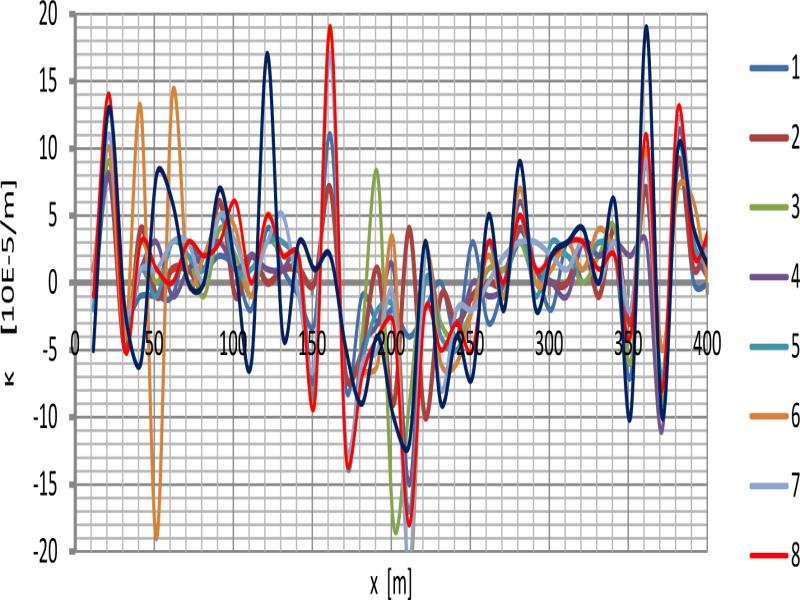
Figure 5.
Changes in the curvature of the Støvset bridge span in the analyzed time periods
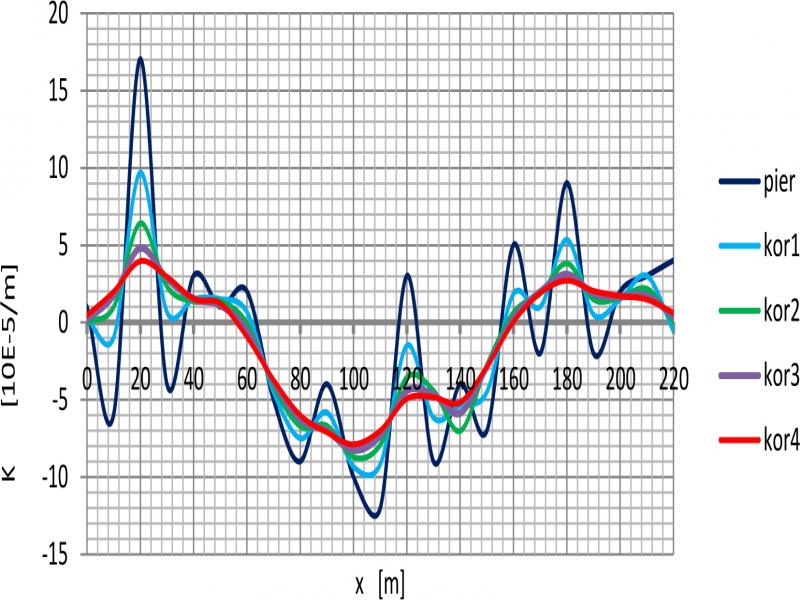
Figure 6.
Changes in the curvature of Støvset Bridge during the smoothing process
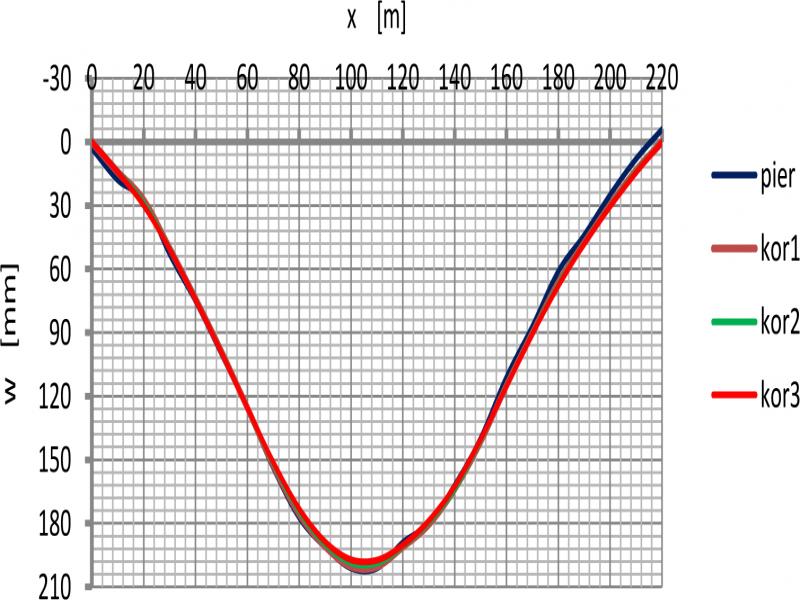
Figure 7.
Changes in the deflection of Støvset Bridge span during the smoothing process
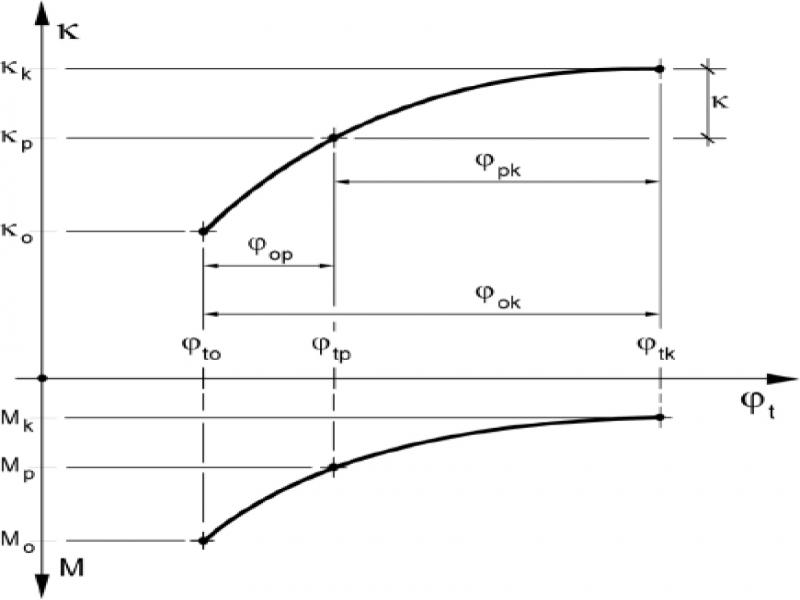
Figure 8.
Changes in curvature and bending moments as a function of creep
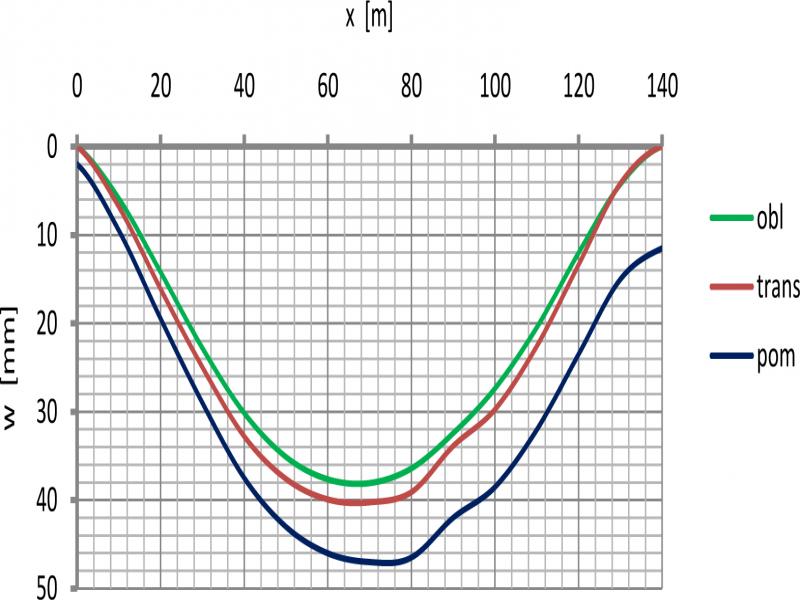
Figure 9.
Deflections of the Kedzierzyn-Kozle Bridge span
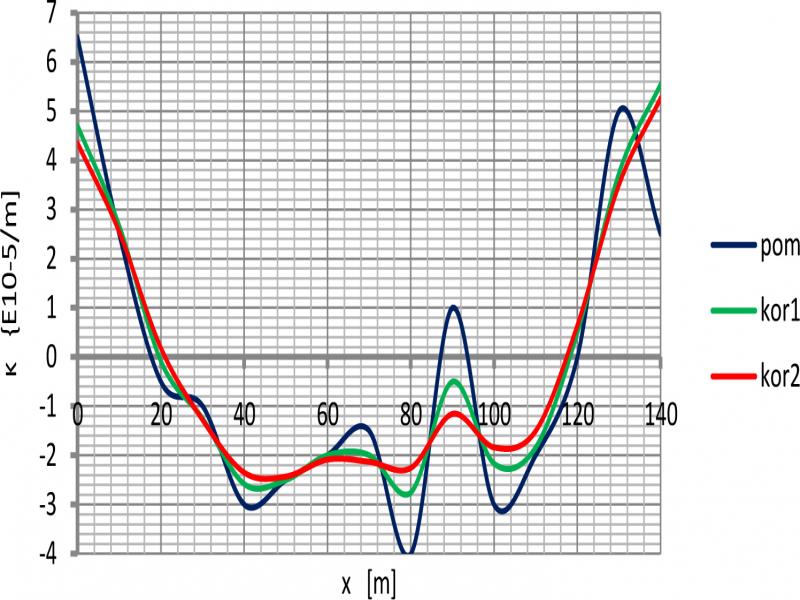
Figure 10.
Curvature of the span of Kedzierzyn-Kozle Bridge during the smoothing process
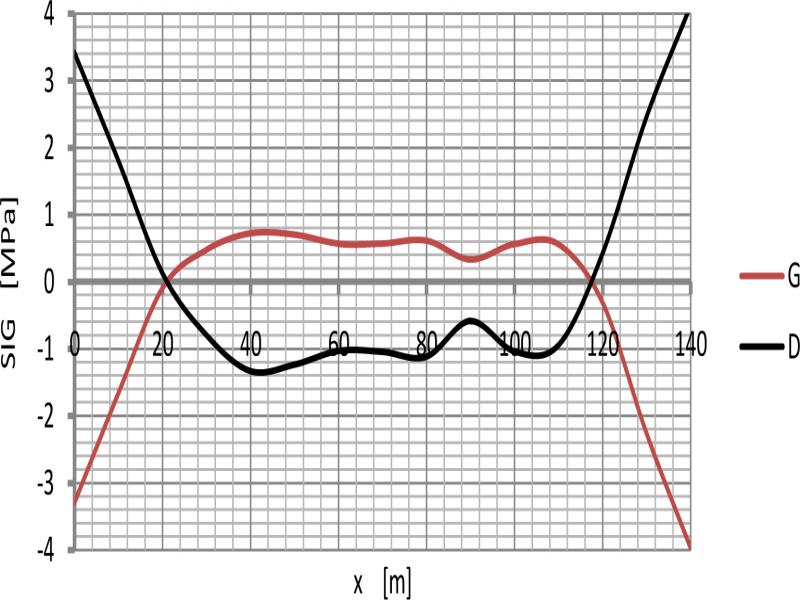
Figure 11.
Stresses on the top (G) and bottom (D) edges of the bridge span from Figure 1