
Table 1.
Physical properties of Portland cements used in the research
| Property | Cement designation | |||
|---|---|---|---|---|
| CEM I 42.5R NA | CEM I 52.5R | CEM I 42.5R “O” | CEM I 42.5N SR5/NA | |
| Density [g/cm3] | 3.09 | 3.07 | 3.07 | 3.11 |
| Volume constancy [mm] | 0.4 | 0.3 | 0.2 | 1 |
| Setting time [min] | 191 | 167 | 183 | 165 |
| Blaine’s specific surface [cm2/g] | 3950 | 4917 | 4390 | 3360 |
Table 2.
Chemical composition of Portland cements used in the research
| Ingredient | Ingredient content, % of cement mass | |||
|---|---|---|---|---|
| CEM I 42.5R NA | CEM I 52.5R | CEM I 42.5 R “O” | CEM I 42.5N SR5/NA | |
| SiO2 | 20.55 | 20.65 | 19.9 | 21.17 |
| Al2O3 | 4.67 | 5.13 | 6.2 | 3.56 |
| Fe2O3 | 2.8 | 2.61 | 2.7 | 3.23 |
| CaO | 64.35 | 64.01 | 62.6 | 66.03 |
| MgO | 1.18 | 1.49 | 1.5 | 0.74 |
| Na20 | 0.18 | 0.16 | 0.33 | 0.19 |
| K2O | 0.43 | 0.77 | 0.72 | 0.34 |
| Na2Oeq | 0.46 | 0.67 | 0.8 | 0.41 |
| SO3 | 2.79 | 2.21 | 2.6 | 2.55 |
| Cl | 0.015 | 0.082 | 0.05 | 0.063 |
Table 3.
Phase composition of Portland cements used in the research
| Phase content, % of cement mass | ||||
|---|---|---|---|---|
| Phase | CEM I 42.5R NA | CEM I 52.5R | CEM I 42.5R “O” | CEM I 42.5N SR5/NA |
| C3S | 62.43 | 64.12 | 60.65 | 57.51 |
| C2S | 12.16 | 11.18 | 11.62 | 17.62 |
| C3A | 7.64 | 9.18 | 11.87 | 3.98 |
| C4AF | 8.51 | 7.93 | 8.21 | 9.82 |
| CŜ2H | 4.74 | 3.76 | 4.42 | 4.34 |
Table 4.
Chemical composition of the limestones used in the research
| Ingredient | Ingredient content, % of mass | |
|---|---|---|
| Limestone B | Limestone T | |
| LOI | 41.7 | 42.7 |
| SiO2 | 4.58 | 1.4 |
| Al2O3 | 0.75 | 0.4 |
| Fe2O3 | 0.34 | 0.5 |
| CaO | 52.43 | 53.2 |
| MgO | 0.66 | 1.5 |
| SO3 | 0.12 | 0.02 |
| Cl- | 0.022 | 0.007 |
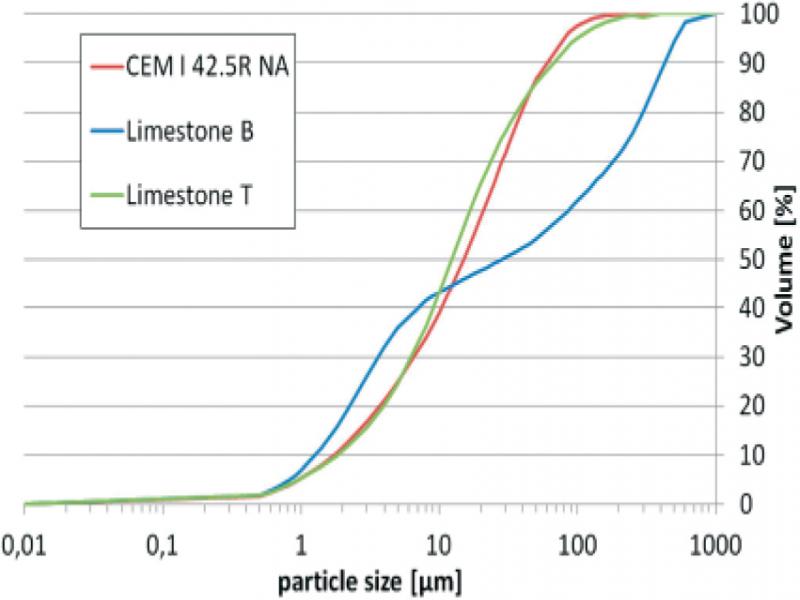
Figure 1.
Particle size distribution for limestones B and T and Portland cement CEM I 42.5R NA
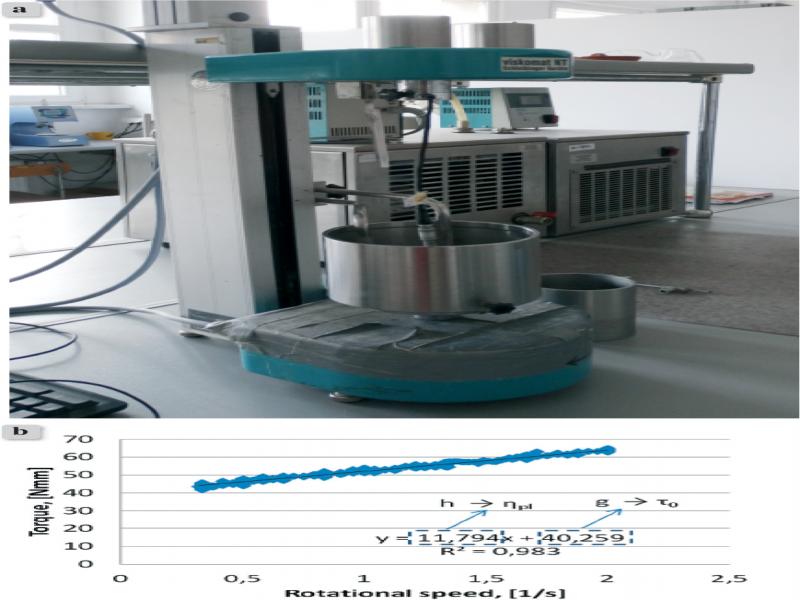
Figure 2.
Rheometer Viskomat NT used in the research (a) and exemplary measurement result (b)
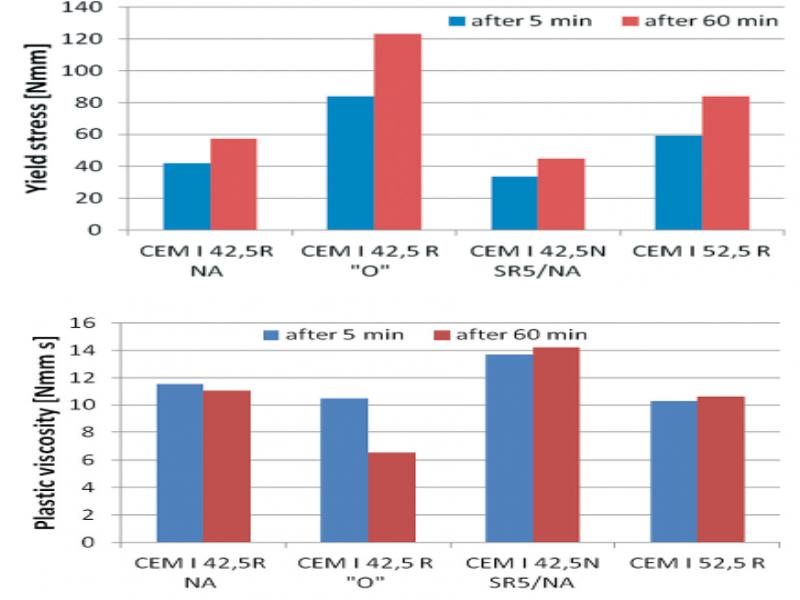
Figure 3.
Yield stress of mortars with Portland cements CEM I
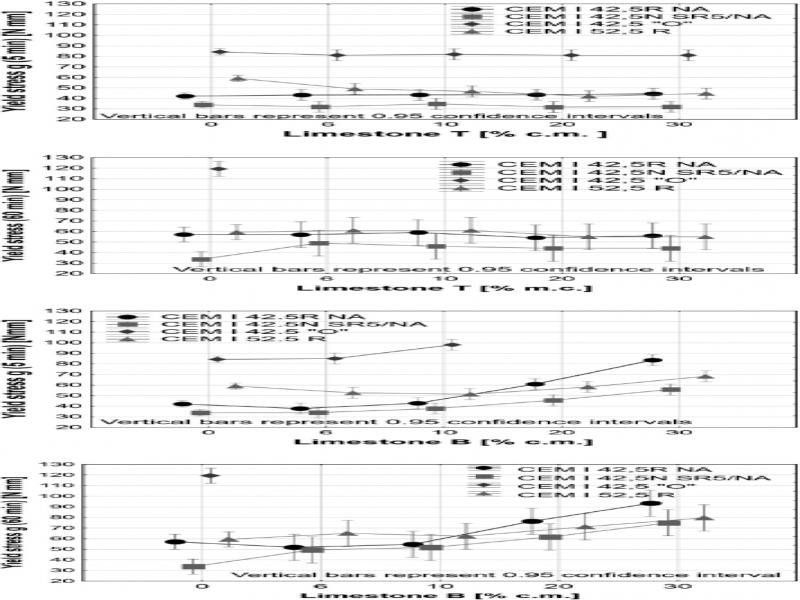
Figure 4.
Yield stress of mortars with Portland limestone cement with limestone T (top), limestone B (bottom) after 5 and 60 minutes from mixing
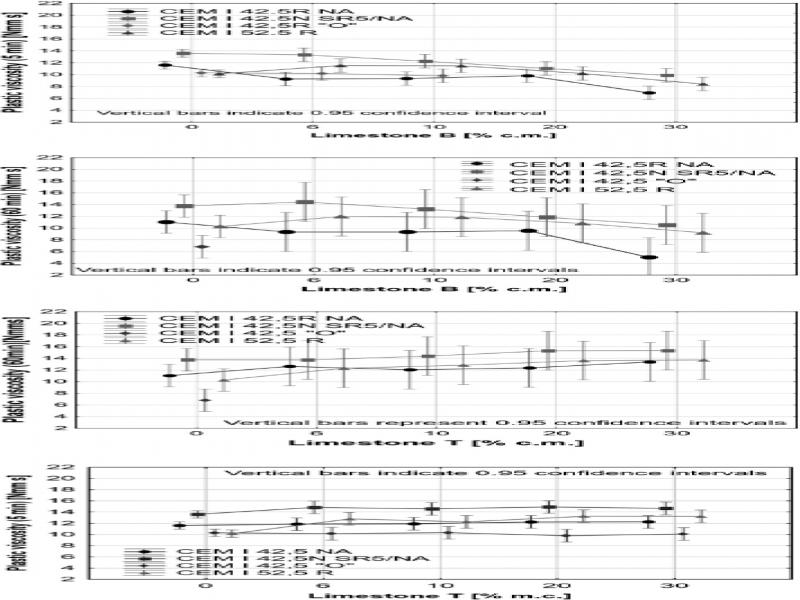
Figure 5.
Plastic viscosity h of mortars with Portland limestone cement with limestone T (top), limestone B (bottom) after 5 and 60 min from mixing
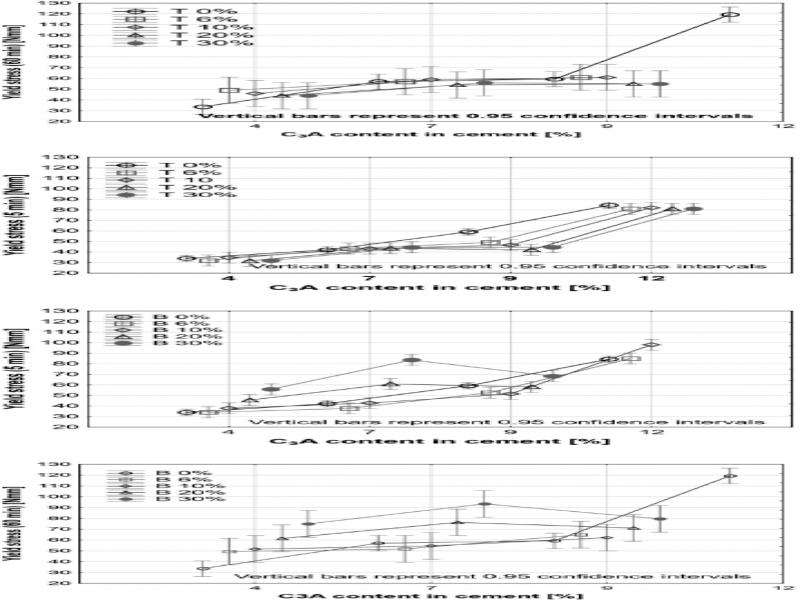
Figure 6.
The relationship between the content of the C3A phase in the cement and the yield value
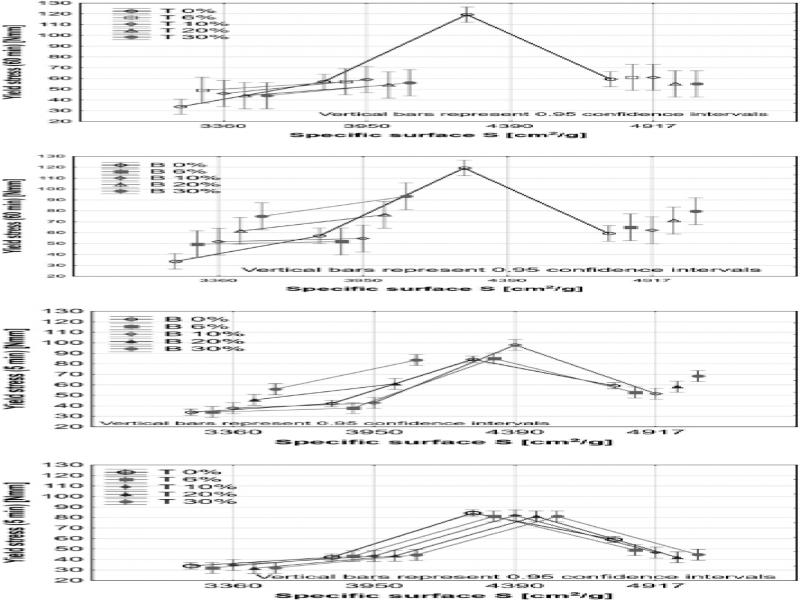
Figure 7.
The relationship between the specific surface area of cement and the yield value
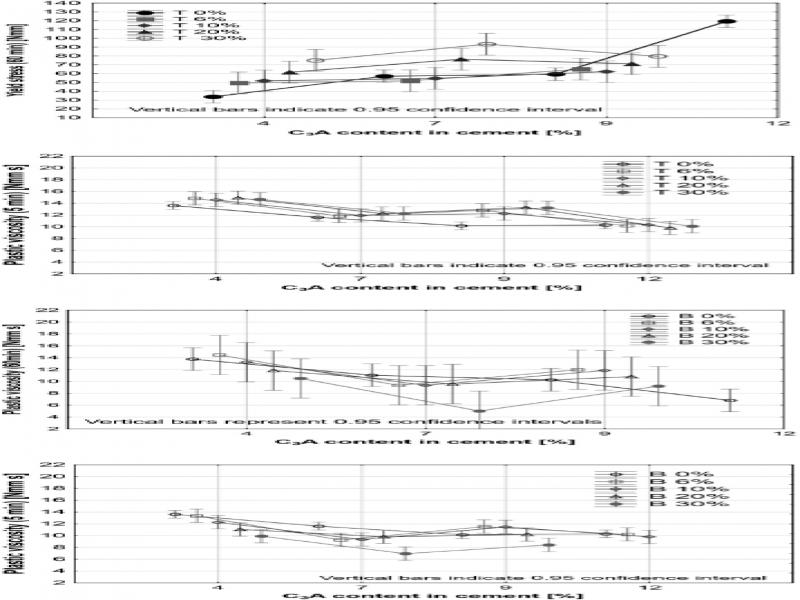
Figure 8.
The relationship between the content of the C3A phase in the cement and the plastic viscosity
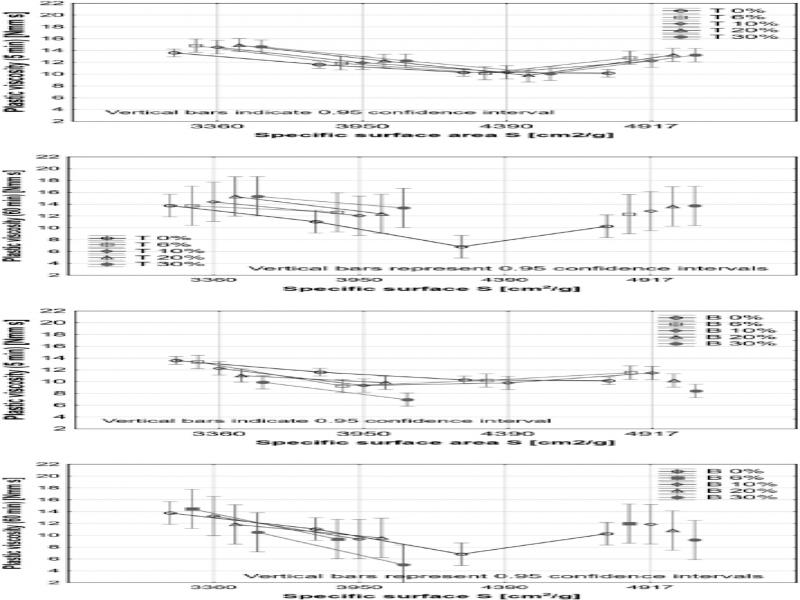
Figure 9.
The relationship between the specific surface S of cement and the plastic viscosity