
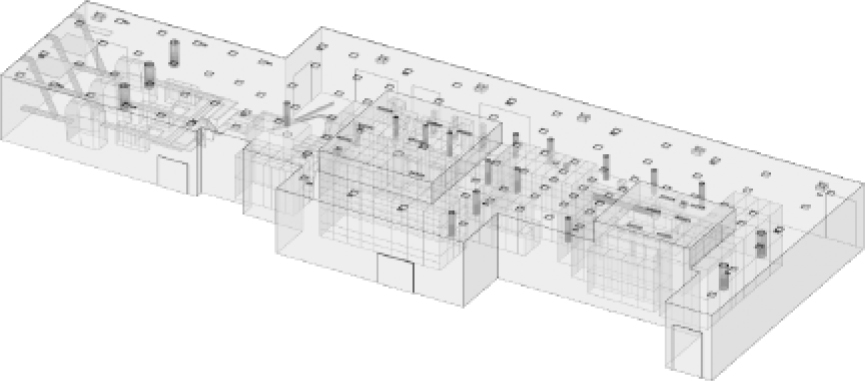
Figure 1.
The numerical model of the tested facility (isometric view)
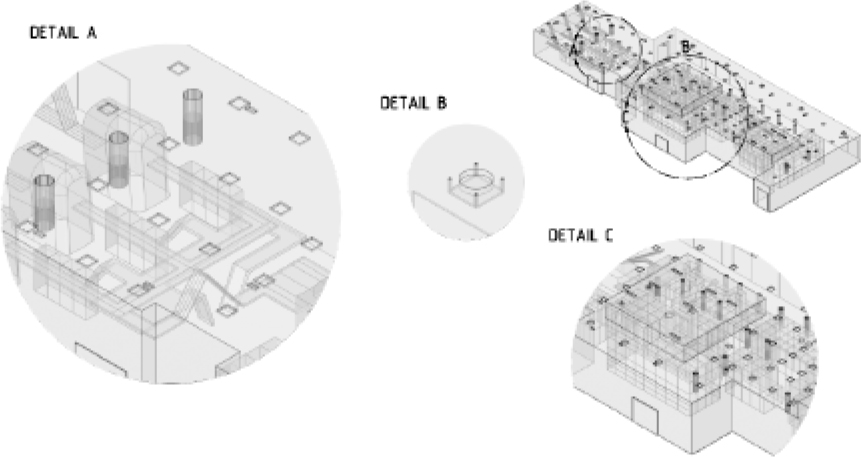
Figure 2.
The numerical model of the tested facility with marked details: detail A – diffusers; detail B – exhaust; detail C – technical equipment
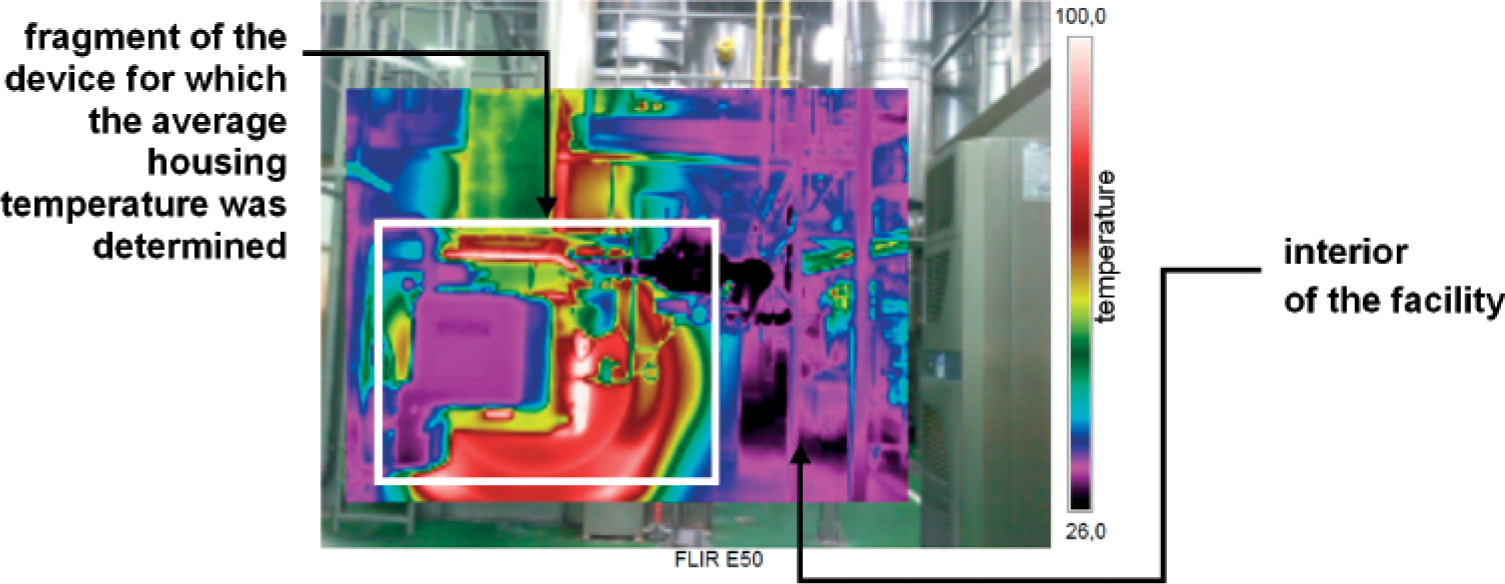
Figure 3.
Example of a thermogram of a heat source in the tested facility (picture-in-picture)
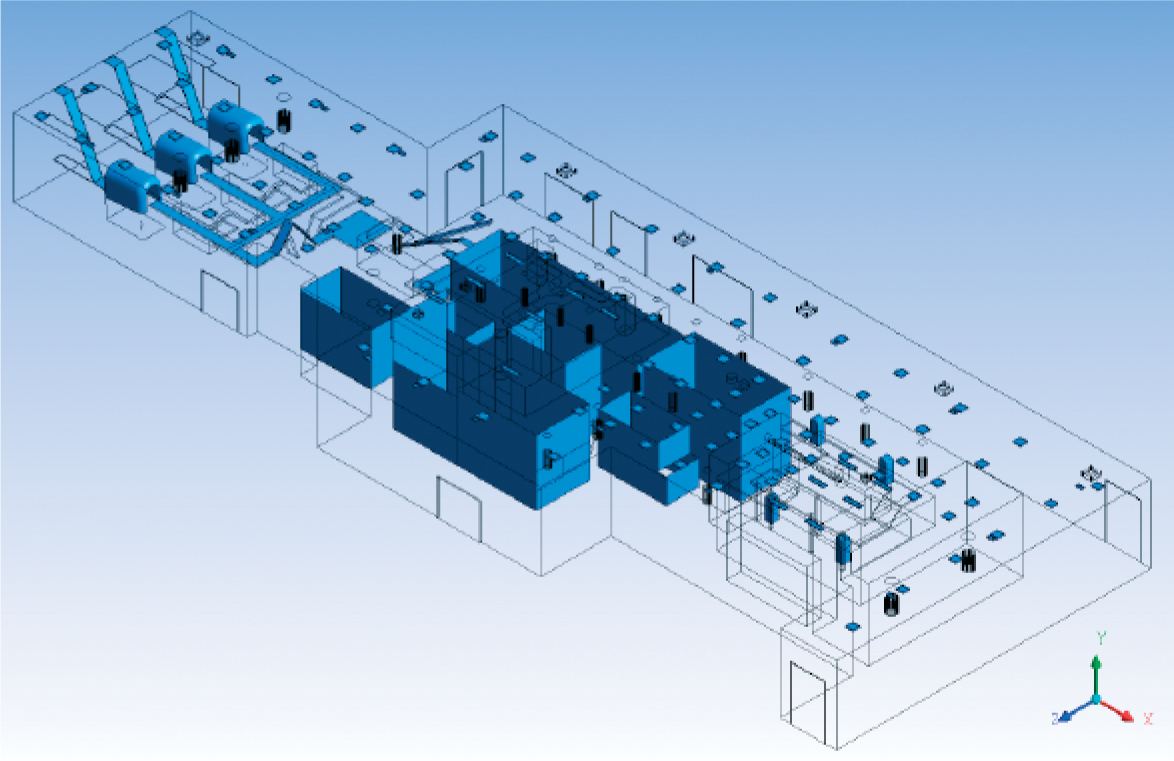
Figure 4.
Model surfaces for which different temperature was set in boundary conditions and marked global XYZ coordinate system
Table 1.
Boundary conditions for the heat transfer common for case 1, 2
| Boundary condition | Value/range of values |
|---|---|
| Heat transfer coefficient of roof | 0.6 W/m2 K |
| Outdoor air temperature | 8°C |
| Surface temperature of technical equipment surfaces | 28–90°C |
| Surface emissivity of technical equipment | 0.95 |
| Surface temperature of partitions and gates | 26–32°C |
| Surface temperature of technological elements | 35–145°C |
| Surface emissivity of technological elements | 0.95 |
| Lighting power | 18 kW |
| People | 1 kW |
Table 2.
Boundary conditions for ventilation openings for case 1, 2
| Boundary condition | Value |
|---|---|
| Mass flow rate of supply air of SYS 1 (case 1) | 9.83 kg/s |
| Mass flow rate of supply air of SYS 1 (case 2) | 5.90 kg/s |
| Mass flow rate of supply air of SYS 2 (case 1) | 9.09 kg/s |
| Mass flow rate of supply air of SYS 2 (case 2) | 5.40 kg/s |
| Temperature of supply air (SYS 1,2) (case 1, 2) | 23.5°C |
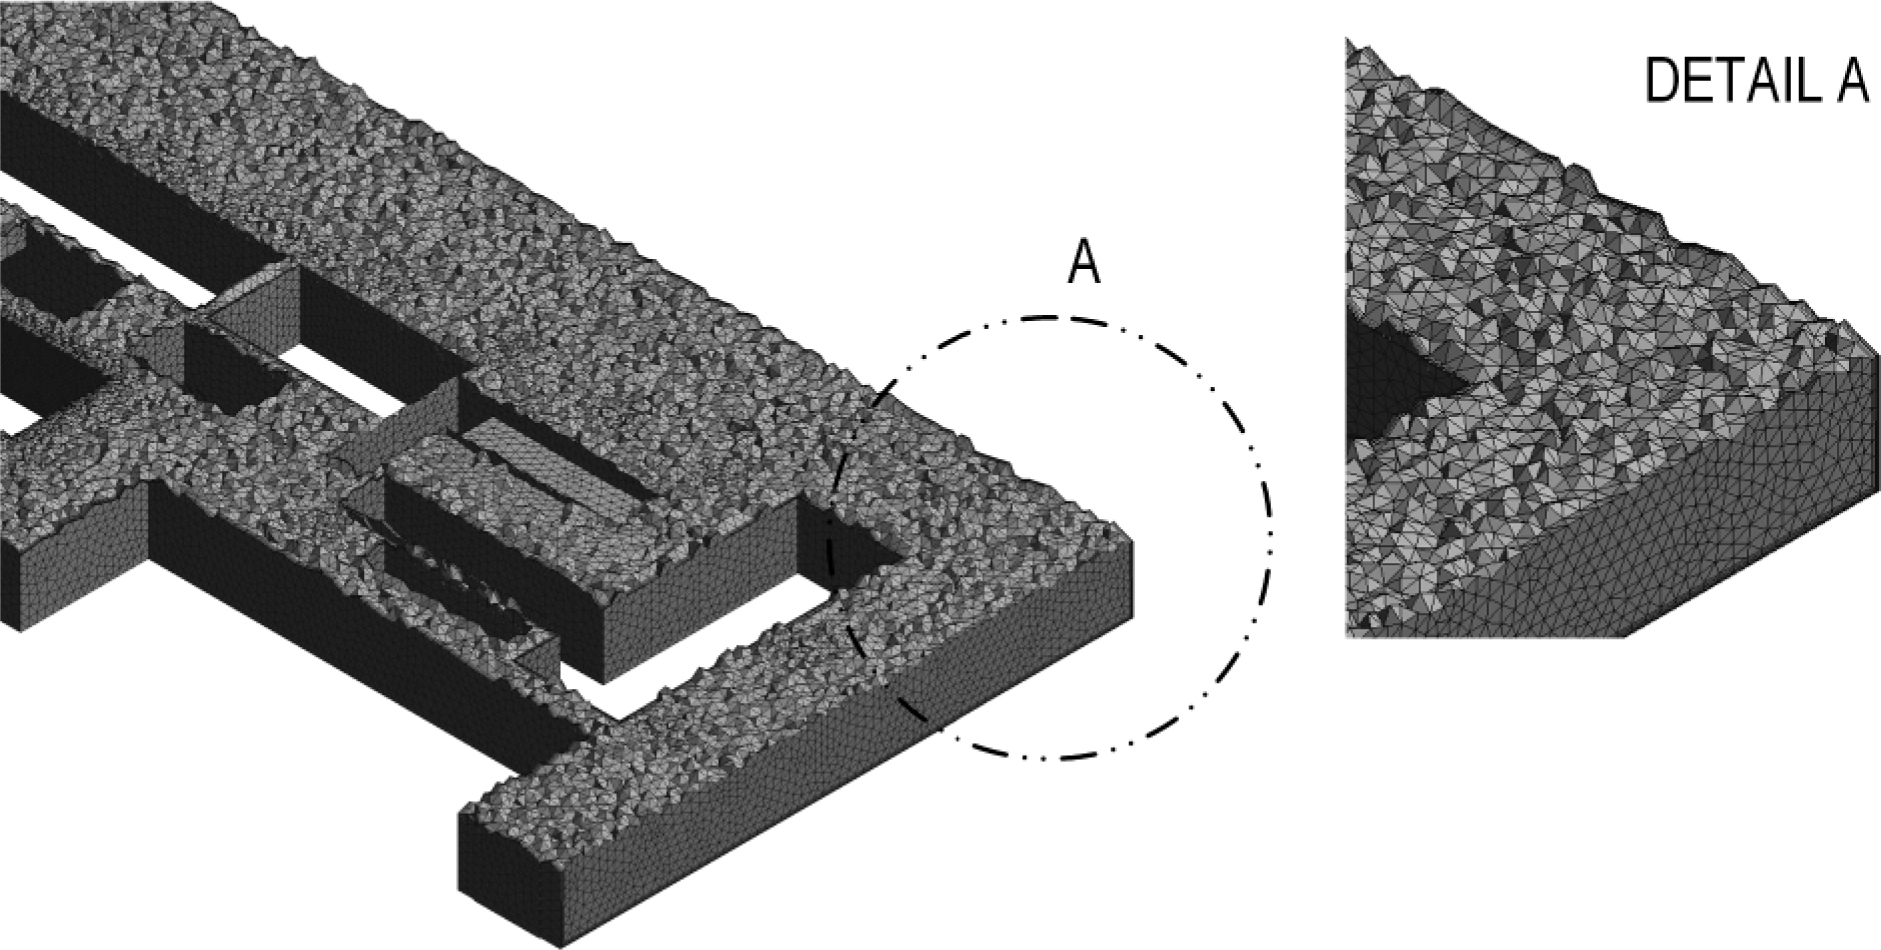
Figure 5.
A fragment of the cross-section through the discretization grid
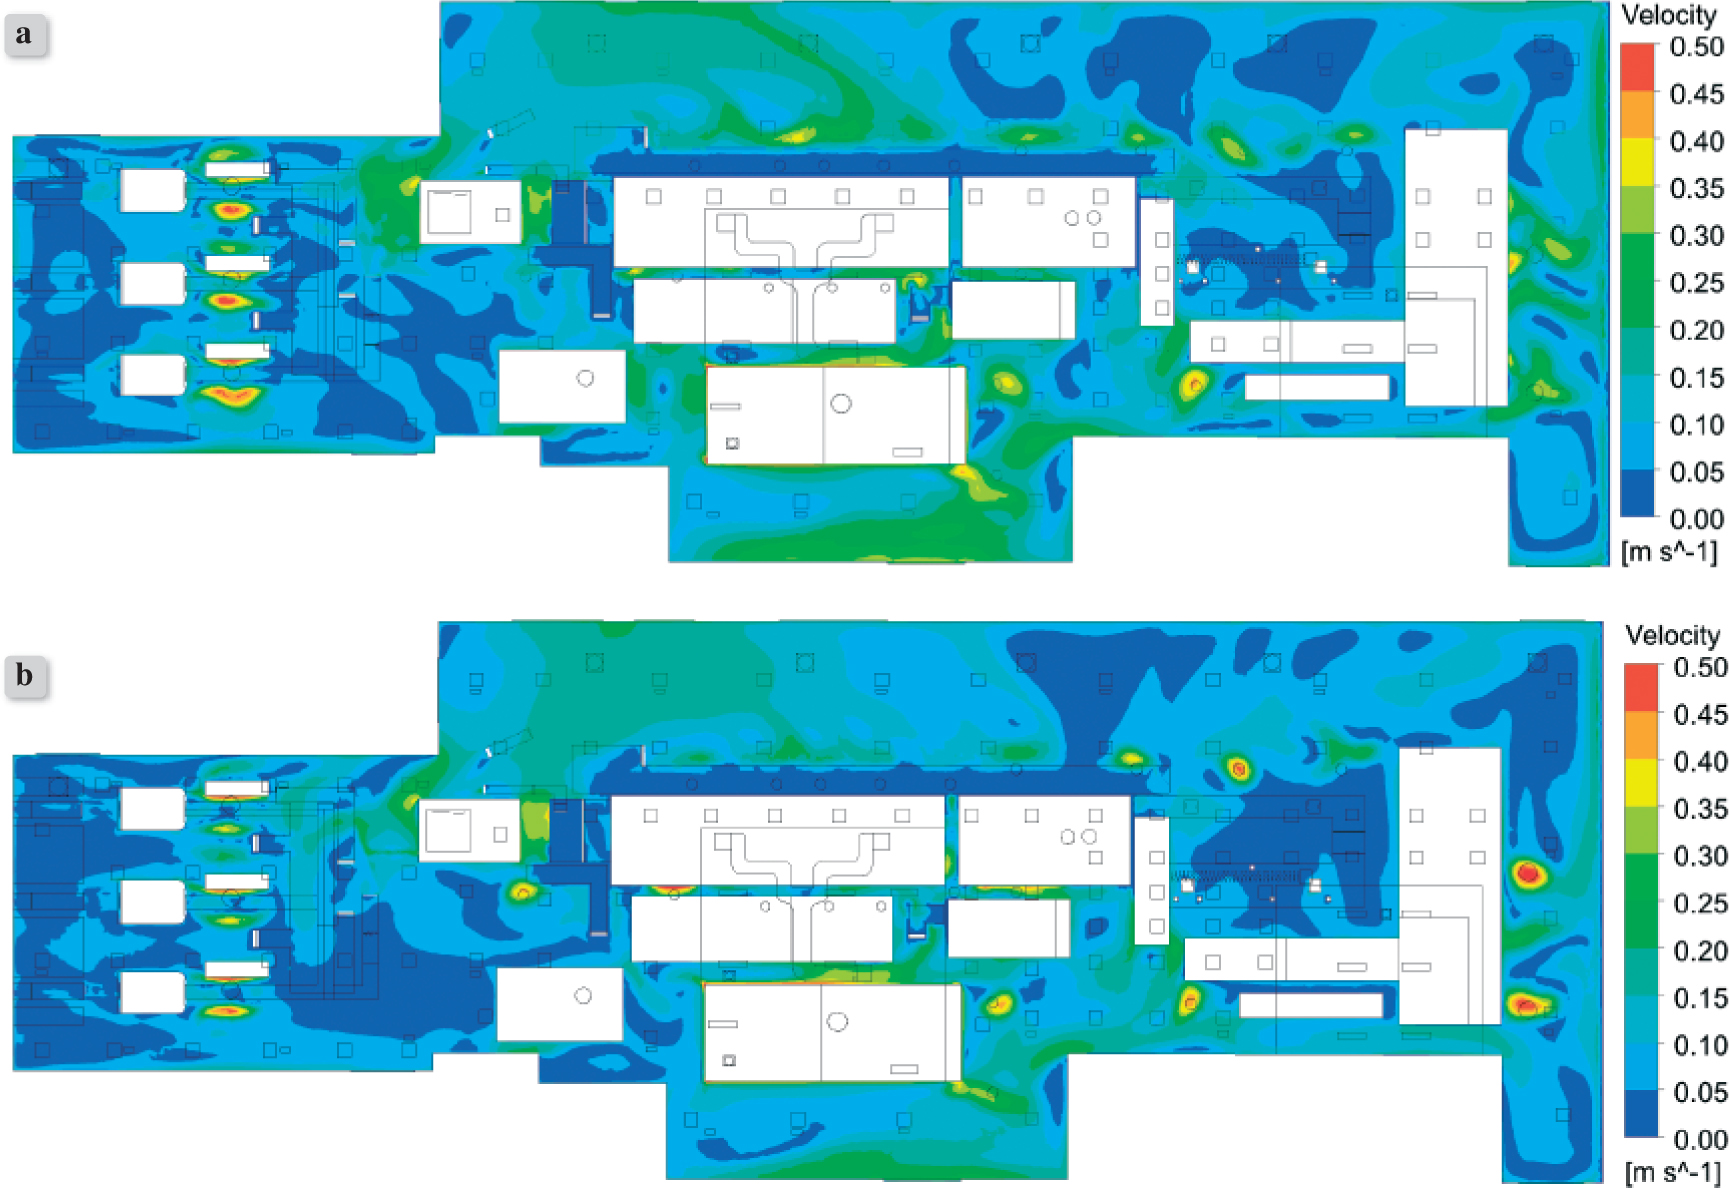
Figure 6.
The comparison of air velocity isosurfaces maps in the tested facility in the horizontal plane ZX, Y = 1.5 m a) case 1 b) case 2
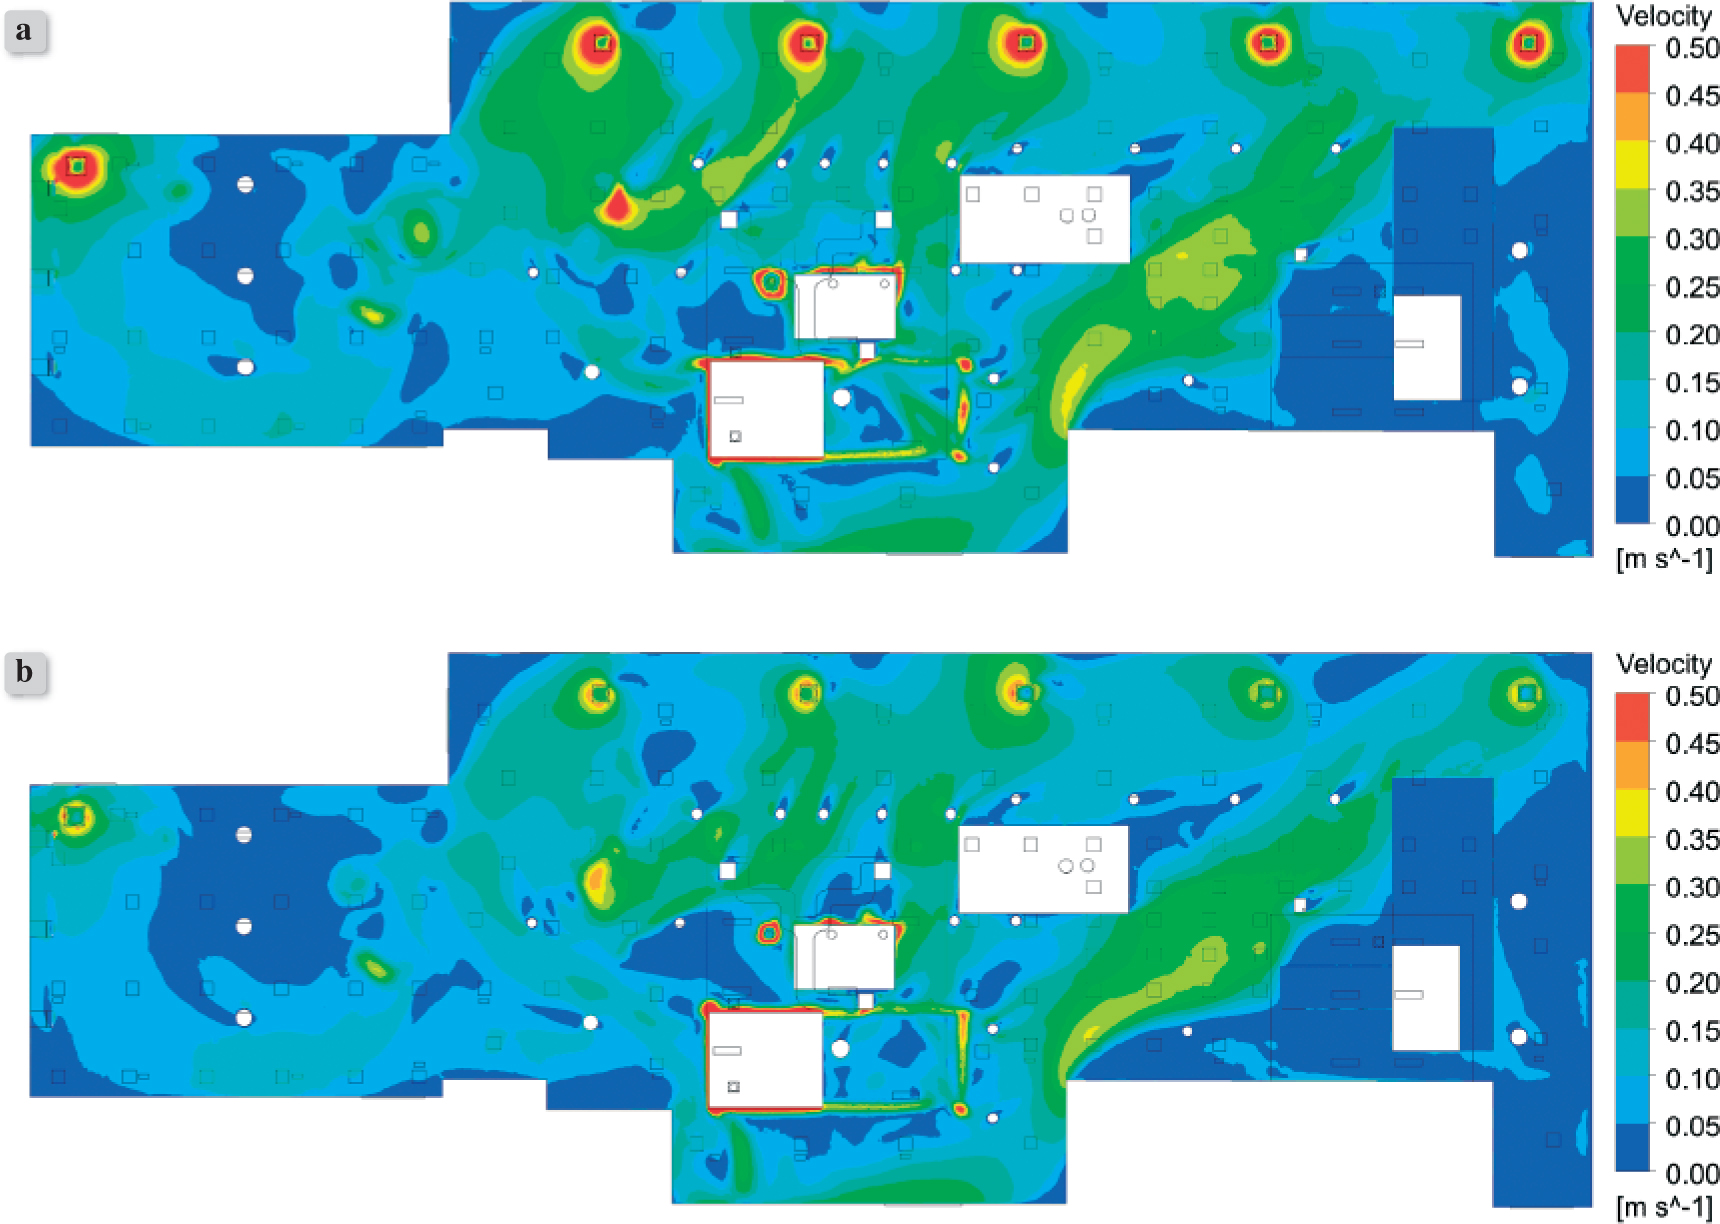
Figure 7.
The comparison of air velocity isosurfaces in the tested facility in the horizontal plane ZX, Y = 6.0 m a) case 1 b) case 2
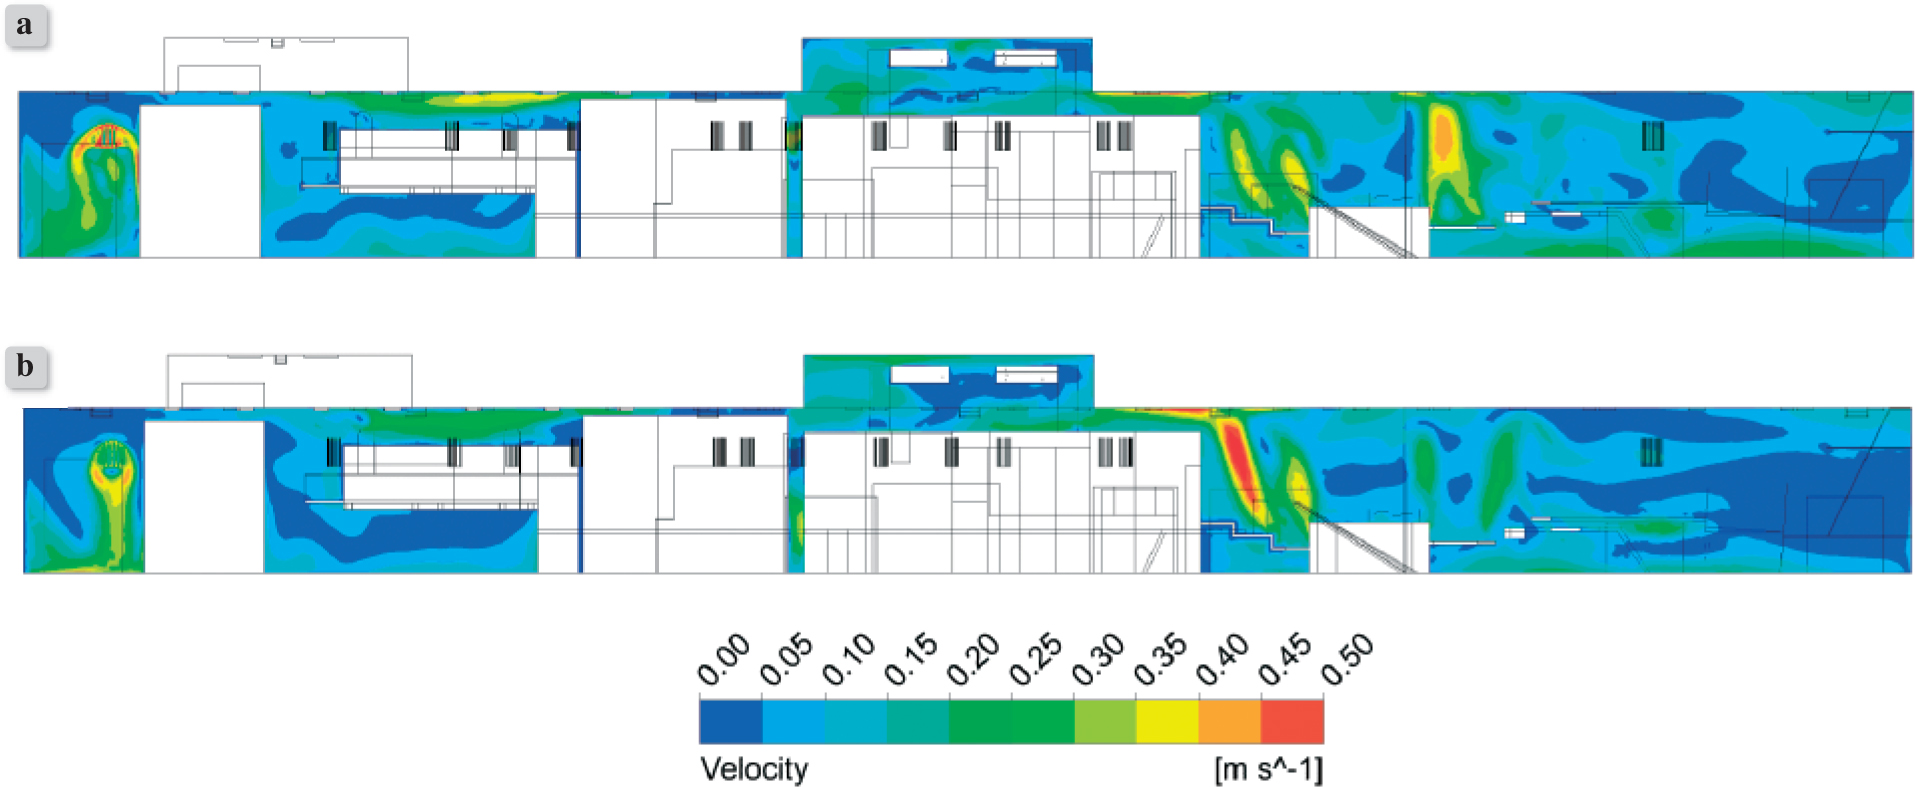
Figure 8.
The comparison of air velocity isosurfaces in the tested facility in the vertical plane XY, Z = 5.0 m a) case 1 b) case 2
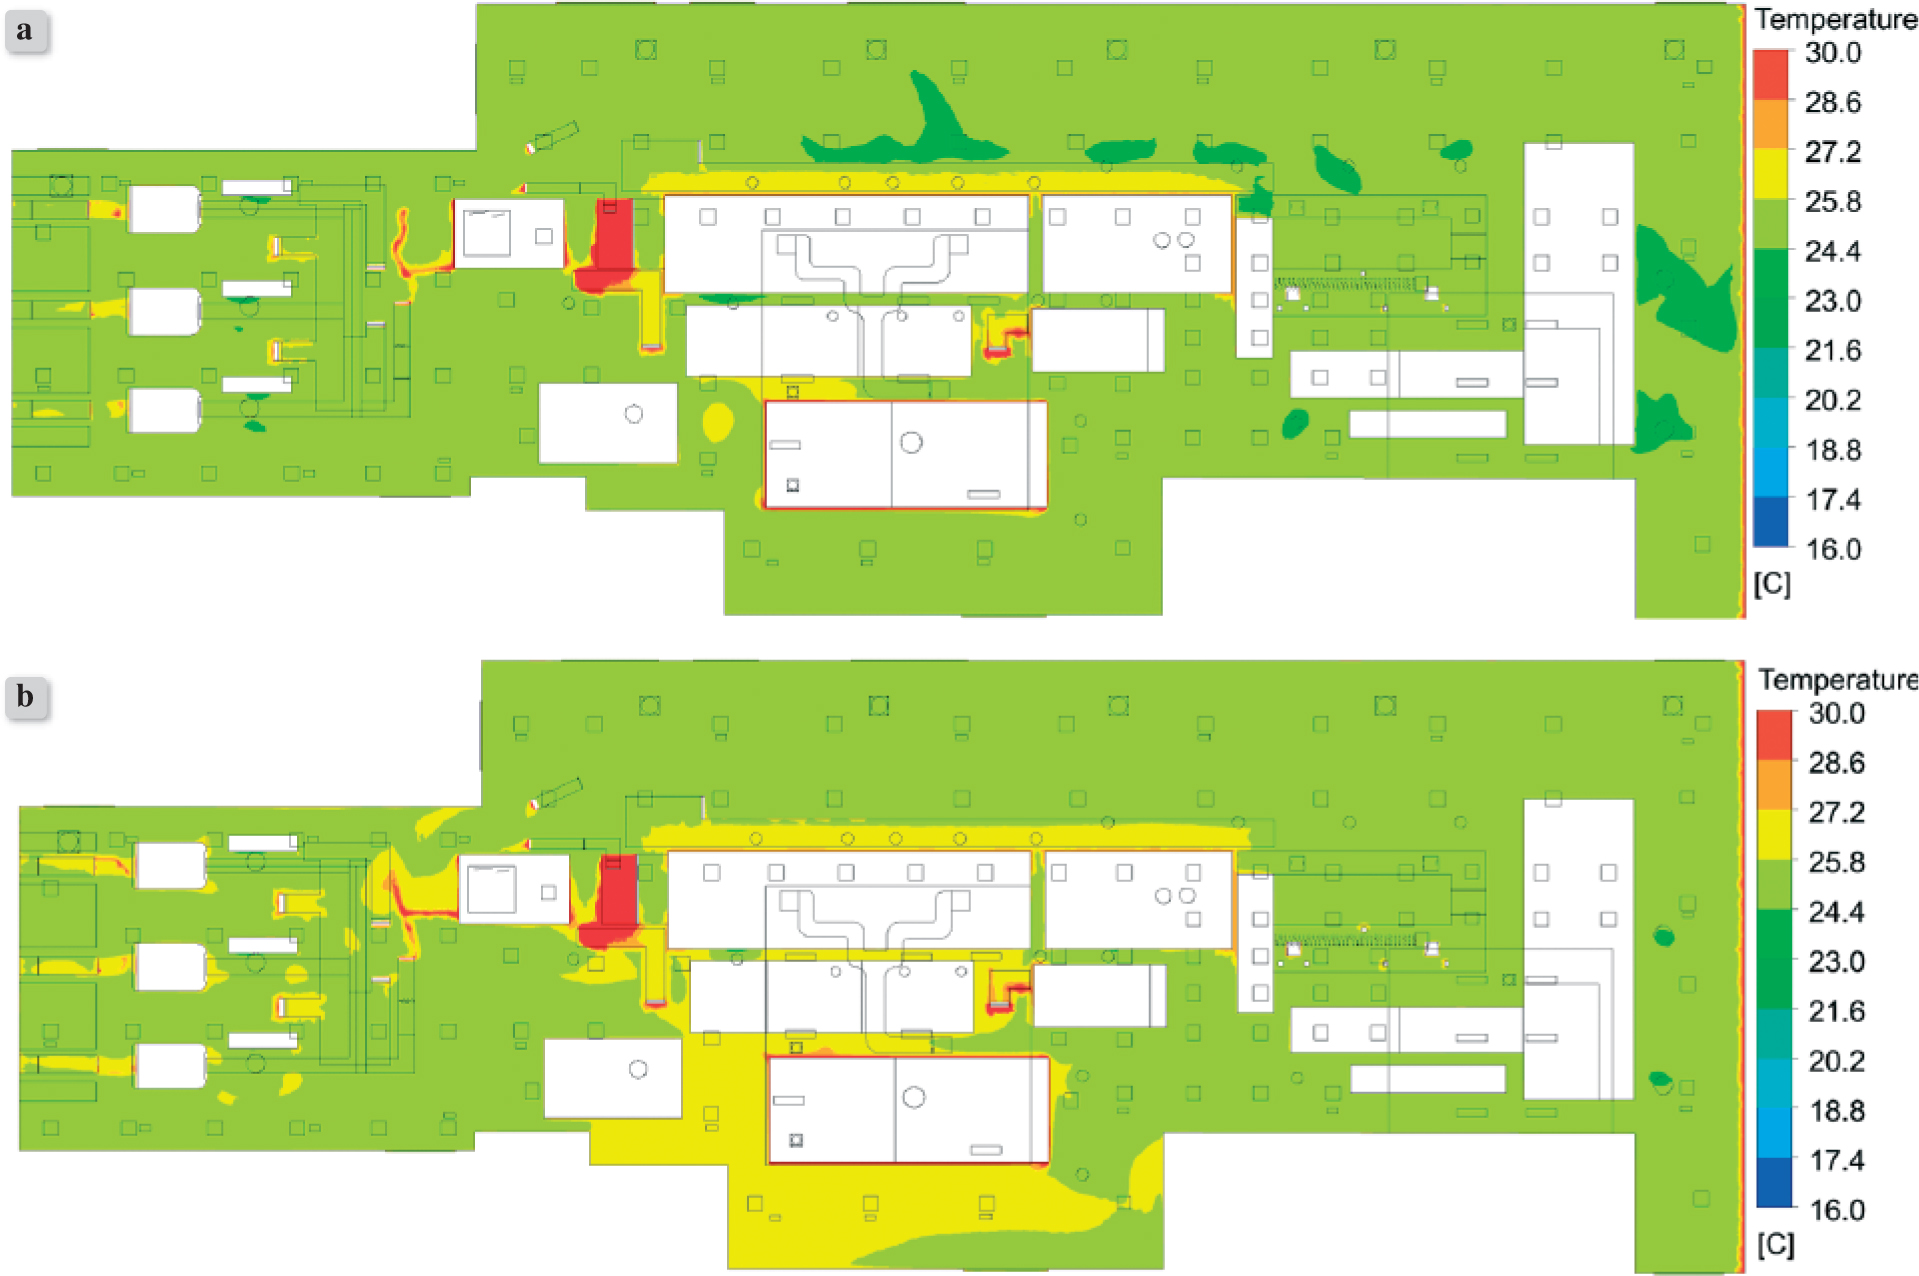
Figure 9.
The comparison of air temperature isosurfaces maps in the tested facility in the horizontal plane ZX, Y = 1.5 m a) case 1 b) case 2
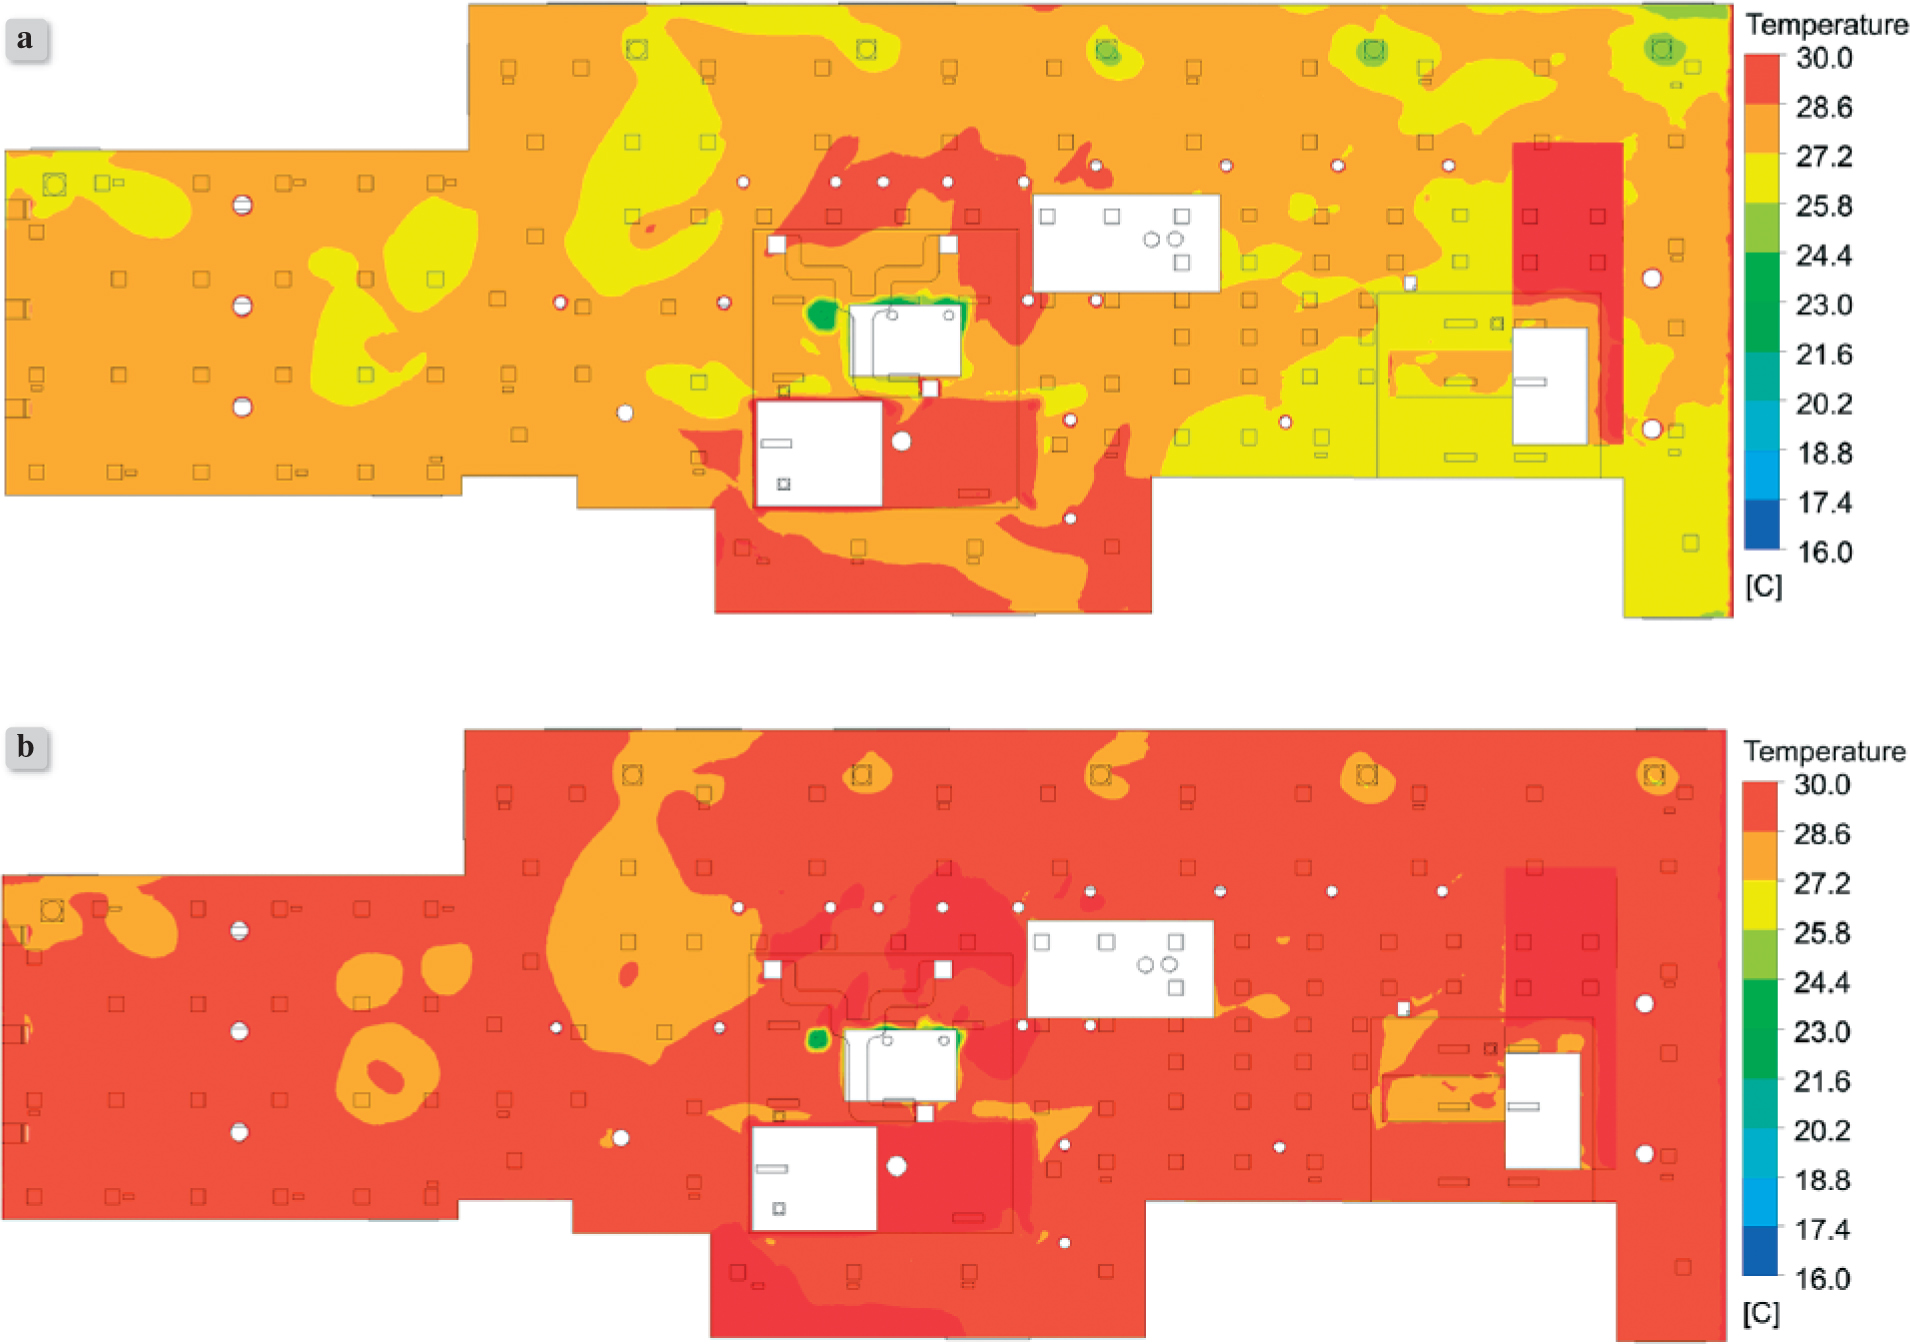
Figure 10.
The comparison of air temperature isosurfaces in the tested facility in the horizontal plane ZX, Y = 6.0 m a) case 1 b) case 2
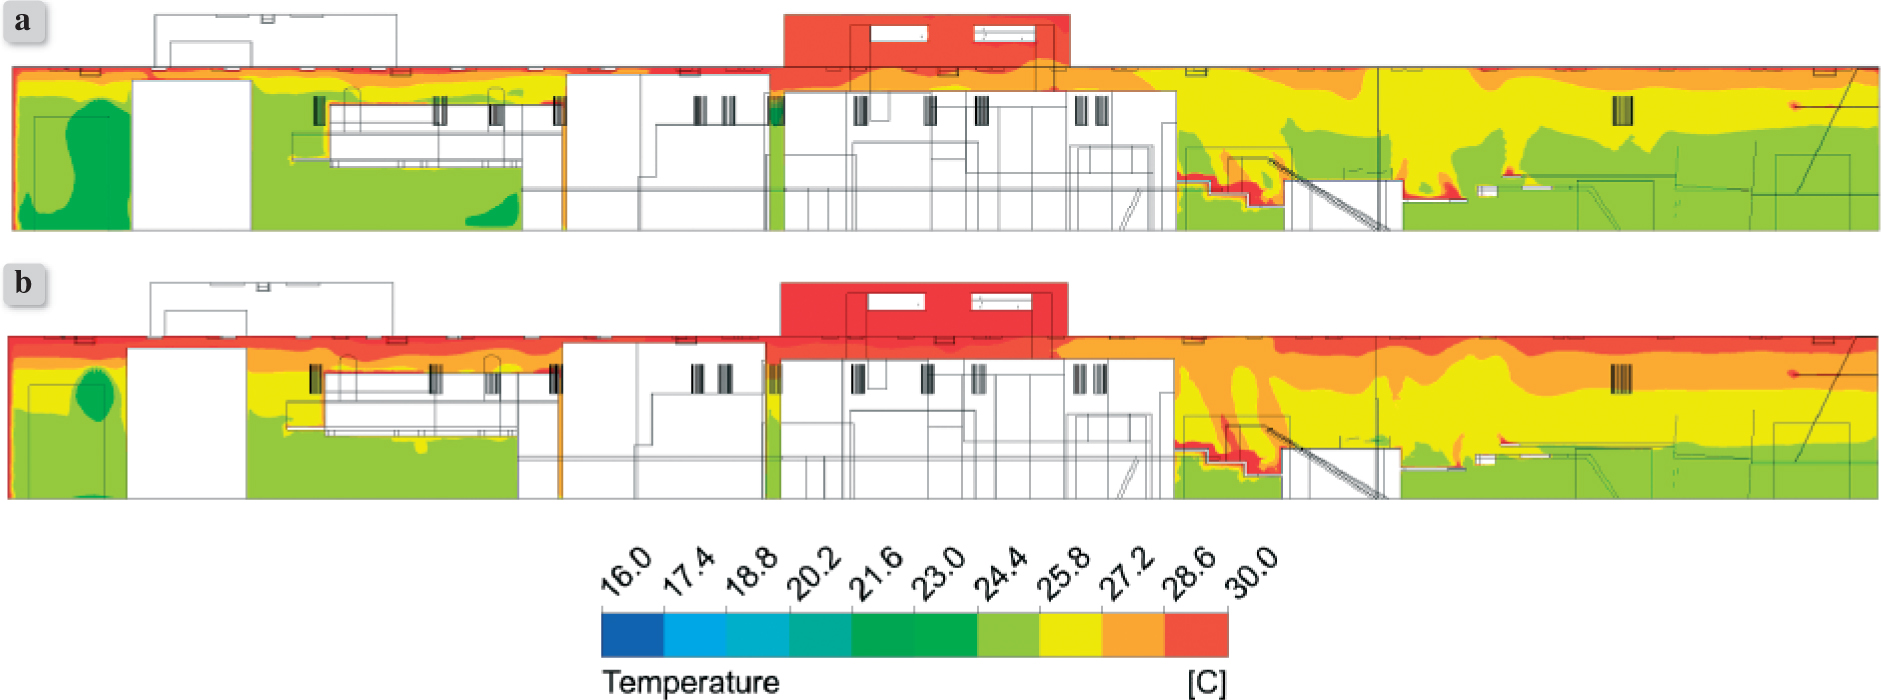
Figure 11.
The comparison of air temperature isosurfaces in the tested facility in the vertical plane XY, Z = 5.0 m a) case 1 b) case 2
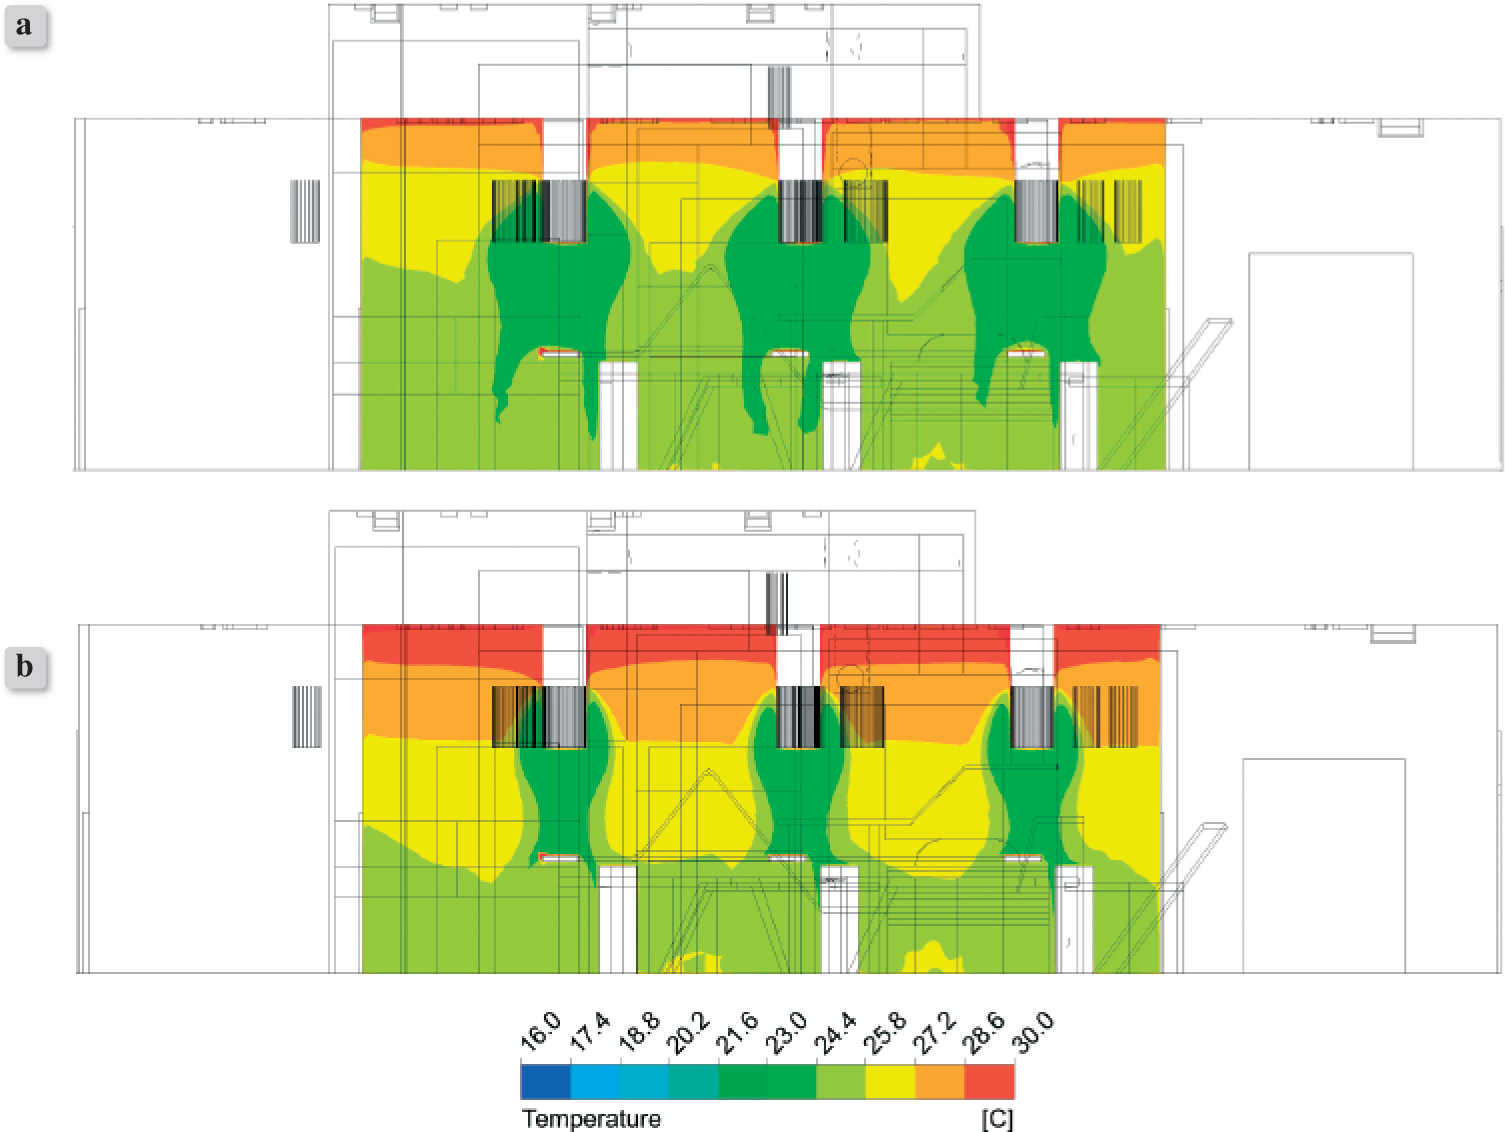
Figure 12.
The comparison of air temperature isosurfaces in the tested facility in the vertical plane YZ, X = 10.3 m a) case 1 b) case 2
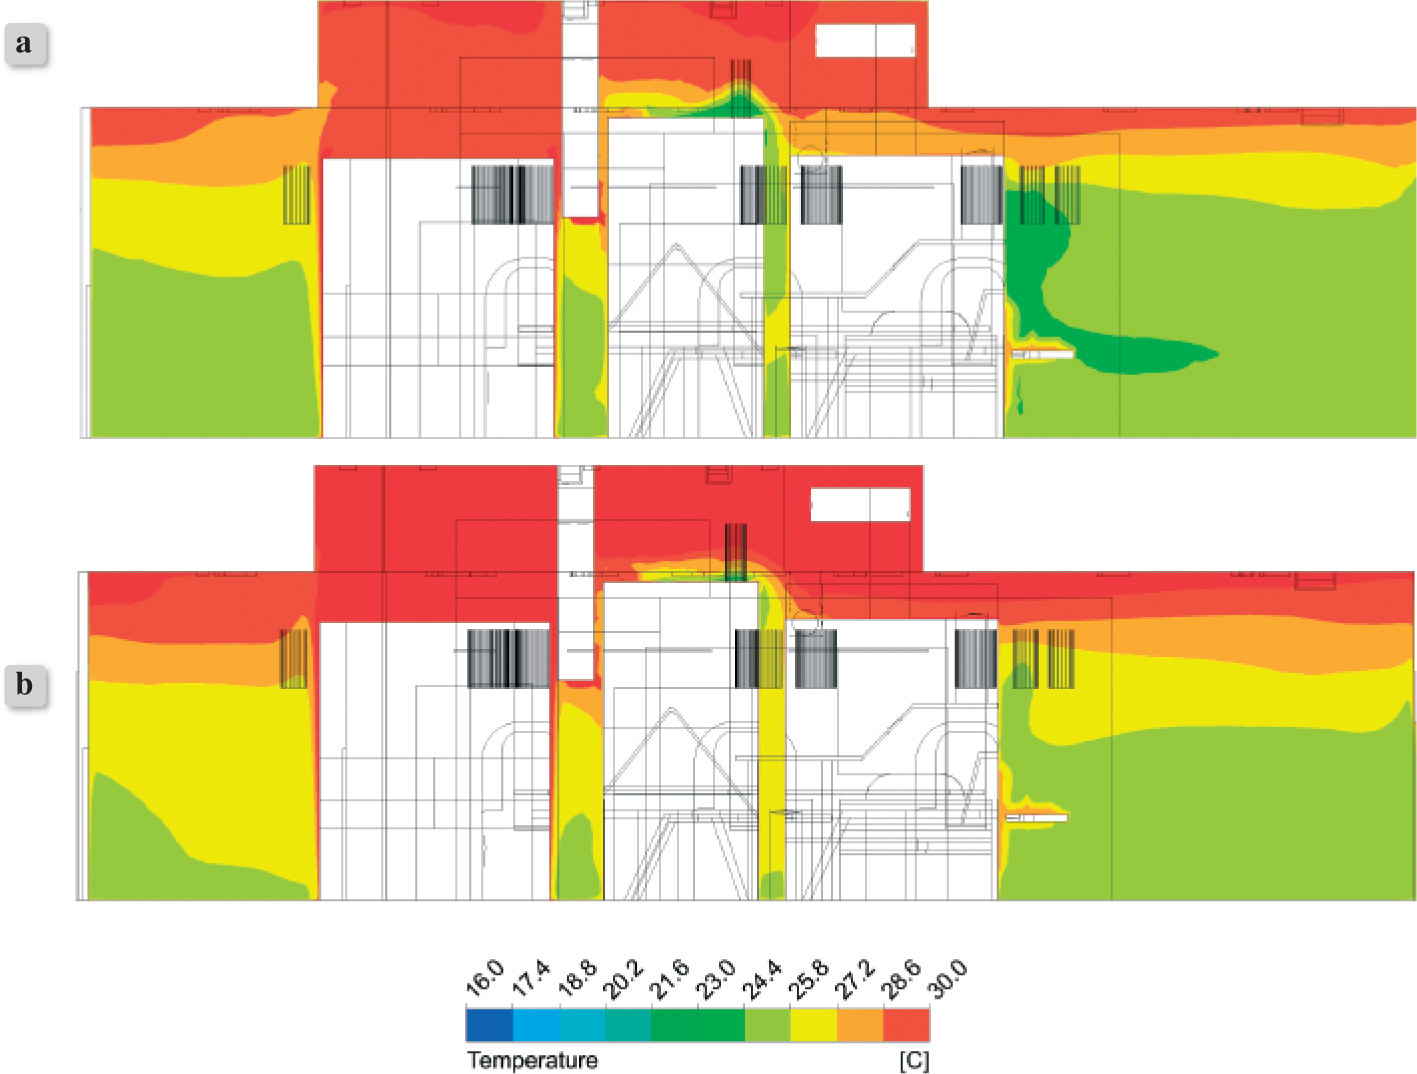
Figure 13.
The comparison of air temperature isosurfaces in the tested facility in the vertical plane YZ, X = 40.0 m a) case 1 b) case 2