
Table 1.
Water supply systems A and B characteristics
| Network | |||
|---|---|---|---|
| Parameter | Unit | A [15] | B |
| Number of individual consumers | ppl. | 8 350 | 5 502 |
| Total length of water supply network (Lm ) | km | 143.6 | 94.23 |
| Number of households connections | pcs. | 2 120 | 1 651 |
| Total length of households connections | km | 79.0 | 77.54 |
| Total length of water network with households connection | km | 222.6 | 171.77 |
| Water Network Intensity Indicator (WNII) | m3/(day·km) | 8.05 | 7.50 |
| Average operating pressure | MPa | 0.4 | 0.38 |
| Average water production in 2010–2015 | m3/year | 454 333 | 245 266 |
| Average annual water consumption for own purposes | m3/year | 3 850 | 3 125.8 |
| Average water sale in 2010–2015 | m3/year | 269 133 | 198 563 |
| Water sale in 2015 | m3/year | 260 300 | 231 467 |
Table 2.
Water balance and terminology according to IWA (data in m3/year) [1]
| System Input Volume (SIV) | |||
|---|---|---|---|
| Authorised Consumption (AC) | Water Losses (WL) | ||
| Billed Authorised Consumption (BAC) | Unbilled Authorised Consumption (UAC) | Apparent Losses (AL) | Real Losses (RL) |
| Revenue Water (RW) | Non-Revenue Water (NRW) | ||
Table 3.
Selected components of the water balance for the system A over the period 2010–2015
| Year | ||||||
|---|---|---|---|---|---|---|
| Parameter as per tab. 2 | 2010 | 2011 | 2012 | 2013 | 2014 | 2015 |
| SIV, m3/year | 463 030.0 | 448 842.0 | 464 526.0 | 459 583.0 | 444 824.0 | 422 092.0 |
| WL, m3/year | 187 230.0 | 169 642.0 | 183 226.0 | 173 983.0 | 162 224.0 | 153 392.0 |
| RL, m3/year | 164 078.5 | 147 199.9 | 159 999.7 | 151 003.8 | 139 982.8 | 132 287.4 |
| NRW, m3/year | 197 230.0 | 179 642.0 | 193 226.0 | 183 983.0 | 172 224.0 | 163 392.0 |
Table 4.
Selected components of the water balance for the system B over the period 2010–2015
| Year | ||||||
|---|---|---|---|---|---|---|
| Parameter as per tab. 2 | 2010 | 2011 | 2012 | 2013 | 2014 | 2015 |
| SIV, m3/year | 251 156.0 | 245 486.0 | 259 532.0 | 232 733.0 | 237 061.0 | 258 000.0 |
| WL, m3/year | 67 296.0 | 50 745.0 | 53 807.0 | 33 153.0 | 27 804.0 | 24 533.0 |
| RL, m3/year | 57 249.8 | 40 925.6 | 47 318.7 | 27 334.7 | 21 877.5 | 18 083.0 |
| NRW, m3/year | 77 046.0 | 60 495.0 | 63 557.0 | 35 153.0 | 29 804.0 | 26 533.0 |
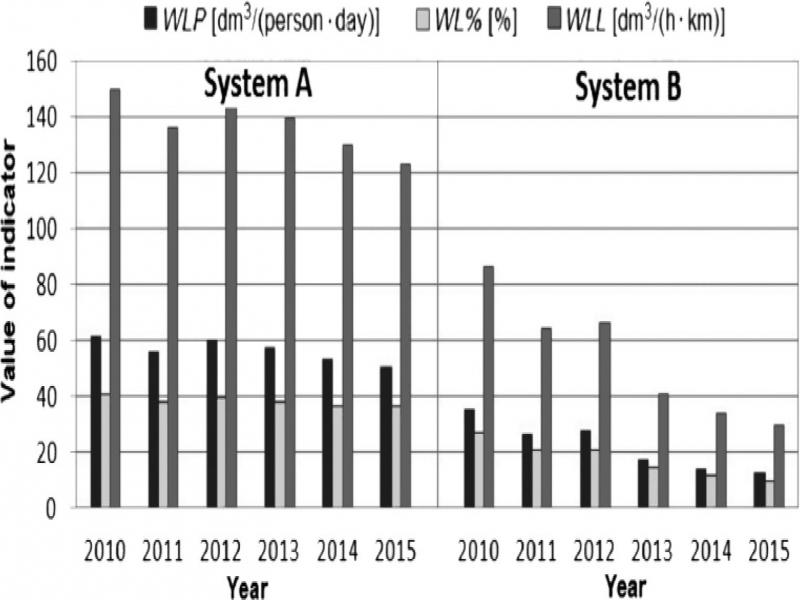
Figure 1.
Selected water losses performance indicators (WLP, WL% and WLL) – systems A and B
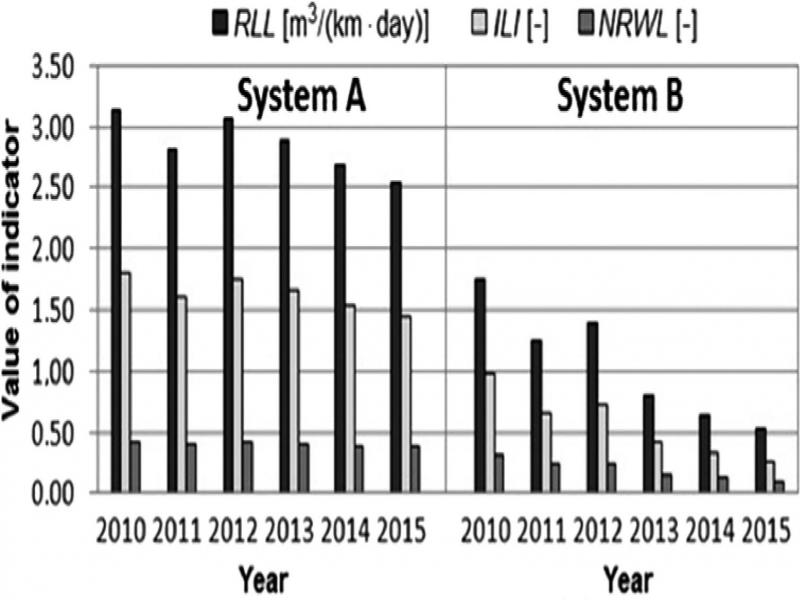
Figure 2.
Selected water losses performance indicators (RLL, ILI and NRWL) – systems A and B
Table 6.
Average water losses indicators in different water network systems
| Water loses indicator | Water network system | Limit values according to | ||||||
|---|---|---|---|---|---|---|---|---|
| A | B | According to | DVGW 1 [21] | WBI 2 [22] | AWWA 3 [21] | IWA 4 [19] | ||
| [26] | [27] | |||||||
| RLL, m3/(day·km) | 2.86 | 1.06 | 1.2 | No data | < 1.2 | No data | No data | No data |
| ILI, - | 1.64 | 0.56 | 0.9 | 2 | < 0.97 | < 1.5 | < 3 | < 1.5 |
| NRWcon, dm3/(conn·day) | 234.71 | 88.83 | No data | No data | No data | < 75 | No data | No data |