
Table 1
Percent of schools surveyed in the U.S., the South Arts region, and the state of Virginia that offer each of four types of arts programming. Sources: Morrison et al., Status Report 2019.; Bell, Arts Education in the South Phase I; “Virginia Arts Education Data Project Interactive Dashboards,” AEDP, VCFEA.
| MUSIC | VISUAL ARTS | THEATER | DANCE | |
|---|---|---|---|---|
| United States | 91.8% | 90.5% | 35.2% | 15.3% |
| South Arts Region | 80% | 71% | 22% | 14% |
| Virginia | 96.6% | 95.5% | 21.7% | 4% |
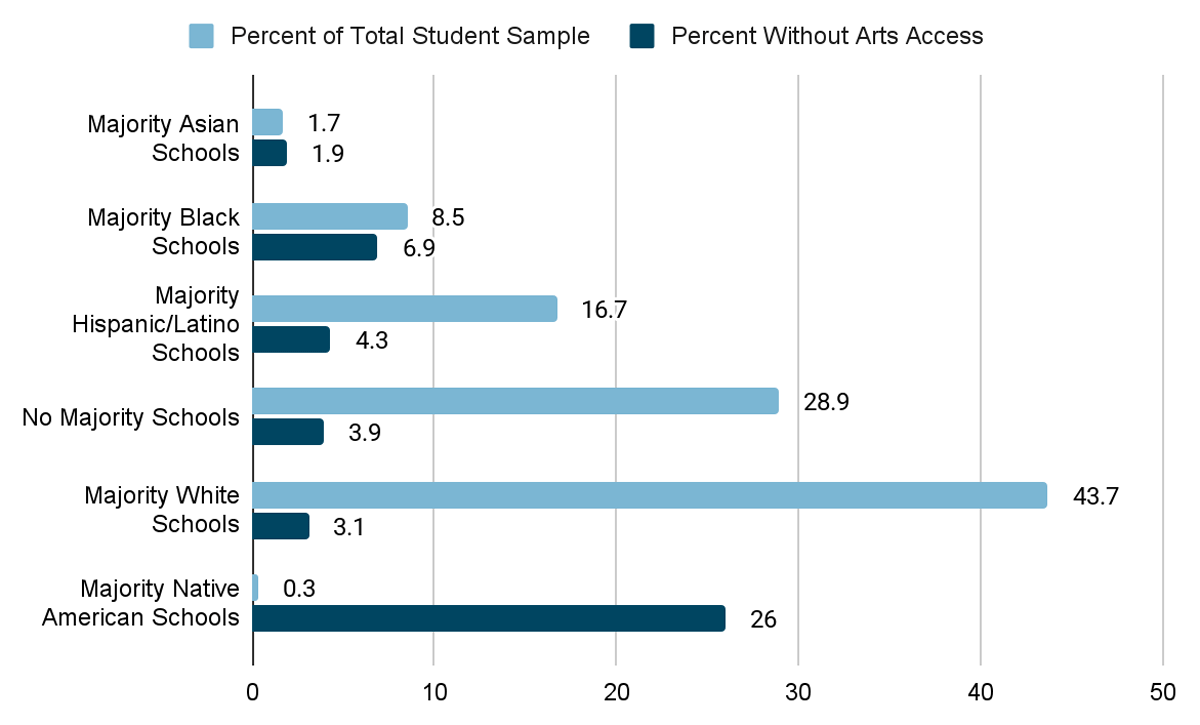
Figure 1
Comparison of the percentage of students in the United States that attend schools with racial or ethnic majorities, versus the percentage of students in each school category without access to the arts. Source: Morrison et al., Status Report 2019.
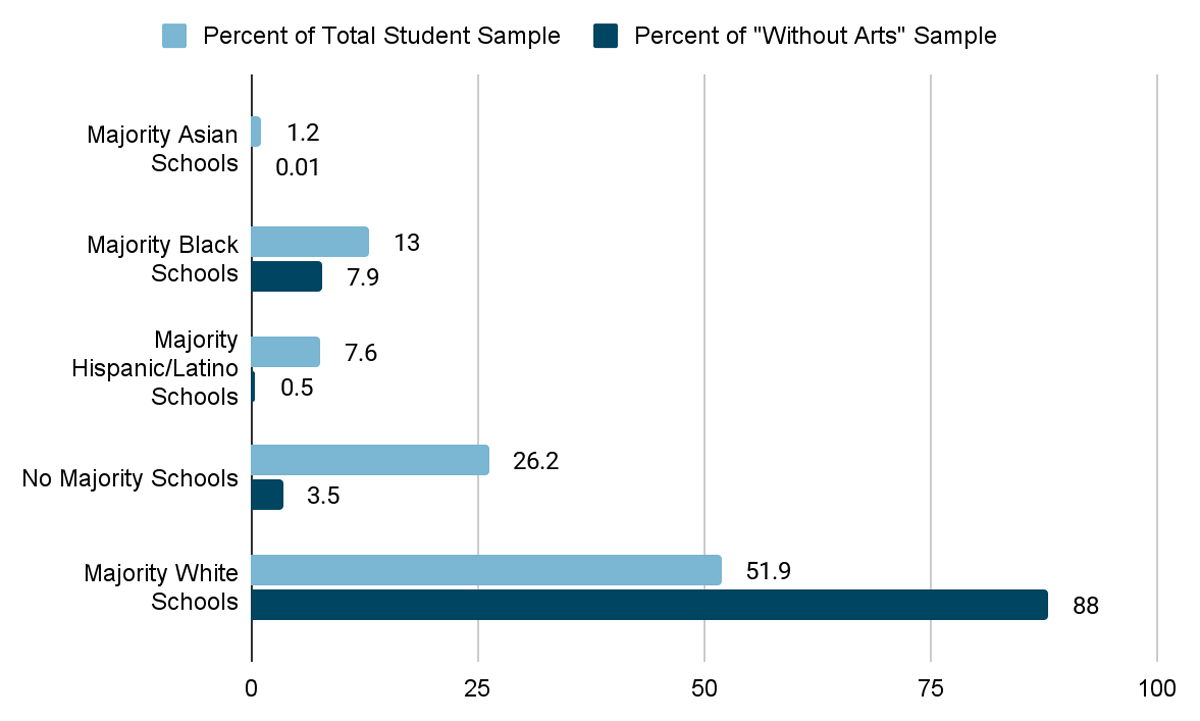
Figure 2
Comparison of the percentage of students in Virginia that attend schools with racial or ethnic majorities, versus the percentage of each school category without arts access out of the total number of schools without arts access. Source: Arts Education Data Project, Interactive Dashboards.
Table 2
Odds ratios (OR) of different demographic groups’ participation in arts events and arts activities in the United States in the last calendar year. Source: Bone et al., “Who engages in the arts?”.
| OR: ARTS EVENTS (n = 8684) | OR: ARTS ACTIVITIES (n = 4372) | |
|---|---|---|
| Female | 1.24 | 1.71 |
| White | 1 | 1 |
| Black | 0.66 | 0.48 |
| Income $0–$9,999 | 1 | 1 |
| Income $10,000–$19,999 | 1.27 | 0.84 |
| Income $20,000–$29,999 | 1.58 | 0.96 |
| Income $30,000–$49,999 | 1.80 | 0.87 |
| Income $50,000+ | 2.78 | 0.81 |
| Years of education | 1.19 | 1.08 |
| Med-large city | 1 | 1 |
| Suburb | 0.92 | 1.18 |
| Unincorporated area | 0.79 | 0.96 |
| Small city or town | 0.69 | 1.08 |
| Smaller areas | 0.57 | 0.98 |