
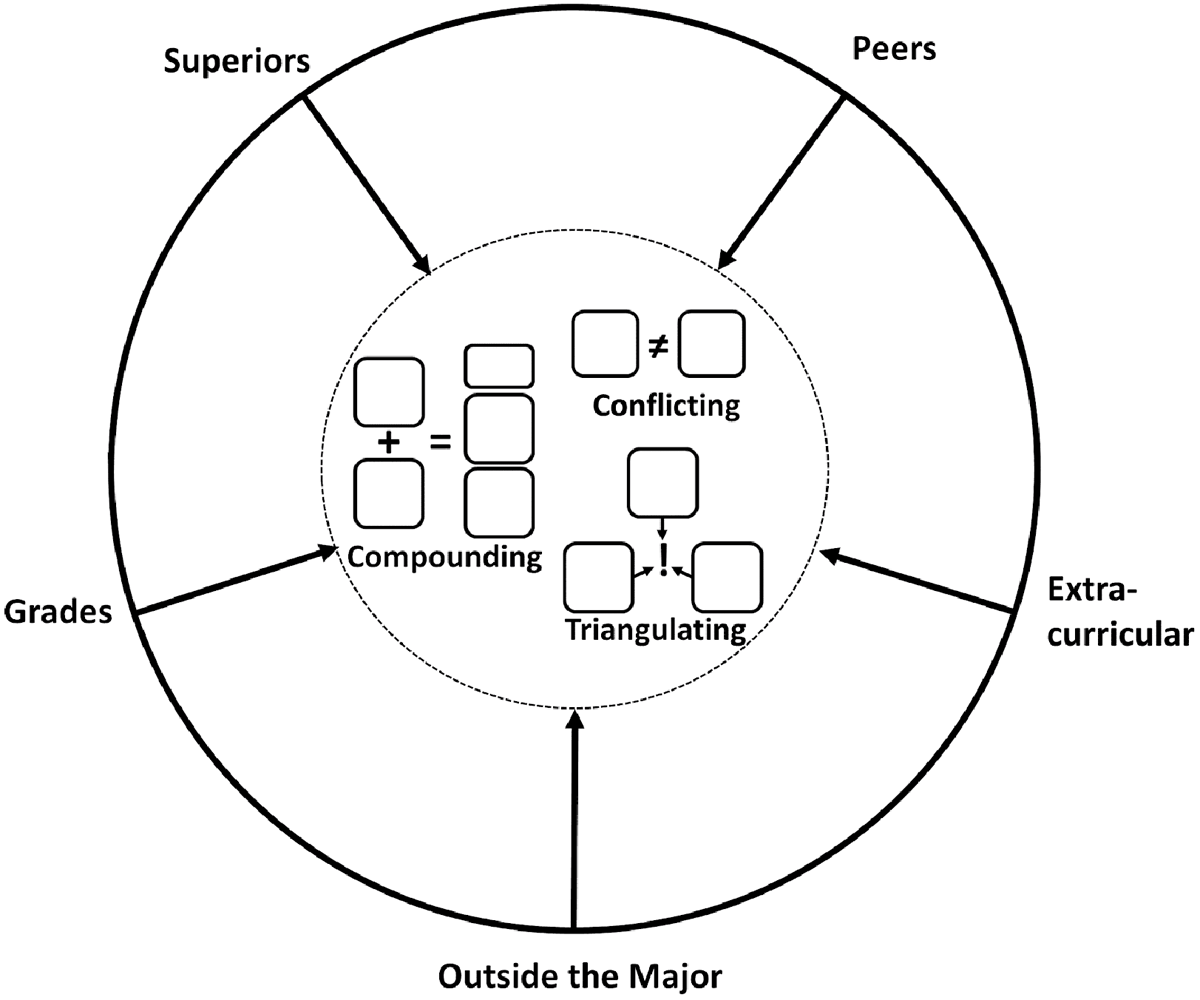
Figure 1
Contextual model for sources of expectations and ways of internalizing expectations (Kamanda et al., 2020).
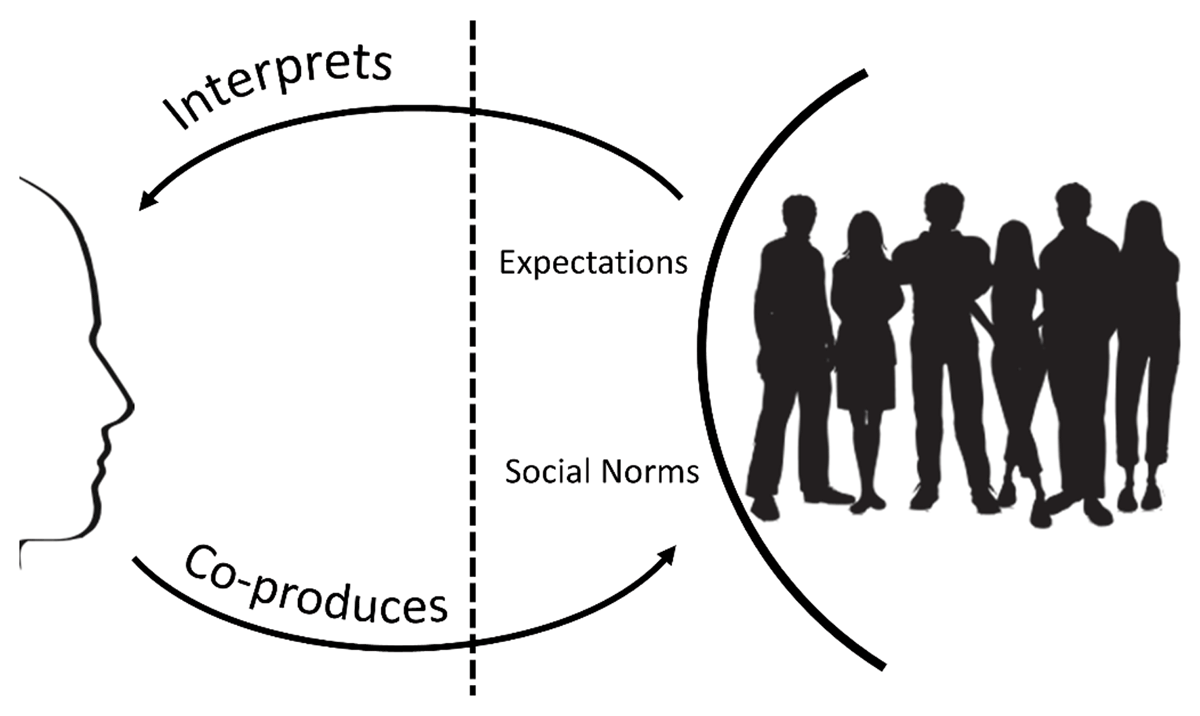
Figure 2
Model of professional shame illustrating individual experiences of professional shame and social impacts of shame responses (Huff et al., 2021).
Table 1
Participant demographic data by focus group.
| # | INST. | GENDER IDENTIFICATION | RACIAL/ETHNIC IDENTIFICATION | ACADEMIC MAJOR | YEAR/LEVEL |
|---|---|---|---|---|---|
| 1 | RU | 4 Men | 4 White | Mechanical | 1 first-year, 2 sophomores, 1 junior |
| 2 | 4 Men | 4 White | Mechanical | 2 sophomores, 1 junior, 1 senior | |
| 3 | 2 Women | 1 African American, 1 White | Civil, Mechanical | 1 first-year, 1 senior | |
| 4 | 4 Women | 1 Asian, 1 Middle Eastern, 2 White | Biological, Computer Systems, Mechanical | 1 sophomore, 2 juniors, 2 seniors | |
| 5 | 5 Women | 1 African American, 2 Asian, 2 White | Biological, Computer, Mechanical | 1 first-year, 1 sophomore, 3 seniors | |
| 6 | TU | 3 Women | 2 Hispanic, 1 White | Biological | 1 sophomore, 2 juniors |
| 7 | 4 Men | 4 White | Biomedical, Electrical, Mechanical | 2 juniors, 2 seniors | |
| 8 | 5 Men | 5 White | Computer, Electrical, Mechanical | 5 sophomores | |
| 9 | 2 Women, 3 Men | 2 Hispanic, 3 White | Biomedical, Electrical, Mechanical | 1 sophomore, 4 juniors | |
| 10 | 5 Men | 1 Hispanic, 4 White | Mechanical | 5 juniors |
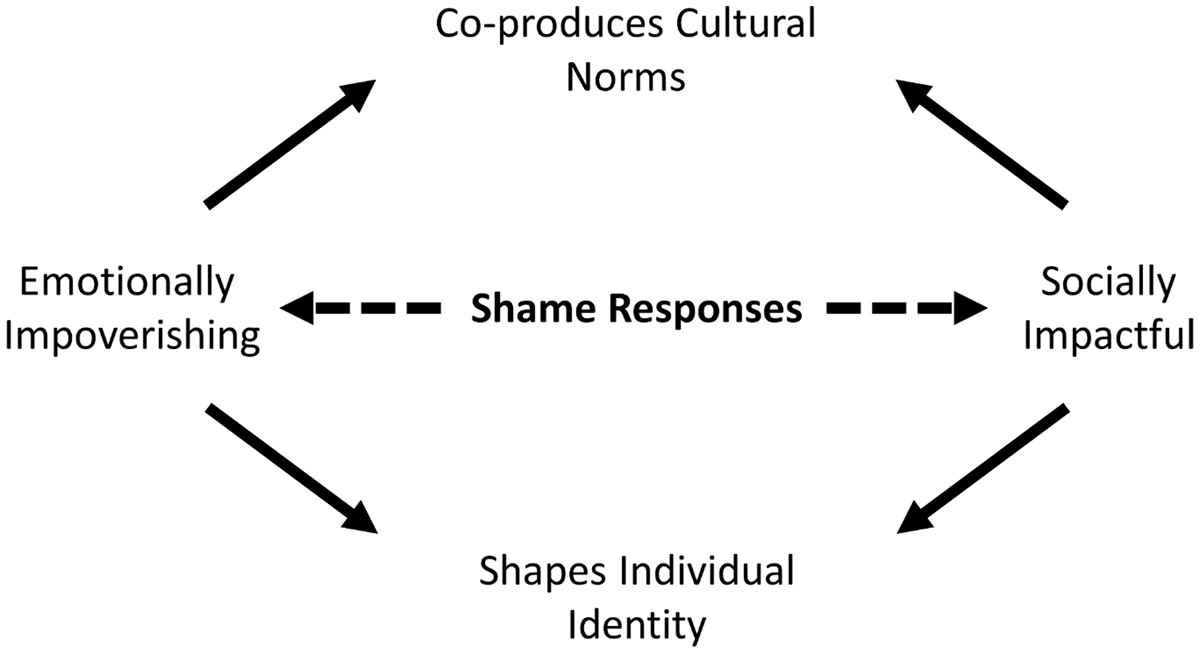
Figure 3
Shame responses at the intersection of individual identity formation and the collective construction of cultural norms.