Table 1
Five phases of qualitative data analysis.
| Phase | Methods | Data | Outcomes |
|---|---|---|---|
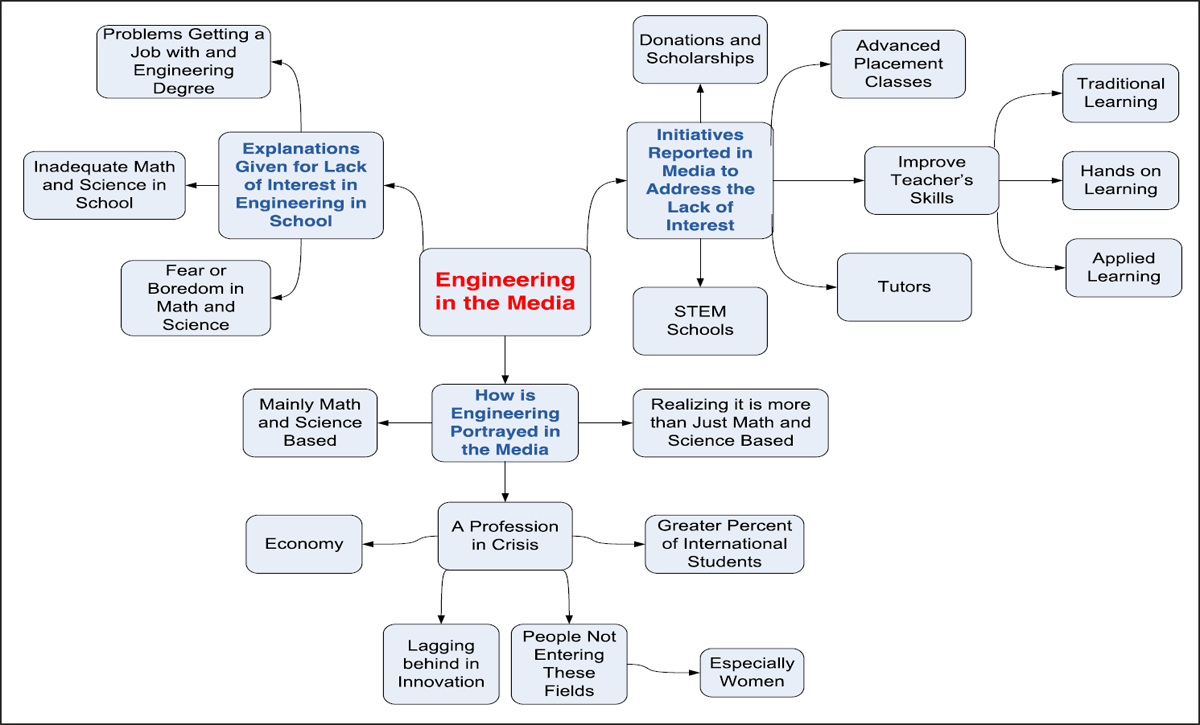
| 1. Preliminary data analysis (exploratory) | Used constant comparison (Strauss & Corbin, 1997) method to code the data into categories and sub-categories. Used three research questions to guide this coding: How is engineering portrayed in the media? What explanations are given for the lack of interest in engineering among high school and college students? And, what initiatives are reported on to address the perceived lack of interest? | Months 1 to 3 of the news articles (n = 804) | Hierarchal coding tree (see Appendix A) |
| Analysis of the coding tree from Phase 1 led us to adopt theoretical concepts from critical media studies (i.e., framing and agenda-setting) and methodological cues from Roe’s (1994) work on narrative policy analysis (NPA) (i.e., dominant, counter-, and nonstories) to inform the development and presentation of our research findings. We refined the research questions to reflect these theoretical and methodological frameworks, i.e., How is engineering framed in the public discourse? And, what dominant, counter-, and nonstories shape the ways in which we collectively understand, and seek to address, the problem of an apparent general lack of interest in engineering, and the very real lack of diversity, in engineering? | |||
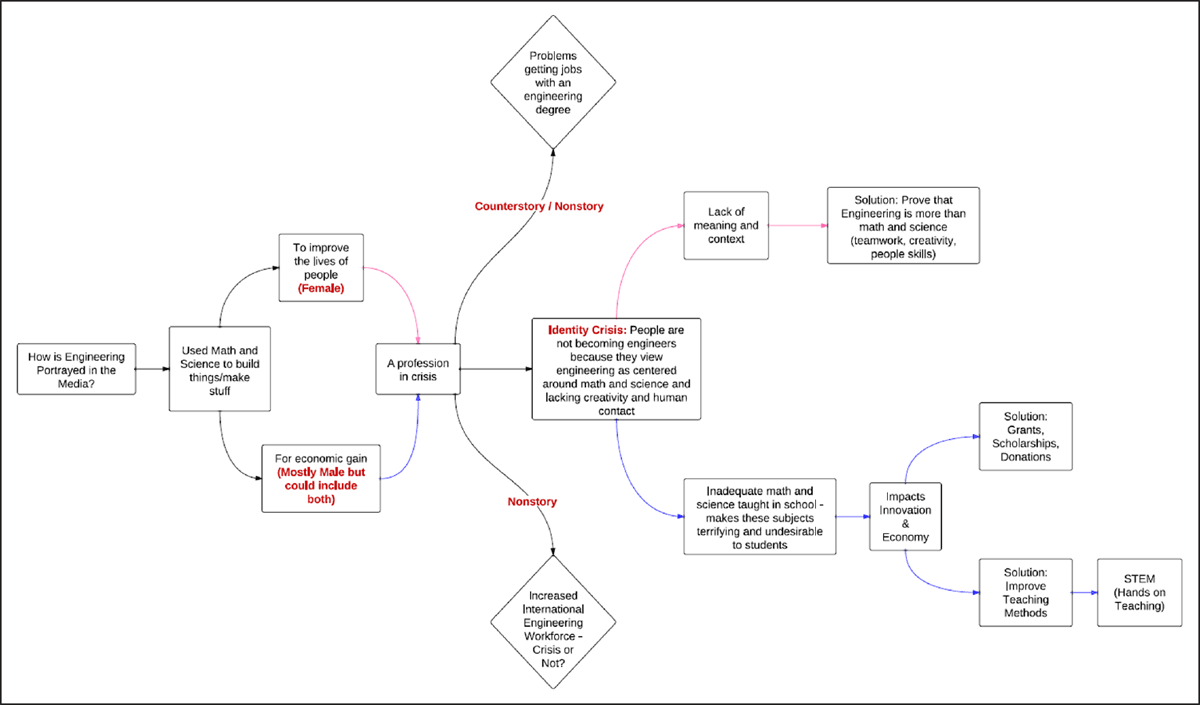
| 2. Focused data analysis (generative and emergent) | Examined the data for dominant, counter-, and nonstories. Used theoretical saturation (Glaser & Strauss, 1967) to focus and prioritize the data analysis. When categories (i.e., parts of stories) reached theoretical saturation, we directed our attention to other parts of the narrative model. | Months 4 to 8 of the news articles (n = 94) | Preliminary narrative models (see Appendix B for example) Theoretically saturated master quote documents Five draft dominant stories, one draft nonstory, and one draft counterstory |
| 3. Confirmatory analysis (conducted parallel to Phase 4 below) | Tested and affirmed the authenticity and appropriateness of the codes for the stories (Patton & Fund, 2002). | Months 9 to 12 of the news articles (n = 60) | Final model (see Figure 1) |
| 4. Development of story reports | Further enriched understandings of the stories through structured story reports. | All 12 months of data | Seven story reports that included: in-vivo descriptors, word clouds, a brief description, key quotes, subthemes and relevant quotes, connections to other stories, and outstanding questions and musings |
| 5. Writing of five dominant stories and the nonstory | Developed a narrative approach to present each of the five dominant stories, the nonstory, and possible directions for counterstories. | All 12 months of data | Dominant stories 1 through 5 and the nonstory, presented in the Findings |
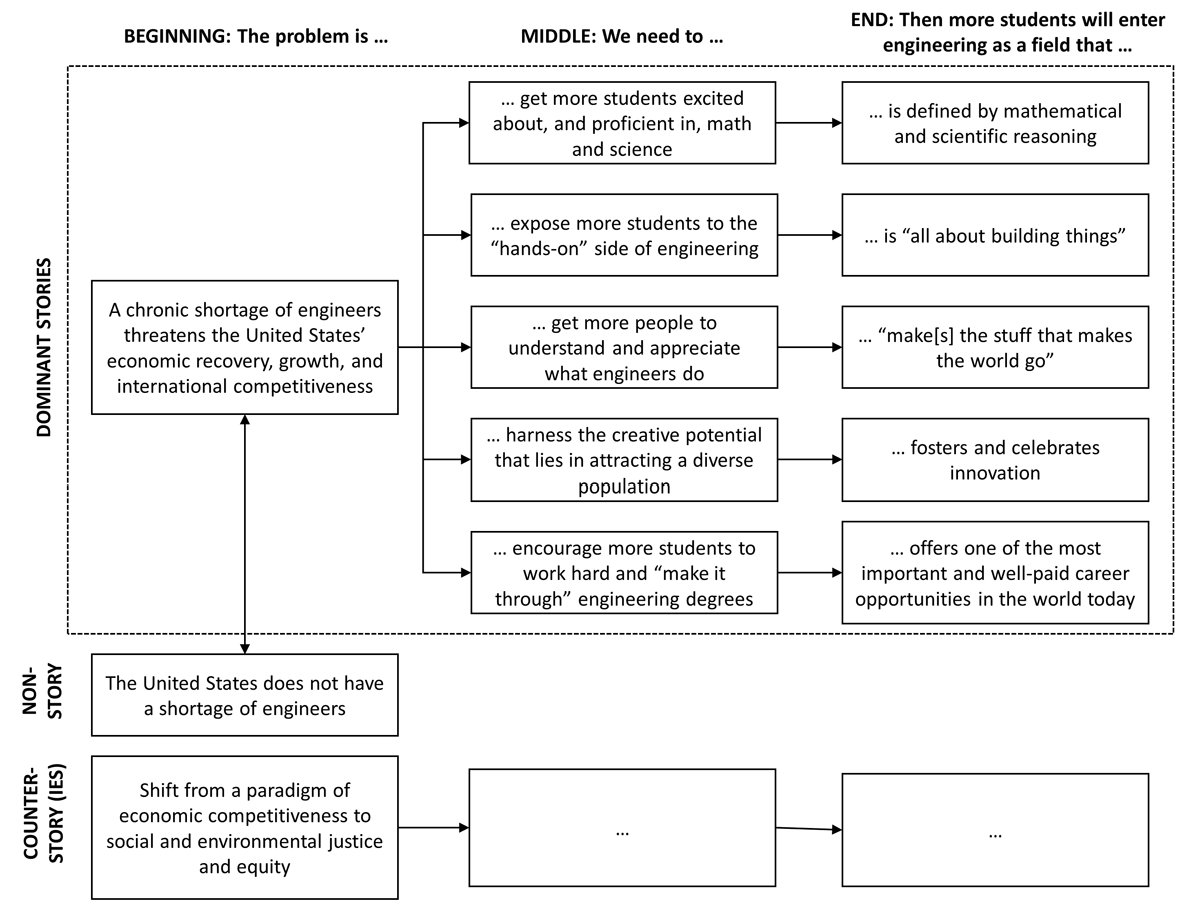
Figure 1
Illustrative model of five dominant stories and one nonstory identified in the data analysis. The stories show how different framings and assumptions about the field lead to different solution pathways. The figure also shows a possible direction to inform the construction of alternative narratives or counterstories.